
|
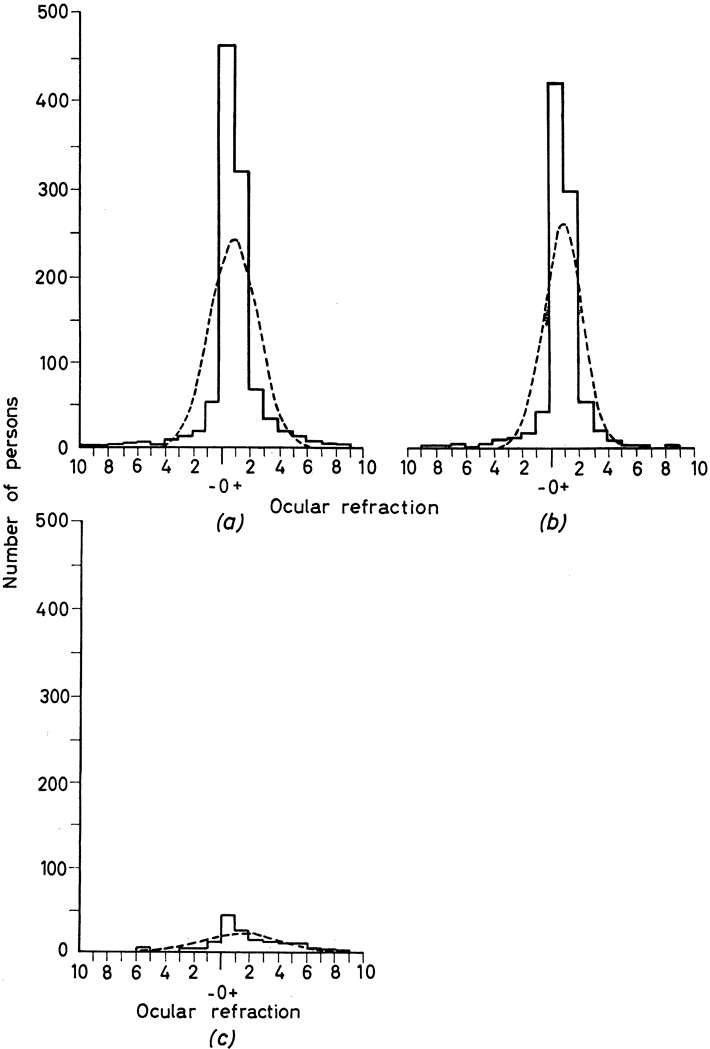
| Fig. 3. Curves of distribution of refractive error in 1033 national service recruits in England in 1957. All refractive error in the better eye is shown as the solid line. The broken line represents the underlying normal distribution with the same mean ocular refraction. a. All refractions. b. Spherical refractions (with astigmatism of from 0 to 0.5 D). c. Astigmatic errors (astigmatism of 0.6 D or more with or without a spherical error). (Sorsby A, Sheridan M, Leary GA: Vision, visual acuity and ocular refraction of young men. Br Med J 1:1394, 1960.) |