
|
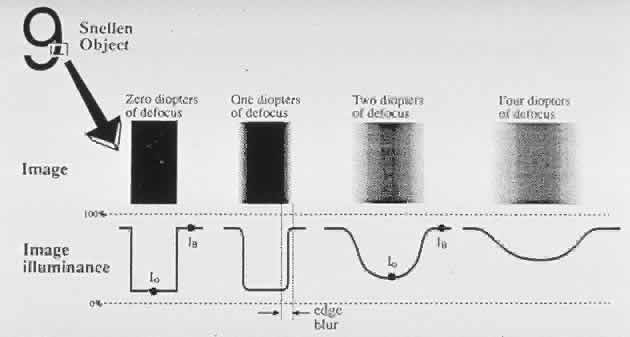
| Fig. 15. A graphic representation of what happens to a progressively defocused image. A plot of the light intensity across the image shows a flattening at the edge as the amount of defocus increases. (Atebara N: Image Contrast and the Optics of Multifocal lntraocular Lenses. Senior thesis. Harvard Medical School, 1991) |