Chapter 31
Physical Optics
DAVID MILLER and PAÛLO SCHOR
Main Menu   Table Of Contents

Search

HISTORY
WAVE MOTION
QUANTUM THEORY
ATOMIC STRUCTURE
COLOR
INTRAOCULAR LIGHT SCATTERING
DIFFRACTION EFFECTS
OPTICAL COHERENCE TOMOGRAPHY
ANTIREFLECTION COATINGS
POLARIZATION PHENOMENA
EYE COLORS
FLUORESCENCE
DENSITOMETRY OF SCHEIMPFLUG PHOTOGRAPHS OF THE LENS
THE DOPPLER SHIFT
REFERENCES

As eye doctors, we measure the optical properties of the eye and study its structures. To enable us to understand our instruments, we are taught that light acts as a stream of tiny particles, moving in straight lines that we call rays, and that these rays follow the laws of geometry.

Geometric optics, however, cannot explain why the sclera is white, the iris blue, and the fundus red, or why a cataract is opaque. Study of physical optics is needed to answer these questions. One might think of geometric optics as the workhorse of an ophthalmic practice, whereas physical optics can provide the intellectual excitement.

The discoveries of physical optics are rich in the secrets of the universe, and the unraveling of these secrets has allowed us to harness the major forces that surround us.

Back to Top
HISTORY
The subject of physical optics seemed to gather substantial momentum in 1666, when Isaac Newton directed a shaft of sunlight through a glass prism and collected the transmitted light onto a white surface. The prism had broken the white light into the colors of the rainbow. Although Leonardo da Vinci had actually performed the same experiment in his workshop in Milan 200 years earlier, he feared that the ruling powers might consider the work blasphemous and so he told no one, only recorded the findings in his journal in a mirror writing code. Fortunately, Newton was able not only to report his work, but also to speculate as to its mechanism. Newton had already stated that light rays were a stream of particles, a theory that adequately explained how lenses work. To this he added that white light was simply a combination of many colors, and that the prism refracted each color differently so as to make them all visible.

To some, the presence of many colors in white light suggested that the colored rays had unique qualities. Christian Huygens, a Dutch contemporary of Newton, preferred to liken the process of light to the process of sound waves. Since the pitch of a sound depended on its wavelength, he believed the different colors of light also had different wavelengths. Any new theory of light, however, would also have to explain the facts of geometric optics. Thus, he imagined a light beam as composed of many small, circular wavelets that interacted with each other to form a wavefront. Unless it were to strike an obstacle, this wavefront would travel forward in a straight line. If the wavefront were to strike a piece of glass obliquely, one end of the wave front would strike the glass first. The progress of that end of the front would then be slowed down in comparison to the other end, which would still be in air. In this way, the entire front would be bent, making a smaller angle with the normal. Huygens further suggested that each wavelength, upon entering glass, traveled at a different speed. One could say that he pictured the longer wavelengths as skipping with long strides and the shorter wavelengths, such as violet and blue, as moving more slowly, with short mincing steps, and so were refracted more.

Thus, the nature of light was in doubt until the beginning of the 19th century, when the creative physician-physicist Thomas Young not only demonstrated that the different colors were due to different wavelengths, but also managed to place the magnitude of the wavelength at 1/50,000 inch, which was rather close to the true figure.* His simple experiment is repeated in most high school physics courses today (Fig. 1). He allowed a point source of light to fall on two closely spaced apertures. Each aperture then served as a source of a cone of light, and the two cones overlapped on a screen. The overlapping region of the screen was made up of alternating light and dark bands. Young explained that light must be a wave because only waves could (1) interfere with each other so as to cancel each other out where dark bands fell; and (2) reinforce each other where the light bands fell (Fig. 2). He then used the spacing between the bands to calculate the wavelength. He reasoned that for a bright band to appear, rays coming from both slits must be in phase (i.e., the difference in distance between each slit and the bright band must be a whole number of wavelengths). When he used white light, the band pattern was colored, which allowed him to deduce that the red wavelength was about twice the length of the violet wavelength.


*Visible light waves range in size from 400 to 700 nm (1 nm = 1 billionth of a meter).


Fig. 1. Young explained interference among light waves by analogy with water waves. When the two sets of waves from the two apertures (A and B) are in phase (i.e., the curves intersect), they reinforce each other. (Artist, Neal Atabara, M.D.)

Fig. 2. Two waves of the same wavelength constructively interfere (left) if their crests and troughs coincide, producing a resultant wave that is the summation of the two waves' amplitudes. If the crest of one wave coincides with the trough of the other, destructive interference takes place and can lead to complete cancellation (right).

The wave theory also explained why a parallel beam of light seemed to diverge slightly as it passed through a small hole, and why light striking an opaque object cast shadows with indistinct edges.

Recall that Huygens pictured every point on a wavefront as a potential source of a series of waves in all directions, if the wavefront interacted with an obstacle. Thus, as a beam of light goes through an aperture, all the diverging wavelets are cancelled out by their neighbors to the right and left, and only the forward-directed waves are left, with one exception: the edges of the wavefront. At the right end, a right-sided wave has no right-sided neighbor on its extreme side. Thus, the edge of the beam veers sideways. It is almost as though the edge ray meets a friction between its one side and the edge, causing an apparent drag that forces the ray to veer off course. Again, the size of the wavelength is related to this edge effect: the longer the wavelength, the greater the diffraction. This phenomenon is exploited to produce the wide spectrum of colors in modern spectroscopes. A series of closely placed slits (thus yielding many edges) in the form of a diffraction grating produces a vivid spectrum in which red is bent the most and violet is closest to the center. This spectrum is the reverse of that produced by a prism, in which the shortest wavelength (violet) is refracted the most. The edge effect can be a problem in photography, when a large f number (small iris opening) is used to yield a greater depth of field or, as we will see, when the pinhole disc is used to improve visual acuity.

Back to Top
WAVE MOTION
The historical evidence we have recounted so far describes light as a wave motion. This means that when a wave runs over the surface of the water, a piece of cork floating on the surface will bob up and down but will not travel forward (Fig. 3). If you jiggle a rope, the hump moves forward but not the rope. These examples describe the essence of a wave as a state of motion that travels forward, forcing vibrations in its path. What, then, vibrates in the direction of a light beam to give the wave? Aristotle suggested that a universal ether filled the universe and that it vibrated. The French physicist Fresnel expanded this idea and pictured ether as a very thin elastic substance that even filled a vacuum. When a portion of the ether was distorted at right angles to a light beam, it snapped back immediately, even though light was traveling at a speed of 186,000 miles/second. It is ironic that by the mid 19th century, almost all the concepts of Aristotelian physics had been discarded, yet the physicists had no choice but to cling to the concept of ether if light was to be considered a wave.

Fig. 3. A moored boat bobbing up and down on the waves does not move forward. If a marker is attached to the mainsail, it will chart the amplitude of the wave.

The new idea that would eliminate the mystical ether was supplied by the brilliant Scottish theorist James Clerk Maxwell. Maxwell had been impressed by Michael Faraday's experiments, which had shown that both electrical energy and magnetism could be transmitted without wires or contacts. Faraday had further shown that a varying magnetic field could induce an electric current, and that an electric current could induce a magnetic field.

Maxwell was fascinated by these related forces, which seem to function at a distance. He took Faraday's findings and developed four differential equations to describe the quantitative interrelationship between electricity and magnetism. The equations placed the two forces at right angles to each other in a single electromagnetic field. The equations also suggested that if the changing electrical field induced a changing magnetic field, which, in turn, induced a changing electric field, the resulting electromagnetic radiation had wavelike properties. The equations also predicted the velocity of these radiations to be the same as the speed of light! Although Maxwell embraced the ether theory of the day, we can see that these equations implied that the wavelike properties of light were the same as the oscillating values of an electromagnetic field. Thus, we can imagine the oscillating field of a light beam as oscillating changes in the geometry of space. The concept of an oscillating field could take place in a vacuum, and the unrealistic ether could be abandoned.

Scientific thought has a strange way of going in cycles. Just when the particle theory of light was completely replaced by the wave theory, a type of light particle called a quantum was identified, which appeared to be the true representation of light.

Back to Top
QUANTUM THEORY
At the close of the 19th century, interest focused on radiations beyond the visible (i.e., ultraviolet, infrared, radiowaves). This work involved the heating of black elements, since black theoretically absorbed all radiation falling upon its surface. For example, the German physicist Wien studied the manner in which a black-body radiator glowed as it was heated. As the heat rose to 3000 K, the body glowed red; at 5000 K to 6000 K, it glowed yellow; and at more than 8000 K, the radiator glowed blue. Obviously, the heat had been converted to light, but how? At the beginning of the 20th century, the German physicist Max Planck had not only solved this problem, but in so doing had unearthed one of the most important physical principles of the 20th century. Planck had set about carefully measuring the radiant energy and distribution of wavelengths emitted as a black body was heated to higher and higher temperatures. Certainly, as the radiator glowed from red to blue, the frequency of the waves emitted increased. But careful measurement of the radiated energy showed that it climbed at a slower pace compared with the change in frequency. What was happening? In a lecture given in 1900, Planck said, “I find myself driven almost against my will to the assumption, unsuspected till now in physics, that the electromagnetic energy emanating from a source of heat is not continuous, but divided, as it were, into definite portions or quanta.”1

The energy of each quantum was equal to a constant that Planck had uncovered (6.623 × 10⁻²⁷ erg seconds) times the frequency, which acknowledged a wavelength—yet the final product was a particle of energy. Was Newton right all along? Well, almost. Physicists say that light is a stream of photons and that although light is thus not a moving wave, the probability that a photon will behave in a certain way is best described by a wave equation.* This concept is hard to picture, but it does account for all the facts. If Planck had persisted in the theory of the day (i.e., that radiant energy was emitted in a continuous fashion), he could not have explained the fact that the visible energy fell off as the black-body radiator was heated to higher temperatures. Therefore, he made two assumptions: (1) that energy is packed in discrete units, or quanta (i.e., you may have 1 quantum or 2 quanta but never 1½ quanta); and (2) that the energy content of a quantum varies with the frequency of the light. Thus, a violet quantum could have almost twice the energy of a red quantum because violet has double the frequency (i.e., one half wavelength). As the black-body radiator was heated to higher temperatures, energy was accumulating to fill a quantum of violet light. However, one might imagine that during this process, some energy “bled” off to fill the small quantum of red. For the higher frequencies of light, there was a lower probability that enough energy would accumulate to form a complete quantum. Naturally, as the temperature rose, the amount of energy available for radiation became so excessive that quanta for the high-frequency waves had time to form.


Imagine an experiment in which a very dim light source produces one photon at a time. The photon enters one of the two apertures from the Young experiment. The interference pattern will be recorded on film. Over time, millions of photons will reach the film. Each photon will produce a dot of light. The pattern can be thought of as fringes of dots of different densities. Wave theory equations help predict the probability of each photon location in the “interference pattern.”

The quantum theory remained half noticed, and not quite believed, until 1905, when Einstein used it to explain the photoelectric effect. For his famous equation, Einstein assumed that electrons on the surface of a metal emitter absorbed light energy, one quantum at a time. If the energy of the quantum was that which was precisely needed to overcome the forces holding an electron to the surface, the electron would be set free and a trickle of current would develop.

The quantum theory applies to the atom as well. It states that the energy of the atom assumes a certain definite spectrum of values characteristic for that species of atom. Usually the atom is in its lowest energy level, or ground state. When the atom is exposed to light of a frequency such that the energy of the photon equals the energy difference between the excited and ground states, the photon is absorbed, producing an excited state. One may also say that the light is in resonance with the atom. In a fraction of a second, the atom will fall back to its previous energy state and emit the energy difference. Einstein realized that every metal is resonant with a critical wavelength for this photoelectric effect.

Back to Top
ATOMIC STRUCTURE
If light quanta and electrons interact, they apparently are of a similar magnitude. Is light so fundamental as to be connected to the very structure of the atom? But what is the atom? In 1913, the Danish scientist Niels Bohr presented his model of the structure of the atom. It included a positively charged central nucleus surrounded by shells of swirling negative electrons. He went on to suggest that light had its origin in the atom. He pictured the various shells of electrons as behaving almost like a slot machine, which takes a variety of coins (i.e., the dime slot only takes a dime, the quarter slot only a quarter). The different electron shells will accept only a quantum of energy that corresponds with the innate nature of the shell. When energy is absorbed, an electron of one shell is raised to a new permitted orbit, where it stays for approximately a hundred millionth of a second. As the electron falls back to its original shell, an electromagnetic wave is released. The dimensions of the released wave (i.e., wavelength) are related to the dimensions of the electron shells involved in the interplay.
Back to Top
COLOR
Using this concept, one can explain why certain pigments take on the colors that they do. Molecularly speaking, pigments usually have a ring structure. Electrons move more freely within a ring structure than within a branched molecule. Therefore, the electrons, which are also considered to have wave properties, are allowed to have longer wavelengths, or lower frequencies, in ring molecules. Most molecules resonate with ultraviolet light; however, because of the Planck relationship and the ring structure of the molecule, pigment molecules resonate in a lower energy state and thus absorb visible light. The surface of pigment molecules has been likened to a sieve, and light falling on them to a series of colored balls, each colored ball being a different size. In the case of a red dye, all the colored balls but red would drop through the holes of the sieve and become absorbed, later to radiate in the invisible infrared. The red balls, however, accumulate on the sieve surface. Thus a molecule of pure red dye has its electron shells so arranged that quanta of all the visible wavelengths but red fit snugly into its dimensions and become absorbed. The red, on the other hand, is backscattered to the observer's eyes.

The physical dimensions of light and matter can also explain light scattering. If light strikes a structure larger than 1000 nm, the light is absorbed. If the structure is less than 1 nm, the light passes by unaffected. However, if the object has a size between 1 and 1000 nm, light will be absorbed and re-emitted as a ray of similar wavelength, but in a different direction. This phenomenon of light scattering takes place among the water particles of a cloud and is responsible for the clouds' opaque appearance. (In a subsequent section of this chapter, the principles of light scattering will help unravel the behavior of the edematous cornea and the cataract.)

Back to Top
INTRAOCULAR LIGHT SCATTERING

DEFINITION

Picture a shaft of light piercing a dusty room. The physicist sees each dust particle as an agglomerate of many atoms and molecules. These, in turn, are composed of negatively charged electrons and positively charged, heavy nuclei. When a stream of photons is absorbed by a dust particle, the electric field in the light beam can be pictured as exerting an oscillating force on both the nuclei and the electrons. The heavy nuclei remain unmoved, but the electrons are displaced from their normal orbits and move rapidly back and forth in synchrony with the driving electric field of the light beam. In so doing, light waves are radiated in all directions. The observer sees the shaft of light because his eye detects the sidewise-scattered light from each particle. If the room were clean of all dust or scattering particles, the beam would be invisible to the observer.

The situation becomes a bit more complicated when the scattering particles are spaced closer together than dust in a room. Certainly, each scattering element radiates light waves in all directions, and the total scattering is the sum of all the waves. But here is where a complication arises. Waves may add constructively or destructively. At any one observation outpost, the net amount of light reaching that point is determined by the sum of the constructive and destructive interference of all waves crossing that point.

Let's stop for a moment for a definition. The quantity that describes what point each wave is in its oscillation cycle is called the phase of the wave. The key concept in this definition is that the difference in phase between waves depends, in part, on the spacings of the scattering particles in comparison to the wavelength of light. If, for example, two scattering particles are spaced by distances comparable to one half the wavelength of light, the two scattered waves will be 180° out of phase and the waves will then cancel each other, giving no electric field at the observation point. If, however, two particles are spaced at distances that are small in comparison to the light wavelength, the phases will nearly be the same, and the scattered field will have an amplitude twice as large as each wave individually. Therefore, the final summation of all scattered waves will give a result that depends both on the relative positions of each scattering particle in comparison to the wavelength of light and on the direction of the scattered waves. For example, light is completely transmitted through a transparent medium such as water because the water molecules are tightly packed. This means that all the waves scattered sideways from each of the molecules travel a longer distance and are out of phase with each other and thus interfere destructively with one another in all directions, except the forward direction. In water, side-scatter is eliminated, but forward-directed light waves reinforce each other because their straight-ahead paths have similar lengths.

Another factor important in scattering is the overall regular arrangement of the scatterers. For example, the lens of the normal eye is made up of protein and physiologic fluid. The lens proteins are tightly packed in an orderly fashion, and there is very little change in the density of the scattering particles from point to point in the lens. Thus, the lens is transparent. If a clear lens homogenate is mixed with water, the proteins are dispersed and the density of the proteins fluctuates markedly, producing a random pattern. The result is a great deal of scattering and a milky-appearing solution.

In summary, the relationship between the size of the wavelength of light involved, the spacing of the scatterers, the size of the scatterers, and their arrangement determines the total scattering from a medium. This interaction is analogous to running one's finger over a smoothly polished surface. The surface feels smooth if the irregularities are small in amplitude and are spaced by distances that are small in comparison to the spacing between the pressure-sensitive receptors on the fingertips. The sense of touch has a certain resolving power and cannot respond to small-scale fluctuations. In the case of light and scattering, if the scattering medium has periodic fluctuations in arrangements of scattering components larger than the wavelength of light, then these can be sensed by light waves and scattering can occur. If the spacings of the scattering components of the media are shorter than one half the light wavelength, little scattering can occur.

It is time, now, to apply our theoretic understanding of light scattering. However, in order to explain some natural phenomena we will need to cover one more theoretic point. Lord Rayleigh showed that when light strikes atmospheric particles (particles smaller than the wavelength of light), the amount of light scattering is inversely proportional to the fourth power of the wavelength. Since the blue end of the spectrum is half the wavelength of the red end, the blue end is scattered by a factor of 24 or 16 times the amount of the red end. This seems logical, since small particles should interact more completely with smaller wavelengths.

At high noon, the sun's rays pierce the atmosphere in a perpendicular fashion (Fig. 4). Thus the shorter wavelengths of the sun's spectrum are more heavily scattered by the atmospheric particles, which splash the color blue all over the sky. This takes some of the blue away from the sun's own appearance, and it looks yellowish. At sunset, the light strikes the atmosphere at an angle and thus must travel a longer distance through the atmosphere (see Fig. 4). The additional particles scatter not only blue but also a significant amount of the longer wavelengths, and the sun's color goes from yellow to orange to deep red.

Fig. 4. At high noon, sunlight (a collection of all the colors) strikes the atmosphere in a perpendicular fashion. Note: blue is scattered to a far greater extent than green, which is scattered more than red. At sunset (left), the sun's rays travel a longer distance through the atmosphere. The sun's rays encounter more atmospheric particles; thus, after much of the blue has been scattered away, more of the green gets scattered. The result is a redder sun at sunset.

When you look at the lens of an elderly patient through the slit lamp, you will notice that the reflection from the anterior capsule is blue-white, whereas the reflection from the posterior capsule is a golden yellow. The double passage of light through the lens has resulted in a loss of blue light due to light scattering, producing the yellow reflection. The more nuclear sclerosis present, the yellower is the reflection. Thus we can think of the crystalline lens as a minus blue filter, because of both its yellow pigment and its preferential scattering of blue light.

This concept of the lens as a minus blue filter was suggested by Dr. Aran Safir2 and helps to explain why the optic nerve looks more yellow in the phakic eye than in the aphakic eye. In fact, to the medical student, the blue-white appearance of the optic nerve in the aphakic eye may be confused with optic atrophy.

In scleral tissue, we note that the collagen fibers are much larger than those in the cornea. Both the collagen diameters and the spacing between fibers are comparable to a light wavelength. Much scattering occurs in the sclera, resulting in an opaque appearance.

It might be helpful to return to nature for a moment and review what happens when a sunbeam strikes a cloud. Clouds are made up of air and water droplets, both of which are transparent; however, they differ in their optical indices of refraction. Air has a refractive index of 1 and water of 1.333. Thus, these two components, each clear by themselves, produce substantial scattering when the droplets of water are large enough to interact with the light waves and when the droplets are spaced more than one half of a wavelength apart. Light scattering, then, is what makes clouds look cloudy, scleras look white, and cataracts look gray. We will now look at the clinical examples in more detail.

NORMAL CORNEAL SCATTERING

In the normal state,1 the cornea is essentially transparent. Experiments show that the corneal stroma scatters approximately 10% of all light incident upon it.3 It is this small amount of scattering that allows us to see the corneal structures under the slit lamp.

But how can the cornea be so clear if it is made of structures as diverse as epithelial cells, collagen fibers (refractive index, 1.47), and a ground substance whose refractive index is close to that of water (1.333)? The epithelial cell layer may be considered as homogeneous units of a protein solution, with each cell so tightly packed against the next that almost no extracellular water accumulates and there is virtually no fluctuation in refractive index throughout the layers. In the stroma, the collagen fibers are approximately 25 nm in diameter, and the spacing between each pair of fibrils is 60 nm. These dimensions are 
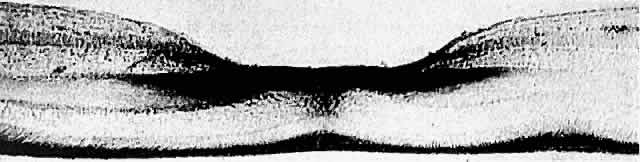
much smaller than a wavelength of yellow light (600 nm).4 Thus, the tiny dimensions and regular arrangement of these fibrils (Fig. 5) account for the minimal scattering.

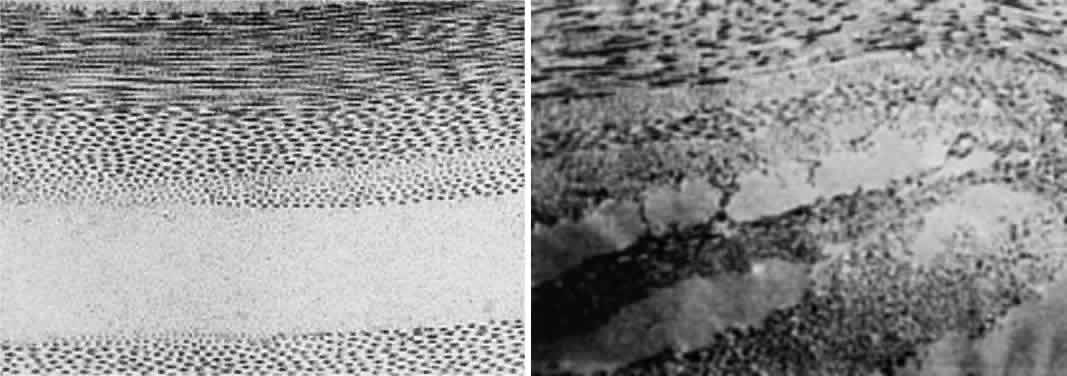
Fig. 5. Top. Electron micrograph shows the arrangement of collagen fibers in normal corneal stroma. Bottom. Electron micrograph of a corneal stroma with edema. Note the irregular collection of fluid. (Miller D, Benedek G: Intraocular Light Scattering. Springfield, IL, Charles C Thomas, 1973. Courtesy of T. Kuwabara, Howe Laboratory, Harvard Medical School)

CORNEAL STROMAL EDEMA

In cases of endothelial dystrophy, endothelial trauma, or endothelial incapacitation due to inflammation (i.e., iritis), the pumping action of the endothelium diminishes and the stroma takes on additional fluid and thickens. As interfibrillar fluid increases, the collagen fibers are pushed farther and farther apart. As the lakes of such fluid exceed one half of a wavelength of light in dimension, light scattering increases and the cornea takes on a gray appearance (see Fig. 5).4

CORNEAL EPITHELIAL EDEMA

In cases of advanced endothelial impairment or acute glaucoma, fluid collects between the epithelial cells (Fig. 6). Fluctuations in the refractive index develop, and as the spaces between the cells grow, the intensity of the scattering, or haze, grows. Potts and Friedman5 have shown that in total corneal edema, the epithelial component accounts for the greatest share of light scattering.

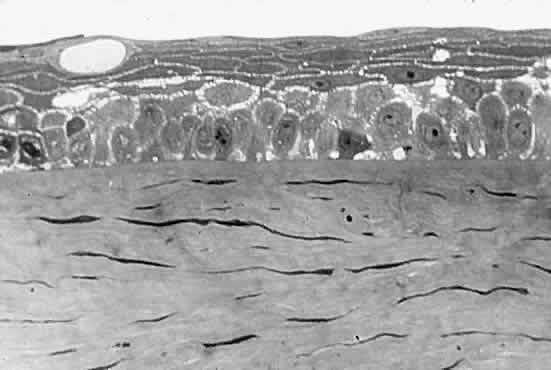
Fig. 6. Edematous epithelial layer of cornea as seen in a light micrograph. (Miller D, Benedek G: Intraocular Light Scattering. Springfield, IL, Charles C Thomas, 1973. Courtesy of T. Kuwabara, Howe Laboratory, Harvard Medical School)

CORNEAL SCARS

When discontinuities in Bowman's membrane in ulceration, trauma, or refractive surgery induces scar formation close to the pupillary center, visual acuity decreases. Scars interfere with vision in two basic ways: (1) they cause an irregularity of the corneal surface, producing irregular astigmatism; (2) stromal scars contain either randomly arranged collagen fibers, the diameters of which are five times the diameter of normal corneal fibrils, or unusual material such as hyaluronic acid, which pushes the collagen fibers far apart. This results in backscatter of light, which yields a white appearance to the observer and foggy vision to the patient.

SCATTERING IN THE NORMAL LENS

The normal lens is not as transparent as the normal cornea. This is partially caused by the faint yellow pigment, which absorbs 10% to 40% of all visible blue light. This hint of yellow is augmented by normal Rayleigh scattering, present in the healthy lens. The normal clear lens, composed of tightly packed high-protein-content lens fibers, scatters a small amount of light. With aging, however, large protein aggregates form within the lens fibers, reaching molecular weights of approximately 50 × 106 g/mol.

CATARACT

As a cataract develops, a normally uniform background of proteins is disturbed by large lumps of protein aggregates. If these large lumps are uncorrelated in position, and if the aggregates are large enough, significant scattering will produce a turbid appearance. As the protein continues to clump, fluid pools develop between lens fibers, and scattering increases further. At some point in this progression, the clinician decides to describe the patient's lens as cataractous.

SCATTERING IN THE NORMAL VITREOUS

The vitreous, a composite of a 1% hyaluronic acid solution, is interspersed with collagen fibers of approximately 10 nm in diameter.6 These fibers are almost three times smaller than the normal corneal collagen fibers. Since the scattering from each fiber is proportional to the fourth power of the collagen diameter, we can expect the scattering per fiber to be 80 times weaker for vitreous collagen than for corneal collagen. Thus, the effect of the collagen in the vitreous is quite small, and the vitreous will scatter only 0.1% of incident light. With age, vitreous collagen fibrils coalesce, fluid pockets form, and localized scattering develops to the point where the patient notices floating specks and threads.

RETINAL SCATTERING

Because the ubiquitous Mu¯ller cells seem to squeeze tightly within the spacings between the retinal cells, the tissue is homogeneous from a refractive index standpoint and scatters about as much light as the cornea.

If, however, the blood supply to a retinal area is interrupted and infarction takes place, the area fed by the occluded vessel becomes milky gray. With infarction, edema fluid accumulates in the nerve fiber layer. Because the refractive index of edema fluid differs from that of the nerve fiber axons, the area loses transparency.

GLARE

The term “glare” is often used to describe the contrast-lowering effect of stray light on a visual scene. The outfielder is said to lose a fly ball into the sun because of glare. Extra light thrown onto the retina tends to wash out the contrast of the event we are viewing. For example, every student is aware of the importance of pulling down all the shades and darkening the room if all the details of a slide projected on a screen are to be appreciated. Because of the nature of the light-detecting mechanism at the retina and in the brain, we cannot see intensity differences efficiently in the presence of a high background of light intensity.

This sensitivity to glare is amplified as lens (or corneal) scattering is increased. For example, the older surgeon cannot see the details within a deep surgical wound in the presence of white surgical sponges.7 These sponges act as extraneous light sources, which are scattered by the aging crystalline lens onto the macula of the surgeon's retina.8 Again, the patient with a poorly fitted contact lens who develops epithelial corneal edema reports unusual glare from automobile headlights at night. In cases of cataract or marked corneal edema, the patient has difficulty reading in a bright environment, where all the elements of normal light become sources of glare. This phenomenon is illustrated in Figure 7.

Fig. 7. Manner in which turbid cornea scatters off-axis light onto foveal image, thus decreasing contrast of image. (Miller D, Wolf E, Jernigan ME et al: Laboratory evaluation of a clinical glare tester. Arch Ophthalmol 87:329, 1972. Copyright © 1972, American Medical Association)

Some time ago, we wondered what percentage of a lens must actually become cataractous or, put another way, how much of the lens must remain clear before scattering and consequent glare reach levels significant enough to impair visual acuity. Although contrast started to drop slightly when almost half the lens was “covered with cataract,” contrast dropped suddenly when 80% of the lens became cataractous.9

Thus, light scattering, glare, and visual performance are all tightly bound together.

CLINICAL GLARE TESTING

In 1926, the industrial scientist L.L. Holladay10 first described the relationship between glare and contrast sensitivity. Holladay developed a mathematical relationship between the glare source (its brightness and angular distance from the target) and contrast sensitivity. In the 1960s, Ernst Wolf,8,11,12 a Boston visual physiologist, built a laboratory glare tester and showed in a normal population that glare sensitivity increased with age. He also showed that this increase in glare sensitivity was related to the increased light scattering of the normal, aging lens. In the 1970s and early 1980s, Miller, Wolf, Nadler, and others13,14 built and tested the first clinical glare tester (Miller-Nadler glare 
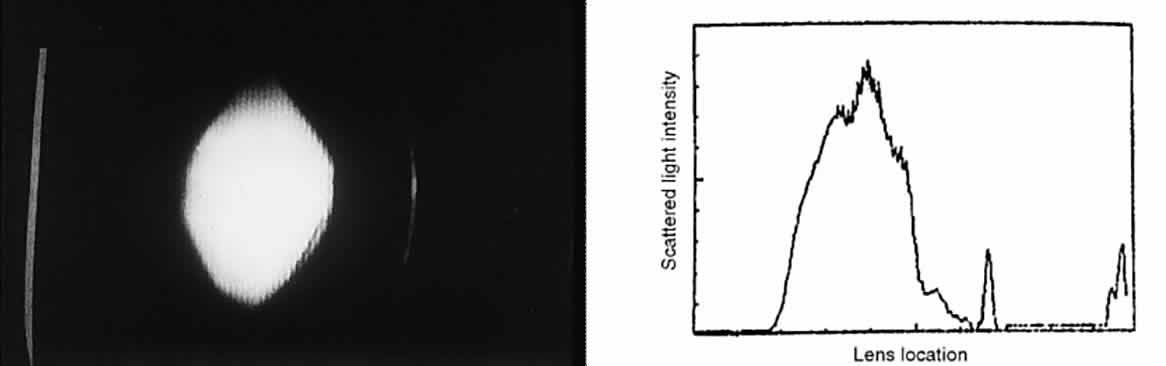
tester; Fig. 8). With this device, they demonstrated a connection between cataract progress and increased glare sensitivity.14 Figure 9 shows a plot of glare sensitivity versus visual acuity in 144 patients with cataracts. What strikes one immediately is that the visual acuity is randomly scattered throughout the plot, whereas glare sensitivity increases in an orderly progression. Glare sensitivity also correlated highly with the degree of posterior capsule opacification after extracapsular cataract extraction and intraocular lens implantation.15

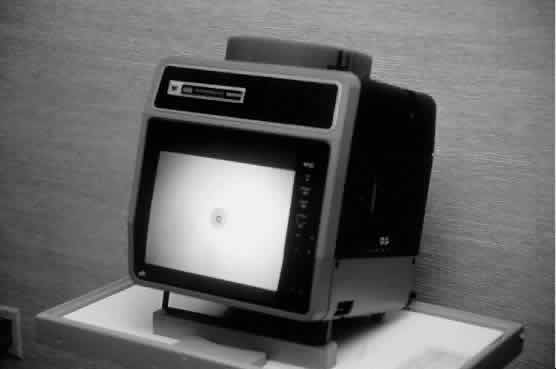
Fig. 8. The Miller-Nadler glare tester is an example of variable contrast target using the Landolt ring surrounded by a glare source. (Nadler MP, Miller D, Nadler DJ: Glare and Contrast Sensitivity for Clinicians, p 27. New York, Springer-Verlag, 1990)

Fig. 9. Study of 144 patients with cataracts in which visual acuity versus glare sensitivity was plotted. Note how many patients with increased glare sensitivity had good visual acuity. (LeClaire J, Nadler MP, Weiss S, Miller D: A new glare tester for clinical testing. Arch Ophthalmol 100:153, 1982)

GLARE TESTER CHARACTERISTICS

Glare testers offer two types of targets: a standard Snellen visual acuity chart and a variable contrast sensitivity target. The variable contrast targets may be presented as (1) sinusoidal contrast gratings; (2) the Snellen chart printed in different contrasts; or (3) the Landolt ring presented in different contrasts. To determine whether a variable contrast target or a standard visual acuity target would be more valuable in cataract testing, we designed an experiment using scattering filters of progressive severity (simulated cataracts).4,16 These laboratory experiments suggested that a variable contrast target in the face of a glare source follows cataract progression more smoothly than a conventional visual acuity target.

QUANTIFICATION OF GLARE ON CONTRAST SENSITIVITY

We have asserted that ocular lesions that scatter light degrade contrast sensitivity by splashing extra noninformation containing light onto the retinal image. This can be demonstrated by a simple calculation put forth by Prager and colleagues.17

Suppose we wanted to measure the contrast of the standard projected Snellen chart in both a darkened examining room and a lighted one. Contrast is the difference between the luminance of the target and its background, and can be expressed as a percentage, as follows:

To calculate the contrast of the projected Snellen chart in a darkened room, let us say the background illumination is 97 arbitrary light units, and the target illumination (consisting of letters) is 3 light units. This gives the following:

Let us now turn the room lights on, thus placing an additional 50 light units onto both the background and letters of the projected Snellen chart. The new contrast is given by the following:

We see that this simple maneuver cuts the contrast in half. Just as the Snellen chart drops its contrast when extra light falls upon it, the retinal image loses contrast when a corneal lesion scatters extraneous light onto the macula (see Fig. 7). There are a number of simple ways to decrease glare and improve contrast:

  1. Using side shields on the temples of spectacles prevents glaring sidelong rays from striking the eye (Fig. 10).
  2. Watching the television set with the room lights off prevents annoying glare from ceiling or lamp light from striking the eye.
  3. Wearing polarized sunglasses will cancel out the reflected glare from shiny surfaces (e.g., car hoods, lakes, glossy paper)
  4. Wearing a peaked cap or wide-brimmed hat prevents the overhead rays of the sun from striking the eye.
  5. Replacing scratched or pitted automobile windshields reduces glare from the sun and oncoming headlights.

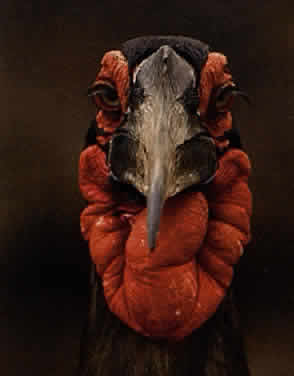
Fig. 10. Example from nature of a functional visor. Because the ground hornbill's lids are prominent and its eyes recessed, a visor effect is created. (Colors in the Wind, p 25. Washington, DC, National Wildlife Federation, 1988)

Surgical Methods

When these methods fail to help a patient who has glare disability, surgical removal of the scattering lesion should be considered. Significant corneal edema or permanent corneal scars can be treated by a corneal transplant. A significant cataract should be extracted. Finally, an opaque lens capsule after cataract surgery, which produces glare symptoms or reduced contrast sensitivity, requires a capsulotomy. Because the glare disability is proportional to the ratio of the area of capsule opening over the area of capsule opacity, the size of the capsulotomy 
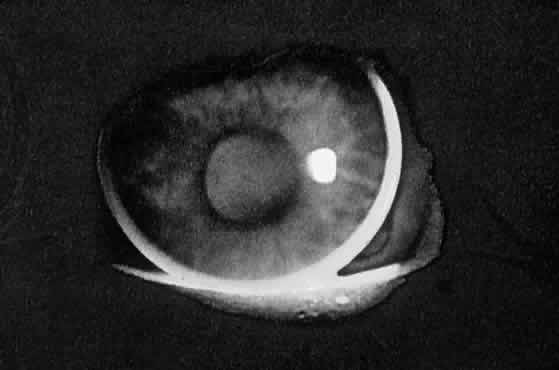
must be considered. The size of the optimal capsulotomy equals the size of the pupil (Fig. 11).18

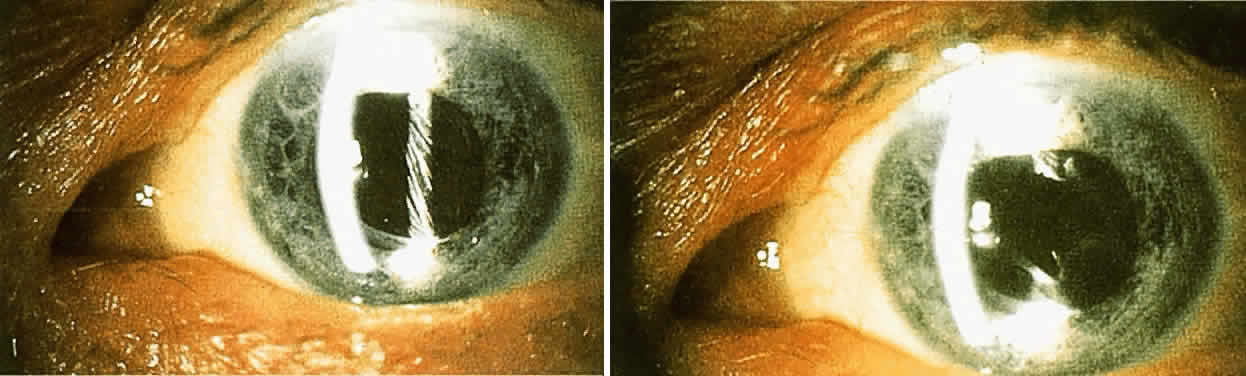
Fig. 11. Top. Opaque lens capsule (note diagonal lines in capsule). Bottom. Same capsule with laser-made opening.

Back to Top
DIFFRACTION EFFECTS

LASER INTERFEROMETRY

When a patient develops a cataract and a concomitant decrease in vision, the ophthalmologist must decide whether the visual loss is completely explained by the lens changes. The problem may be compounded by a history of degenerative retinal disease.

If a way could be found to bypass the lens opacity, or any ocular opacity for that matter, and project a resolution target directly upon the macula, the question of the state of retinal function might be answered. It occurred to Green and colleagues19 at the University of Michigan that a proper resolution target could be a set of interference fringes of light and dark bands. The source of the interference fringes could be two tiny light sources, which could be focused directly onto two relatively clear areas in the opaque lens. These tiny sources could then direct their rays, without obstacle, toward the retina, and their light would interfere with each other to produce dark and light bands upon the retina.

Thus, the Michigan group essentially duplicated Thomas Young's original experiment, with a few important changes. The two-point light source came from a safe, low-power HeNe laser. Laser light, being coherent and of one pure color, can come to a very fine point focus and produces vivid interference patterns. The light of the HeNe laser, being red, is also scattered less than other visible wavelengths and thus penetrates the opaque media more cleanly. Finally, Green was able to alter the widths of the dark and light bands by altering the spacing of the two light sources and thus present resolution levels comparable to the scale of the Snellen letters.20,21

Figure 12 contrasts the patterns seen by patients with normal vision and patients with cataracts.

Fig. 12. Interference fringes as they appear normally (top) and with double images focused on tissue paper placed over camera lens (bottom). Cataract patients may see continuously changing fringe patterns similar to those patterns on the bottom. (Green DG: Testing the vision of cataract patients by means of laser generated interference fringes. Science 16(June):5, 1970 [cover photo]. Copyright © 1970, American Association for the Advancement of Science)

The potential acuity meter is another device for testing retinal visual acuity. It projects a small Snellen chart through a small, clear space within an irregular cornea or partially cloudy lens onto the retina. This approach minimizes the influence of the anterior segment problem. It is used to predict postoperative visual function.22

HALOES

Every medical student is taught that patients with angle-closure glaucoma report seeing colored haloes. Interestingly, similar haloes are more commonly associated with the presence of early cataracts or epithelial corneal edema from poorly fitted contact lenses. In this section, we present the optical derivation of these haloes.7

Lens Haloes

Figure 13 is a histologic frontal section of a lens wedge showing cross-sections of lens fibers, stacked like pancakes. This radiating pattern is known as Rabl's lamellae, the fibers being more uniform beneath the epithelium and becoming thicker and irregular as they age and approach the nucleus. At the boundaries between the fibers, the refractive index is different from that in the fibers. Thus, the quasiregular fluctuation in refractive index acts as a radial diffraction grating and produces a circular interference pattern, or halo. The intensity of the halo increases as the separation between fibers widens. This occurs during cataract formation, when fluid accumulates between the fibers. It should also be pointed out that the lens fiber pattern is only regular enough to produce these effects from 2.5 mm from the lens center to the lens periphery. The optics are explained in Figure 14. Thus d in the equation d sinθ = λ represents the width of the lens fibers. Halo experiments predict the lens fiber diameter to be 10.5 μm, which agrees nicely with histologic measurements. As in all diffraction effects, the longer (red) wavelengths are diffracted more and appear at the edge, whereas the blue wavelengths are closer to the center of the halo.

Fig. 13. Histologic section of lens near periphery showing how Rabl's lamellae merge with the less uniform regions of the lens. (Kolmer W, Lauber H: Handbuch der M. Kroskopischen Anatomie des Menschen. Haut und Sinnesorgan II, Augen, p 273. Berlin, Julius Springer, 1936)

Fig. 14. Oblique view of lens of the eye showing the location of Rabl's lamellae (upper diagram). Lamellae of the lens likened to a diffraction grating (lower diagram). d, spacing between the lamellae; θ, angle between diffracted and incident waves; λ, wavelength of light. (Miller D, Benedek G: Intraocular Light Scattering. Springfield, IL, Charles C Thomas, 1973)

Finally, it should be noted that the location of the radial scattering elements on the lens periphery also serves as a basis for distinguishing lenticular haloes from those of corneal origin. Ask the patient to view with a stenopeic slit the point source of light producing the halo. As the slit is moved downward, the patient will see only fragments of the halo if it originates in the lens. If the halo is corneal in origin, the whole halo will still be seen, but dimmer with the slit than without.

Corneal Haloes

The ancient sailor knew that a ring around the moon meant foul weather the next day. Rings, or haloes, around the moon are created by ice crystals in the atmosphere, which act as a cosmic diffraction grating. In a similar way, edematous corneal epithelium produces haloes.

Let us refer back to Figure 6, which represents corneal epithelial edema, the type seen in, for example, acute glaucoma, advanced endothelial dystrophy, and contact lens overwear. When edematous, the basal epithelial layer acts as a diffraction grating and appears to be the origin of the halo. In physical terms, we have a meshwork of edema fluid of one refractive index surrounding basal cells of another refractive index. If this fluctuation in refractive index has a regular pattern and covers 10 or more cells, it will serve as a diffraction grating. A series of colored rings representing the colors of the spectrum is called one order of interference rings. A second series of colored rings outside of the first is called a second order of rings. The larger the edema pools between epithelial cells are, the brighter is the second order.

The halo itself often consists of two orders of colored rings, the outer order being somewhat fainter.

PINHOLE DISCS

Diffraction is an edge phenomenon, in which the relative impact of the diffraction is proportional to the ratio of the circumference of the edge to the area of the aperture:


πD/(πD2/4) = D/4

Therefore, as the pupil of the eye or the camera gets smaller, the ratio 4/D gets greater. This effect was brought out clearly in a series of experiments in which we attempted to correct various degrees of refractive error with different-sized pinholes.23 The pinhole improves vision by increasing the depth of focus; however, it obscures vision by introducing diffraction effects.

For example, a 0.5-mm pinhole could allow 20/40 (6/12)* vision in the presence of an 8 D refractive error, and 20/70 (6/21) vision in the presence of a 12 D error. Yet when our subject, who had no refractive error, looked through a 0.5-mm pinhole, he achieved a visual acuity of only 20/30 (6/9) because of the obscuring effect of the diffraction. The 1-mm pinhole (the one found in the clinician's office) allowed our subject to see 20/40 with a 5 D refractive error and 20/200 (6/60) with a 9 D error. However, it too could produce vision no better than 20/25 (6/7.5) in subjects with no refractive error. This diffraction effect on vision is seen until the pupil size reaches 2 to 2.5 mm.


Metric equivalent given in parentheses after Snellen's notation.

Back to Top
OPTICAL COHERENCE TOMOGRAPHY
Ocular coherence tomography (OCT), a new device, has been used to evaluate intraocular structures based on the low-coherence interference phenomena, similar to the one described by Thomas Young almost two centuries ago.

In OCT, a beam of light is directed onto the tissue or specimen to be imaged, and the internal structure is measured noninvasively by measuring the echo delay time of light as it is reflected from microstructural features at different ranges. Two-dimensional imaging is accomplished by performing successive axial (longitudinal) range measurements at different transverse positions.

The resolution of echo-based devices such as ophthalmic ultrasound and OCT is based on the ratio of the speed of the emitted wave to that of the reflected wave. Traditional ultrasound measurements are achieved with a frequency of approximately 10 Hz and have a 150 μm resolution. New ultrasonic devices increased the resolution by increasing the frequency (up to 100 Hz), but they cannot penetrate more than 4 to 5 mm into the eye. With light-based devices such as the OCT (wavelength, 800 nm), scientists have been able to increase the resolution up to 15 μm. The emitted light beam is split into a reference beam (that goes to a mirror) and a measurement beam (that goes to the patient's eye). The reflected reference and measurement light beam are combined, and their intensity is measured by a photodetector. Positive interference (brighter light) is achieved by moving the mirror (reference light beam) until the distance the light travels to and from the reference mirror precisely matches the distance that light travels when it is reflected from a given structure in a patient's eye.

Dependent on the transparency of the optical media (i.e., cornea-lens-vitreous-retina), the device is limited by opaque media disorders. Its major uses are the observation and analysis of the posterior pole tissue contour (i.e., disc, macula) and the measurement of tissue layers (retina).24

Back to Top
ANTIREFLECTION COATINGS
Approximately 4% of visible light is reflected from either the front or the back surface of a lens. These ghost images can often wash out image contrast. Thus, all fine camera lenses have antireflection coatings.

Surface reflectance depends on the difference in refractive indices for air and glass. For visible light, this is approximately the difference between 1 and 1.5. By selecting a material with a refractive index that falls between these two values (near the geometric mean), and by applying a coating of approximately 0.25 wavelength optical thickness to the surface, it is possible to reduce the reflectance significantly (Fig. 15). Magnesium fluoride (MgF2), a durable substance with an index of 1.38 at 550 nm, is the most commonly used coating material for single-layer antireflection coatings. Instead of one reflection at the air-glass interface, there is now a reflection at the air-MgF2 interface and a second reflection at the MgF2-glass interface. These reflections interfere destructively, resulting in a minimum reflectance within the visible spectrum (at normal incidence) of 1.5% or less, as compared with the original 4% for the uncoated glass surface. From the principle of energy conservation, there must be a corresponding increase in overall transmission of a coated surface, including both interfaces.

Fig. 15. Top diagram shows how antireflection coating is applied to glass surface. Lower curve shows reflection loss as a function of the angle of incidence. (Optics Guide, p 24. Irvine, CA, Melles Griot, 1975).

As a specific example, a ray impinging on the surface of an uncoated aspheric lens (refractive index, 1.523) near its edge at an angle of incidence of 58° would have a reflection loss of 8.3%. Lenses with steep front surfaces tend to produce larger angles of incidence and thus produce stronger reflections. However, by the addition of a single-layer MgF2 antireflection coating designed for normal incidence, the reflection loss is reduced by more than one half, to 3.6%. Only at angles of incidence larger than 60° does the reflectance of such a coated surface exceed 4%. A practical way to test whether a lens has been coated is to look at the reflected image produced. Coated lenses produce a bluish or greenish, rather than a yellowish, reflection.

High transmission and aesthetics are important reasons why contact lenses are currently so popular. Besides these factors the low reflectance may be beneficial in situations such as reading with a bright light behind and to the side of the head. With normal eyeglasses, the reflected light from the back of the lens would strike an incipient cataract, producing an annoying scattered light on the retina, which decreases the contrast of the retinal image.

In a sense, one might consider the crystalline lens to have a type of antireflection coating. The third Purkinje image (from the front surface of the lens) is quite dim. Because the intensity of the reflected image is proportional to the difference in refractive indices between the lens and the surrounding media, a dim reflected image is the result of a small difference between lens and surrounding media. The refractive index of the outer layers of the mammalian lens is close to that of the aqueous. The refractive index gradually increases toward the nucleus. A reflection from a synthetic intraocular lens is quite noticeable, however, because of the large jump in refractive index from aqueous (1.33) to implant (1.48).

Back to Top
POLARIZATION PHENOMENA
Since the time of Thomas Young, light has been considered a wave phenomenon. The waves vibrate in a plane perpendicular to the line of motion of the light. Thus, if a light ray emerged perpendicular to the plane of this paper, the light waves would be considered to be moving up and down, right and left, and in every conceivable diagonal direction, and all within the plane of this paper. For simplicity, physicists vectorially divide all the directions of vibration into up-and-down components and equal side-to-side components. Such light is considered unpolarized.

To remove one component, it should be possible to locate a transparent material whose molecular anatomy resembles a picket fence. In such a case, the up-and-down component of the wave might squeeze through, but the side-to-side vibrations would collide with the pickets and be redirected, producing two separate light rays. Such a material (crystals of calcium carbonate known as Iceland spar) was discovered in 1669 by the Dutch physician Erasmus Bartholinus.4 We now know that as light penetrates the crystal, vibrations parallel to the planar carbonate groups are slowed down, as if bumping into these molecular “pickets,” to a greater degree than the vibrations perpendicular to these groups. The result is an ambivalent crystal that refracts light waves vibrating in one direction differently than it refracts those vibrating in a perpendicular direction. In 1828, the British physicist William Nicol glued two pieces of Iceland spar together in such a way that light waves vibrating in one direction passed through the crystal; the other waves were refracted differently and so struck the crystal-glue interface and were reflected out of the way. Thus, light emerging from a Nicol prism would be considered plane polarized, representing about half the original light intensity. If this light then passed through a second Nicol prism, aligned in a similar fashion, the light would pass through unchanged. However, if the second Nicol prism, called an analyzer, were rotated by a small angle, the molecular pickets would eliminate some of the plane-polarized light. Finally, if the second Nicol prism were rotated in an orientation 90° from the first, no light would get through (Fig. 16).

Fig. 16. Two polarizing elements with parallel axes (upper diagram). Axes perpendicular to each other, thus extinguishing the light (lower diagram). (Optics Guide, p 166. Irvine, CA, Melles Griot, 1975)

In 1932, Edwin Land made available an inexpensive substitute for the Nicol prism, which he called polaroid. Polaroid is made of an extremely thin layer of many fine crystals of iodine and quinine sulfate. This compound, known as herapathite, after its discoverer W.B. Herapath, is unique in that it strongly absorbs one of its double-refracted beams so that light vibrating in only one direction gets through. Land succeeded in lining up all the crystals in one direction and imbedding them in plastic sheets, which could be manufactured on a commercial basis.

As a sunglasses material, polaroid not only attenuates the light, but also eliminates reflected glare. When light is reflected from the surface of water, it is partially polarized (i.e., part of the reflected rays are plane polarized). If the axis of the polaroid sunglasses is oriented perpendicular to this direction, much of the reflected light will be absorbed.

The polarization principles have been around for more than 100 years, with some ophthalmic applications. The three-dimensional (or stereoscopic) vision seems to be related to the capacity of our brain to interpret slightly different images from both eyes. Nature uses the interocular distance itself as a source for the disparity by providing two different observation angles for real objects. An artificial way to recreate this angular disparity is through the use of polaroid glasses and polarized printed images. The light from each picture vibrates in a different direction, and each polarizing lens allows only one direction of vibration to be transmitted to each eye. Therefore two slightly different images are received by the brain and interpreted as a stereoscopic object. This is the principle of the Titmus test to access stereopsis, mainly in children with strabismus.

The polarization phenomenon can also be used to create a disappearing reticule to be placed in the surgical microscope eyepiece. Let us assume that a surgeon would like to measure an ocular structure during an operation (i.e., pupil diameter), or the size of a corneal reflection (which can be converted into a measure of corneal power). A measuring reticule, in one of the eyepieces of the microscope, would be needed; however, the presence of the ruled reticule during the surgery might annoy the surgeon. How can the reticule be made to disappear and then reappear? Let the marks of the measuring reticule be made of a polarizing material. Let the reticule also be rotatable. Now place a polarizing filter over the microscope light. If the light reflected from the eye is polarized with the same orientation as the markings of the reticule, then the markings will be invisible. If the reticule is rotated 90° then it will be easily seen.

HAIDINGER BRUSHES

We humans also possess a polarization sensor in our eyes, although it is very primitive. The first description of this polarization effect was made by the German mineralogist Wilhelm Karl von Haidinger, in 1844. Haidinger brushes are entoptic phenomena seen best when a uniformly blue background (e.g., the sky) is visualized through a polarizing element. The brushes look like two yellow sheaths of wheat extending out 2° to 3° from the point of fixation and separated by bright blue quadrants. Understanding the source of the brushes has challenged some of the greatest minds in science and ophthalmology over the years (e.g., Helmholtz, Brewster, Stokes, Gullstrand).

The best explanation, so far, was presented by Ulf Hallden25 of Uppsala, Sweden, who was able to model the phenomenon with pieces of polaroid and cellophane. He believed that the initially polarized light travels through the nerve fiber layer of Henle in the macula, which functions as a yellow filter. The yellow filter effect is accomplished by the nerve fibers, which are double refracting (birefringent) and of a thickness that allows constructive interference for the two sets of waves of yellow and blue. Finally, the radial polarizer (analyzer) located in the photoreceptors absorbs the light wherever the radial elements are perpendicular to the vibration of the polarized light. Yellow light comes through, and light in adjacent quadrants is diminished.

The Haidinger brush phenomenon has been made into a clinical test for macular function. The test consists of a blue light with a rotating polaroid element covering the light. The yellow brushes are usually seen to be revolving if the macula is functioning at 20/100 (6/30) level or better. The brushes are even said to be seen in patients with dense amblyopia if the anatomy of the macula is intact.26

PHOTOELASTICITY

One of the most important practical applications of polarized light is in the field of photoelasticity. This is the study of the stresses and strains in transparent plastics. These stresses and strains produce unusual colored patterns when they are examined between crossed polaroid elements.

If a material with only one refractive index is placed between crossed polaroids, the field remains dark. If a doubly refracting material is placed between crossed polaroids, the initially polarized light is rotated by the material and gets through the analyzing polaroid. For example, glass annealed improperly, or glass case hardened for added strength, develops a crystalline structure and becomes doubly refracting. When such glass is placed between crossed polaroids, it exhibits the typical interference pattern of glass under strain. Before the advent of plastic eyeglass lenses or glass lenses that were chemically hardened, this test was the only way to determine whether a lens labeled “safety glass” was truly casehardened.

CORNEAL BIREFRINGENCE

Finally, it should be noted that both the cornea and the lens are birefringent. For example, illuminating the cornea with polarized light and analyzing the reflected light with a crossed polaroid produces a striking pattern composed of two black parabolas, which closely resemble a Maltese cross, surrounded by one or two orders of colored rings near the limbus. The pattern is apparently the result of the arrangement of the double-refracting collagen lamellae in the cornea and is typical of biaxial, birefringent crystals. The pattern is also dependent on local corneal thickness and is altered in keratoconus27 and collagen shrinkage produced by the Holmium laser. Elevation of intraocular pressure does not significantly alter the position of the collagen fibrils and thus does not alter the interference pattern.28 As yet, no evolutionary advantage has been ascribed to the birefringence of the cornea, nor has a clinical test been devised that exploits this unique characteristic.

Back to Top
EYE COLORS

IRIS

The color of the iris is a result of three variable factors in each patient: (1) the density of the posterior pigmented epithelial layer; (2) the density of the stromal pigment cells; and (3) the fiber size and arrangement of the stromal collagen.

In the blue eye, light incident on the iris is mostly backscattered by the stromal fibers. The larger radial fibers, which are wrapped in heavy bundles like shreds of white paper, backscatter white light, acting as small reflectors with no preference for any wavelength. The fine gossamer stromal collagen fibers, seen as cottony wisps between the radial bundles, backscatter light in the typical Rayleigh fashion (i.e., inversely proportional to the fourth power of the wavelength). Thus, they give a blue appearance. Incident light that manages to squeeze between the stromal fibers is absorbed by the melanin of the pigment epithelium and contributes a darker background to the stromal light scattering. Thus, the blue iris always looks bluer in the periphery, where the heavy whiter appearing fibers fan out and the fine fibers predominate, and appears lighter near the pupil, where the heavy radial fibers are concentrated.

Those irises that represent the spectrum from green to dark brown are characterized by heavier and heavier sprinklings of melanin pigment within the iris stroma. For example, a light dusting of melanin in the stroma will give a yellowish appearance. Thus, yellow plus the blue from the stromal light scattering yields a green appearance. As the melanin concentration gets heavier, more light becomes absorbed by the pigment, producing the dark brown color characteristic of melanin.

SCLERAL WHITENESS

The heavy, irregularly spaced, transparent collagenous bands that make up the sclera are surrounded by ground substance of a different refractive index. Such a combination produces marked light scattering. Because the collagen fibers are large in relation to the wavelength of light, they do not scatter in a Rayleigh fashion; they scatter all wavelengths alike, yielding a white appearance. In a patient with scleral thinning, the sclera will look blue. In such an instance, the remaining scleral fibers are finer and thus preferentially backscatter blue light. This effect is even more pronounced because the underlying heavily pigmented choroid provides a dark background.

FUNDUS

The fundus varies from a pinkish red in the lightly pigmented patient to a dusky red in the heavily pigmented patient. Light incident on the eye penetrates the transparent retina and is partially absorbed by the pigment granules in the retinal pigment epithelium. A combination of (1) some white light slipping between the pigment granules and (2) the yellow-to-red wavelengths, which can penetrate the melanin pigment, arrives in the choroid. Light striking the multiple layers of melanin pigment in the choroid tends to be absorbed, yielding a dark backdrop, similar to the pigment epithelium of the iris. The blue and green components of the light striking the blood of the choroidal vessels are absorbed, and the light that returns to the observer is primarily yellow-red, which is the distinctive characteristic of the pigment oxyhemoglobin. In lightly pigmented areas, some incident light may penetrate the choroidal structures and arrive at the sclera, which will backscatter the light much as a sheet of white paper would. Lightly pigmented fundi predominantly represent a combination of scleral backscatter and hemoglobin absorption and reflection, modulated by the pigmentation present. In the darker fundi, there is little scleral effect, and the color primarily depends on melanin and hemoglobin absorption and reflection.

The preferential absorption of specific wavelengths by various fundus layers has been exploited to improve, by contrast enhancement, the visualization of certain fundal components and pathologic lesions.29,30

For example, nerve fiber bundles are best visualized with light from 475 to 520 nm, depending on the fiber density and fundus pigmentation. These wavelengths are heavily absorbed by the retinal pigment epithelium and thus yield a dark background, whereas the nerve fibers themselves efficiently reflect the blue end of the spectrum. Therefore, the red-free filter of the ophthalmoscope, by eliminating the red end of the spectrum, brings out the nerve fibers around the disc more clearly against a dark background. Hoyt and co-workers31 photographed the fundus with red-free light and demonstrated areas of nerve bundle atrophy adjacent to healthy nerve bundles.

Retinal blood vessels are seen with the greatest contrast within the 550- to 580-nm spectral band. These wavelengths are maximally absorbed by the hemoglobin pigment and appear very dark against a light background when these filters are used in an ophthalmoscope or retinal camera. Such filters also improve the contrast of the pale physiologic cup against the pink optic nerve head.

Choroidal nevi are best seen in red light (about 650 nm), which can effectively penetrate the retinal pigment epithelium and choroid. Thus, monochromatic photography that uses black-and-white film and red light sometimes can provide higher contrast and better resolution than color photography.32

The existence of the yellow macular pigment has been known since the eighteenth century.33 It acts as a broad band blue filter, influencing color appearance, color matching, and color vision tests.34 This probably is achieved through compensation for the eye's chromatic aberration and a reduction of atmospherically scattered blue light. It also may serve as an ultraviolet filter. The composition of the yellow pigment seems to be a combination of carotinoids35 and is primarily located in the outer plexiform layer with some in the inner cone segment (Fig. 17).

Fig. 17. Histologic section through the macula illustrating the yellow pigment (taken with blue light to make yellow pigment look black). (Miller D [ed]: Clinical Light Damage to the Eye. New York, Springer-Verlag, 1987)

Back to Top
FLUORESCENCE
You may have noticed how a freshly laundered white shirt, if illuminated by ultraviolet or blue light, will glow in the dark. This glow, known as fluorescence, may last a short time after the exciting light is turned off. On a molecular or quantum level, the following probably happens. A quantum of blue or ultraviolet light (short wavelength, high energy level) is absorbed by the “fluorescing material.” The photon interacts with the outer electrons, raising the energy from a ground state to some excited level. As the energy level drops back to the ground state, a small amount is lost as vibrational-rotational energy. The major loss, however, results from the emission of a photon. This photon has a 10% to 20% longer wavelength. Thus, the fluorescent process can be seen as capturing nonvisible ultraviolet photons and turning them into less energetic visible light, or capturing blue light and converting it into the less energetic green or yellow light.

How is fluorescence related to the eye? The fluorescence of fluorescein dye is a good example (Fig. 18). Another interesting example is the natural fluorescence of the crystalline lens. If the lens is excited with a nonvisible ultraviolet wavelength (say, 300 or 350 nm), a faint blue fluorescence will be observed. This is thought to be primarily related to the accumulation of tyrosine and tryptophane residues, and is responsible for the filtering effect of ultraviolet light as one ages. The increased tryptophane and tyrosine levels are thought to be related to oxidation of lens biomolecules. This oxidation may be driven, in part, by cumulative light exposure.

Fig. 18. Photograph illustrating the fluorescence of fluorescein dye.

The lens also shows a second type of fluorescence, obvious to any examiner who has observed the human lens with blue slit-lamp illumination. The blue exciting light creates a yellow-green fluorescence. These fluorescing proteins are thought to be the result of lens metabolism.36

Figure 19 shows that this blue light-induced fluorescence increases with age.37 Thus, as a person ages, less blue light reaches his or her retina. This induced fluorescence appears in all parts of the lens. After age 50, the 442-nm induced fluorescence seems to decrease. In a sense, this is an artifact. The lens scatters more light. The shorter (blue) wavelengths, are scattered more than the longer ones. Thus, less blue light reaches the nucleus and posterior cortex, and less fluorescence is induced. This same study showed that diabetic lenses fluorescence more than age-controlled normal lenses. Finally, the study showed that the fluorescence increased with cataract severity.

Fig. 19. Plots for different parts of the lens showing an increase in fluorescence with increasing age. (Modified from Carlyl LR, Rand LI, Bursell SE: In vivo lens autofluorescence at different excitation wavelengths. Invest Ophthalmol Vis Sci 29(suppl):150, 1988

Recent studies have been able to correlate corneal and lens fluorescence with degree of diabetic retinopathy; this may be a powerful tool for the clinician in the early diagnosis of the condition. The basis for a clinical device is termed redox fluorometry. This term is derived from the fact that nicotinamide adenosine dinucleotide (NAD) and flavin adenosine dinucleotide (FAD) participate in the energy production chain in the cell receiving electrons and becoming reduced. The reduced substances exhibit a strong fluorescence at 450 and 500 nm, respectively. The cellular concentration of these substances is determined by the difference between the rate at which they are produced and the rate at which they are used in the stages of cellular respiration. There is less cellular activity when less glucose enters the cell due to lack of insulin (diabetes), and this results in a higher degree of fluorescence.

In a study of 94 insulin-dependent diabetes mellitus patients and 46 healthy controls, a positive correlation between corneal autofluorescence and minimal background retinopathy, background retinopathy, and (pre-) proliferative retinopathy was shown. Another study analyzed the populations of a geographically based survivor group of 161 mixed early- and late-onset diabetics (and 133 nondiabetic controls) and a second group of 104 early-onset insulin dependent diabetics (and 138 nondiabetic controls). Powerful associations (p < 10-6) were found between the presence of diabetes and increased lenticular autofluorescence in both populations.38

In the future, hand-held devices may be useful to technicians in screening patients with possible retinal disorders due to diabetes.

Back to Top
DENSITOMETRY OF SCHEIMPFLUG PHOTOGRAPHS OF THE LENS
As a cataract progresses, it scatters more light. As we have seen, the mechanism for this increased light scattering is the development of large protein aggregates in the lens. The size and concentration of these aggregates can be measured with the quasielastic light scattering analysis.39 Another objective method of following the progression of the cataract is to measure the total backscattered light. With the slit-lamp beam, the observer can easily see the increase in backscattered light as the cataract progresses. However, because of the limited depth of focus of the normal slit-lamp microscope, it is impossible to take a sharp and undistorted picture of the entire lens. If the Scheimpflug principle is used, sharp slit-lamp photographs of the entire lens is possible.40,41 Once such pictures are taken, a densitometric trace of the photo will accurately document the level of light scattering of the lens (Fig. 20).

Fig. 20. Scheimpflug slit lamp photograph and densitometry of a nuclear cataract.

The Scheimpflug principle states that the plane of an obliquely positioned object intersects the plane of the image.42 In the case of the crystalline lens, the slit-lamp beam slices through the lens in an oblique direction. The observer sees only the front or back of the lens in focus because the oblique section through the lens is wider than the depth of focus of the slit lamp. There is a plane in image space, however, that will be conjugate with the oblique object plane. This plane intersects the object plane. In Figure 21, the principle is used by tilting the slit-lamp objective and/or the film plane. Thus, a special Scheimpflug slit lamp camera will have the film plane not where the observer is, but off to the side, so that the extension of its plane will intersect the oblique plane through the lens, somewhere in space.

Fig. 21. Diagram illustrating the Scheimpflug principle with documentation of lens transparency during aging with (A) tilted film plane, (B) tilted microscope plane, and (C) the Scheimpflug Camera System. (Modified from Hockwin O et al: Photographic Ophthalmol Res 11:405, 1979)

Back to Top
THE DOPPLER SHIFT
The Doppler shift has been called a kind of cosmic speedometer. By measuring the Doppler shift of a telescopic image of a star, one can tell just how fast it is moving away from you. This is possible because the star is sending us light, as a wave phenomenon. The wave can be described in terms of wavelength or frequency. Frequency can be thought of in terms of the number of waveforms appearing in a set interval. Take the situation of a train receding with the whistle blowing. The whistle is sending out its characteristic sound (i.e., a waveform that has a certain frequency). Let us say the frequency is 10 cycles/second. When the train is very close to us, the sound wave does not have far to travel, and so all 10 cycles do appear in 1 second. As the train speeds away, its distance from us gets longer (Fig. 22). Thus, although the whistle blows at 10 cycles/second, by the time we hear the sound, it has taken more than 1 second for the first to the last cycle to reach us. In 1 second, we may register only 9 cycles. Therefore, the frequency is lower and consequently its wavelength (read this as pitch for sound) is longer (c = 1/f). This implies that we can calculate the speed of an object moving away from us by measuring the change in frequency or wavelength.

Fig. 22. Illustration of Doppler shift in frequency. As the source recedes, the frequency decreases. (Modified from Kippenhahn R: Light from the Depths of Time. New York, SpringerVerlag, 1986)

In 1929, the American astronomer Edwin Hubble noted that the galaxies were rushing apart and that the universe was expanding. Hubble had actually looked at the galactic spectra and noted that the light was shifting to the red. Using the Doppler effect, he calculated the speed of recession of the galaxies. This same principle can be used to measure the velocity of blood in the retinal circulation in a noninvasive way (Fig. 23). The laser Doppler velocimeter directs monochromatic light to a retinal blood vessel. The moving blood cells within the vessel backscatter the light. This light shows a shift in frequency that is proportional to the blood velocity. In the laser Doppler velocimeter, the backscattered light is made to interfere with the original light to best bring out the frequency shift.

Fig. 23. Illustration showing the principal of the laser Doppler test to measure the velocity of retinal blood flow. (Modified from Retina Associates of Boston)

The resulting interference produces an oscillating intensity of light, as registered by the photomultiplier. The original work was done on polystyrene spheres flowing through plastic tubes.43 The results showed that the fluid did not flow with just one velocity, but that a frequency shift profile occurred across the flowing fluid. Nevertheless, for a specific part of the flow profile, the frequency shift was proportional to the velocity of blood flow and the angle made by the analyzer with the direction of the tube.

After many years of debugging the apparatus, results in 1989 in living human patients showed that blood flow velocity in the retinal vessels could be obtained.44 The values for blood flow in retinal arterioles must be obtained during diastole, and the reading should be obtained in the center of the vessel. Usually, two readings along the vessels are recorded. Because the vessels are narrow, multiple scattering is not a problem, but the blood flow does vary with the diameter of the vessels. The method showed that the average retinal blood flow was 26 ± 4 g blood/min/100 g tissue, which agrees well with invasive measurements.

The Doppler effect has also been used to better understand field loss in normal-tension glaucoma. A study showed that compared with normal subjects, patients with chronic open-angle glaucoma had a statistically significant (p < 0.05) decrease in mean end-diastolic velocity and an increase in mean resistive index in all retinal vessels studied.45 The patients with normal-tension glaucoma showed similar changes. Thus, open-angle glaucoma is associated with a decreased mean flow velocity and an increased mean resistive index in the retinal vasculature.

Back to Top
REFERENCES

1. Dogigi J: The Magic of Rays. New York, Knopt, 1967

2. Safir A: Personal communication, 1977

3. Feuk T, McQueen D: The angular dependence of light scattering by rabbit cornea. Invest Ophthalmol 10:294, 1971

4. Miller D, Benedek G: Intraocular Light Scattering. Springfield, Charles C Thomas, 1973

5. Potts AM, Friedman BC: Studies on corneal transparency. Am J Ophthalmol 48:480, 1959

6. Balazs EA: Molecular morphology of the vitreous body. In Smelser GK (ed): The Structure of the Eye, p 306. New York, Academic Press, 1961

7. Ringrose NH: White sponges and surgical wound illumination. Med J Aust 2:893, 1976

8. Wolf E: Glare and age. Arch Ophthalmol 64:502, 1960

9. Zuckerman JL, Miller D, Dyes W et al: Degradation of vision through a simulated cataract. Invest Ophthalmol 12:213, 1973

10. Holladay LL: The fundamentals of glare and visibility. J Optical Soc Am 12:492, 1926

11. Wolf E, Gardiner JS: Studies on the scatter of light in the dioptric median of the eye as a basis for visual glare. Arch Ophthalmol 37:450, 1963

12. Miller D, Wolf E, Geer S et al: Glare sensitivity related to the use of contact lenses. Arch Ophthalmol 78:448, 1967

13. Miller D, Wolf E, Jernigan ME et al: Laboratory evaluation of a clinical glare tester. Arch Ophthalmol 87:324, 1972

14. Laclaire J, Nadler MP, Weiss S et al: A new glare tester for clinical testing. Arch Ophthalmol 100:153, 1982

15. Nadler D, Jaffe N, Clayman H et al: Glare disability in eyes with intraocular lenses. Am J Ophthalmol 97:43, 1984

16. Abrahmsson M, Sjostrand J: Impairment of contrast function as a measure of disability glare. Invest Ophthalmol Vis Sci 27:1131, 1986

17. Prager TC, Holladay JT, Ruiz RS: The other side of visual acuity testing: Contrast sensitivity. CLAO J 12:230, 1986

18. Holladay J, Bishop J, Lewis J: The optimal size of a posterior capsulotomy. Am Intraocular Implant Soc J 11:18, 1985

19. Green DG: Testing the vision of cataract patients by means of laser generated interference fringes. Science 168:1240, 1970

20. Green DG, Cohen MM: Laser interferometry in the evaluation of potential macular function in the presence of opacities in the ocular media. Trans Am Acad Ophthalmol Otolaryngol 75:629, 1971

21. Gstalder RJ, Green DG: Laser interferometry in corneal opacification. Arch Ophthalmol 87:269, 1972

22. Tetz MR, Klein U, Volcker HE: Measurement of potential visual acuity in 343 patients with cataracts: a prospective clinical study. Ger J Ophthalmol 1:403, 1992

23. Miller D, Johnson R: Quantification of the pinhole effect. Surv Ophthalmol 21:347, 1977

24. Hee MR, Izatt JA, Swanson EA et al: Optical coherence tomography of the human retina. Arch Ophthalmol 113: 325, 1995

25. Hallden U: An explanation of Haidinger brushes. Arch Ophthalmol 57:393, 1957

26. Sloan L, Naquin H: A quantitative test for determining the visibility of Haidinger brushes: Clinical application. Am J Ophthalmol 40:393, 1955

27. Miller D, Weinstein D: An investigation of corneal phenomena under crossed polaroids. Masters Thesis, Columbia University, New York, 1955

28. Maurice D: The cornea and sclera. In Davson H (ed): The Eye, Vol 1. New York, Academic Press, 1962

29. Behrendt T, Duane TD: Investigation of fundus oculi with spectral reflectance photography: depth and integrity of fundal structures. Arch Ophthalmol 75:375, 1966

30. Potts AM: Monochromatic ophthalmoscopy. Trans Am Ophthalmol Soc 63:276, 1965

31. Hoyt W, Frisen L, Newman NM: Funduscopy of nerve fiber layer defects in glaucoma. Invest Ophthalmol 12:814, 1973

32. Delori FS, Gragoudes ES: Examination of the ocular fundus with monochromatic light. Ann Ophthalmol 8:703, 1976

33. Polyak SL: The Retina. Chicago, University of Chicago Press, 1941

34. Ruddock KH: Light transmission through the ocular media and its significance for psychophysical investigation. In Jameson D, Hurvich LM (eds): Handbook of Sensory Physiology. Berlin, Springer-Verlag, 1970

35. Bone RA, Landru JT, Tarsis SL: Preliminary identification of the human macular pigment. Vis Res 25:1531, 1985

36. Yu N-T, Cai M-Z, Ho DJ-Y et al: Automated laser-scanning microbeam fluorescence/Raman image analysis of human lens with multichannel detection: evidence for metabolic production of green fluorophor. Proc Natl Acad Sci USA 85:103, 1988

37. Carlyl LR, Rand LI, Bursell SE: In vivo lens autofluorescence at different excitation wavelengths. Invest Ophthalmol Vis Sci 29(suppl):150, 1988

38. Sparrow JM, Bron AJ, Brown NA et al: Autofluorescence of the crystalline lens in early and late onset diabetes. Br J Ophthalmol 76:25, 1992

39. Benedek GB: Optical mixing spectroscopy with applications to problems in physics, chemistry, biology and engineering. In Jubilee Volume in Honor of A Kastler: Polarization, Matter and Radiation. Paris, Press Universitaire de France, 1969

40. Drews C: Depth of field in slit lamp photography: an optical solution using the Scheimpflug principle. Ophthalmologica 148:143, 1964

41. Brown N: Slit-image photography. Trans Ophthalmol Soc UK 89:397, 1969

42. Scheimpflug T: Des photoperspakfFograph undspine Anwendung. Photogr 43:516, 1906

43. Riva C, Ross B, Benedek GD: Laser Doppler measurements of blood flow in capillary tubes and retinal arteries. Invest Ophthalmol Vis Sci 13:936, 1972

44. Feke GI, Tagawa H, Deupree DM et al: Blood flow in the normal human retina. Invest Ophthalmol Vis Sci 3:58, 1989

45. Rankin SJ, Walman BE, Buckley AR et al: Color Doppler imaging and spectral analysis of the optic nerve vasculature in glaucoma. Am J Ophthalmol 119:685, 1995

Back to Top