THE FAR-POINT SPHERE A patient's refractive error is corrected when the image of a distant
object formed by the correcting lens falls at the patient's far
point. When the patient rotates his or her eyes to use various portions
of the lens, the far point also moves, tracing out a surface known
as the far-point sphere. The goal of the lens design process is to cause images of off-axis objects
to fall on the far-point sphere. To accomplish this goal, off-axis
lens aberrations must be reduced to minimum levels. LENS ABERRATIONS (FIELD-OF-VIEW ERRORS) Of the seven commonly described lens aberrations,11 four—radial or oblique astigmatism, curvature of field (power error), distortion, and
transverse chromatic aberration (lateral color)—significantly
degrade vision through off-center areas of a spectacle
lens. These aberrations decrease the useful field of view through
a lens and may be termed field-of-view errors. The magnification effects of lenses and the difference between the magnifications
of the two lenses are also factors in the design.The goal
of the lens design process can be restated as an attempt to maximize
the useful field of view through a lens. The other three aberrations—spherical
aberration, coma, and longitudinal chromatic aberration—have
little effect on vision through spectacle lenses, although
they can be of importance in the design of other types of lenses. When a patient turns his or her eye to look at a point object that is not
along the optic axis of a spectacle lens, the image of the point formed
by the lens may no longer be a point. Instead, the point may be imaged
as two lines (line foci) perpendicular to each other, with one line
closer than the other to the lens (Fig. 3). This aberration of the image is radial or oblique astigmatism. The effects
of radial astigmatism on image formation are similar to that of
astigmatism in general. If one of the line images falls on the far-point
sphere, the patient sees the image of the point as a line. If the
two foci straddle the far-point sphere, no sharp image is formed. Instead, the
image appears round and blurry (a blur circle). At other positions
of the line images relative to the far-point sphere, the image formed
is blurry and elliptical in shape. The separation of the two line
foci formed by radial astigmatism is termed Sturm's interval, and the out-of-focus circular image formed between the two line foci
is known as the circle of least confusion.12 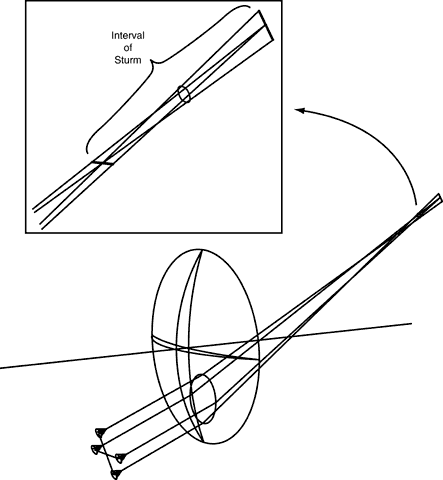 Fig. 3. Radial astigmatism formed from a bundle of light rays entering a spectacle
lens at an off-axis point. The bundle entering the lens is limited
in size because the rays must pass through the pupil of the eye. The
magnified view in the inset shows the Sturm's interval, with its
two astigmatic line foci, one closer to the lens than the other, and the
circle of least confusion. Fig. 3. Radial astigmatism formed from a bundle of light rays entering a spectacle
lens at an off-axis point. The bundle entering the lens is limited
in size because the rays must pass through the pupil of the eye. The
magnified view in the inset shows the Sturm's interval, with its
two astigmatic line foci, one closer to the lens than the other, and the
circle of least confusion.
|
If an extended (large) object is viewed off-axis through a lens that has
radial astigmatism, then each point on the object is imaged as two line
foci at different distances from the lens. In the example in Figure 4, the vertical arms of the cross-object are imaged as a large number of
short horizontal lines at the focus closer to the lens. The horizontal
arms of the cross are also imaged as a large number of short horizontal
lines, but the line images overlap along the length of the arms. If
this image were to be formed at the far-point sphere of a patient's
eye, the patient would see the horizontal arms of the cross in sharp
focus, but the vertical arms would appear blurry. At the focus farther
from the lens, the situation is reversed, with the vertical cross-arm
in sharp focus and the horizontal arm out of focus. At the circle
of least confusion, all points on the cross are imaged as out-of-focus
circles, and both arms of the cross appear equally blurry. The appearance
of the image differs at different distances from the lens. 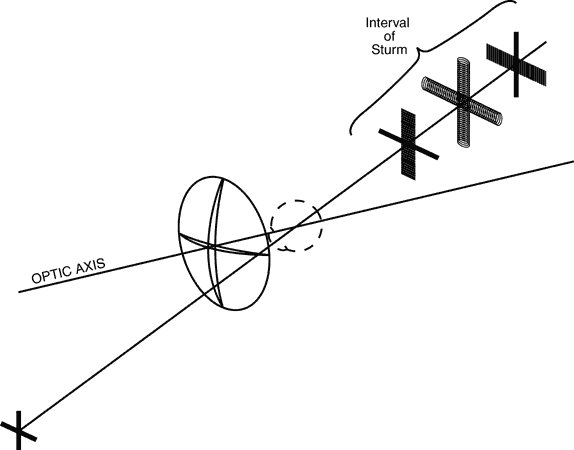 Fig. 4. When an extended object is imaged through a lens with radial astigmatism, the
appearance of the image is different at different positions along
Sturm's interval. Fig. 4. When an extended object is imaged through a lens with radial astigmatism, the
appearance of the image is different at different positions along
Sturm's interval.
|
A standard terminology describes the foci created by radial astigmatism. Suppose
a patient were to look laterally away from the center of a lens
at a cross target. If the patient's field of view is considered
to be a circle on a vertical plane, with the cross pattern at the lateral
edge of this circle, then the vertical arms of the cross are tangent
to this circle. The focus of the vertical arms by the lens is termed
the tangential focus, and errors in their focus position relative to the far point sphere are tangential errors. Errors in focus that affect the cross arms perpendicular to the tangential
detail (i.e., the horizontal cross-arms) are termed sagittal errors, and the focus of these lines is called the sagittal focus. If the patient were to look upward at a cross at the top of the field
of view, the horizontal cross-arms would be tangential to the field-of-view
circle, the focus of the horizontal cross-arms would be the tangential
focus, and the vertical cross-arms would be imaged to form the
sagittal focus. Tangential and sagittal focus errors increase as the
distance from the center of a lens increases. The two foci formed by a lens with radial astigmatism may be in front of
the far-point sphere or behind the far-point sphere, or they may straddle
the far-point sphere. The average dioptric value of the two focus
positions specified relative to the zero value of the far-point sphere
is termed power error. Power error increases as the distance from the optic axis of a lens increases, and
the image surface for an extended object is curved, resulting
in curvature of field (Fig. 5). Generally, power error and radial astigmatism cannot be eliminated at
the same time.13 When radial astigmatism is eliminated, there will be some residual power
error, and when power error is eliminated, some radial astigmatism
will still be present (Fig. 6). Rather than attempt to correct power error directly, lens designers
may try to minimize individual sagittal or tangential focus errors. A
sagittal or tangential focus position behind the far-point sphere (negative
error) probably has less effect on visual acuity than a focus position
in front of the far-point sphere (positive error) because a patient
can accommodate and pull the negative focus forward onto the retina. Therefore, perfect
balancing of the sagittal and tangential errors, one
in front of and one behind the far-point sphere, may not provide
optimal off-axis image quality. Correction of a positive error with larger
tolerances for negative errors may be the best strategy. 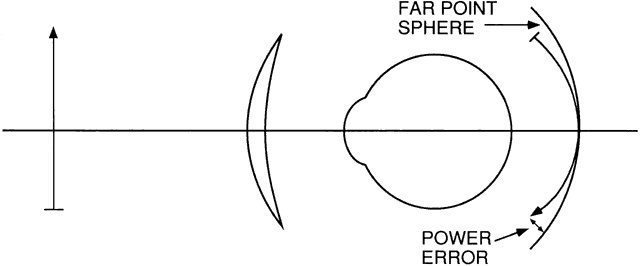 Fig. 5. When radial astigmatism is corrected, the image of a flat object is curved. The
curvature of this image surface is known as curvature of field. The
dioptric difference between the image position and the far-point
sphere at a given off-axis location is power error. Fig. 5. When radial astigmatism is corrected, the image of a flat object is curved. The
curvature of this image surface is known as curvature of field. The
dioptric difference between the image position and the far-point
sphere at a given off-axis location is power error.
|
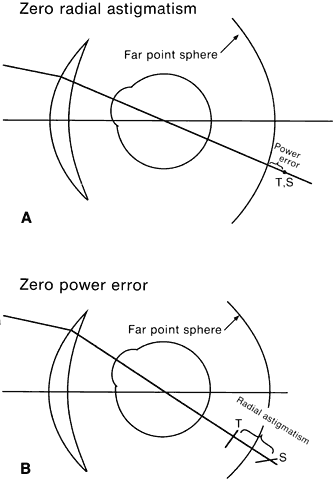 Fig. 6. A. When radial astigmatism is corrected, the two focal lines coincide to
form a point image of a point object, but the image point is not on the
far-point sphere, creating a power error. B. When the tangential and sagittal foci are equidistant from the far-point
sphere, there is no power error, but radial astigmatism is present. (Modified from Atchison DA: The clinical importance of spectacle lens base
curves. Clin Exp Optom 69:31, 1986.) Fig. 6. A. When radial astigmatism is corrected, the two focal lines coincide to
form a point image of a point object, but the image point is not on the
far-point sphere, creating a power error. B. When the tangential and sagittal foci are equidistant from the far-point
sphere, there is no power error, but radial astigmatism is present. (Modified from Atchison DA: The clinical importance of spectacle lens base
curves. Clin Exp Optom 69:31, 1986.)
|
Which aberration, radial astigmatism or power error, is more important
to correct? This question has been the source of considerable discussion
and argument in the optical industry for years,14 and the discussion continues. Most current lens designs compromise, attempting
to minimize both aberrations without completely correcting either. This
topic is discussed more fully in the section on the evolution
of lens design. Transverse chromatic aberration, or lateral color, is caused by dispersion, the
variation of refractive index with wavelength that occurs for
all spectacle lens materials (Fig. 7A). When a patient looks laterally to view a point object through a lens, the
different wavelengths of light from the object each are refracted
differently, “smearing” the image into its component colors (see Fig. 7B). If the object is not a point, but instead a large object such as a cross, the
effects of dispersion are not the same. Each wavelength of light
from the vertical arms of the cross is refracted differently, resulting
in color fringes that surround the image of the vertical arms. However, the
image of the horizontal cross-arms is relatively unaffected
because the dispersion of the light into its component colors occurs
along the arms of the cross and is not noticeable except at the cross-ends. Therefore, it
can be argued that the effects of transverse chromatic
aberration may be more important for the tangential focus than
for the sagittal focus. The effect of transverse chromatic aberration
is analogous to the dispersive effects visible when looking through a
prism. 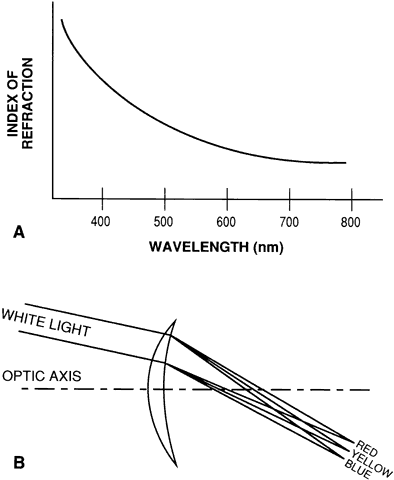 Fig. 7. A. Dispersion is the variation of index of refraction with wavelength. Dispersion
occurs for all lens materials and is responsible for chromatic
aberration. B. When white light passes through the periphery of a lens, the various wavelengths
are refracted by different amounts, creating transverse chromatic
aberration. Fig. 7. A. Dispersion is the variation of index of refraction with wavelength. Dispersion
occurs for all lens materials and is responsible for chromatic
aberration. B. When white light passes through the periphery of a lens, the various wavelengths
are refracted by different amounts, creating transverse chromatic
aberration.
|
The prismatic effects of a lens vary with the lens power and with the distance
from the lens optical center that a light ray passes through the
lens. The relationship is termed Prentice's rule15:
P = h × D
(1) where P is the prism obtained in prism diopters, h is the distance from
the lens optical center measured in centimeters, and D is the lens power
in diopters. Prismatic effects are larger for higher-power lenses
and larger angles of view, so transverse chromatic aberration, which is
related to the prismatic effects of a lens, will be worse for these
same conditions. High-index glass and high-index plastic lens materials
have more dispersion than crown glass or CR-39 plastic, and the problems
of transverse chromatic aberration are more important for lenses
made of these materials. Clinically, patients report color fringes around
objects only when looking away from the center of these high-power, high-index
lenses, but it is unusual for patients to report color fringes
when their lens powers are less than approximately 5.00 D. The lens
designer cannot vary the dispersion of a given material, so in a sense, nothing
can be done about transverse chromatic aberration. However, proper
lens design to minimize or eliminate other aberrations and
proper fitting techniques in the optical dispensary can minimize the total
off-axis blur and improve visual acuity. Distortion is a lens aberration caused by the variation in magnification
from the center to the edge of a lens (Fig. 8). It has little effect on resolution of an image, but it does affect the
shape of the image. When an extended object is imaged by a high-minus
power lens that has decreasing magnification toward the lens periphery, the
images of portions of the object farther from the lens center
are magnified less than those closer to the center, resulting in a “barrel” distortion of the image. A plus-power spectacle lens, which
has increasing magnification to the periphery, exhibits “pincushion” distortion. The effects of distortion are most noticeable
in high-plus power (aphakic) spectacle lenses. Patients who wear
these lenses often report that door frames and other rectangular or
square objects appear bent when viewed off axis. In addition, the combination
of magnification and distortion in thick plus-power lenses results
in a swimming sensation as the patient turns his or her head. This
can be dramatically reduced by using the flatter aspheric designs. 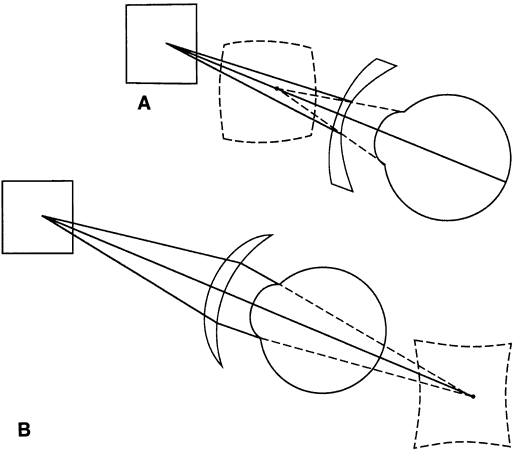 Fig. 8. Distortion affects the shape of an image. A. Barrel distortion. B. Pincushion distortion. Fig. 8. Distortion affects the shape of an image. A. Barrel distortion. B. Pincushion distortion.
|
A SIMPLE DEMONSTRATION If one takes a large handheld magnifying glass and looks at a magazine
with some vertical and horizontal lines or at a piece of graph paper, the
effects of lens aberrations can be observed. With the glass held squarely
with the paper and perpendicular to the line of sight, the field
of view has good optical quality to the edge of the lens. If the lens
is tipped away at the top and the lines are viewed through the top
of the lens, horizontal lines become blurred, colored and curved, whereas
vertical lines are in better focus, straight, and uncolored. If the
lens is tipped sideways, similar effects occur. The blur is tangential
error, the color is transverse chromatic aberration, and the curve
is distortion. The difference in blur between the horizontal and vertical
lines is off-axis or radial astigmatism. THE NEED FOR COMPROMISE At its simplest level, the design process for a spectacle lens involves
the calculation of the sagittal and tangential errors of each principal
meridian for different sets of front and back lens curves. This calculation
is done to determine which combination provides the best off-axis
optical quality. As the surface curves are altered, different combinations
of aberrations occur. Some errors will always be present. Even
with the use of aspheric surfaces, the same problem exists. Thus, the lens design process is one of compromise, in which an optimal
choice is made from the available options. What constitutes the optimal
choice has been the topic of controversy both in the professional literature
and in advertising for more than 60 years. One reason that controversy
still exists is that patients seldom have a chance to compare
two different designs. Another reason is that instrumentation for measuring
off-axis aberrations is uncommon. Finally, factual information
regarding the various lens designs is scant. Much more information could
be supplied by manufacturers, but “complete” information
would be difficult to handle. Several hundred tables of data would
be needed to describe the performance of the different types and designs
of currently available lenses. However, we attempt to explain the
differences between lens products, and their significance. THE GEOMETRIC BASIS OF LENS DESIGN Figure 9 shows the idealized geometric relationship of a spectacle lens to the
eye. In the figure, the optic axis of the lens is shown as an imaginary
line that connects the centers of curvature of both lens surfaces and
passes through the lens optical center. When designing a lens, it is
assumed that the optic axis passes through the eye's center of rotation. In
spectacle lens design, the center of rotation is termed the optical stop of the system because its position determines which rays reach the fovea
in off-axis gaze. The stop distance, or center of rotation distance, is
the distance from the back surface of the lens to the center of rotation. Traditionally, this value has been assumed to be a constant, often 27 mm,14 but there is significant variation in this distance in the population. Lens
designers calculated the optimal base curve for a lens based on
this value. The center of rotation distance is the sum of the vertex distance
and the sighting center distance, the distance from the corneal
apex to the center of rotation.  Fig. 9. Schematic drawing of a lens in a frame. OC is the optical center, and OA
is the optic axis, which should pass through the center of rotation (CR) of
the eye. Ray bundles are traced to the far-point sphere (FPS) for
calculation of lens aberrations. Errors are referred to the reference
sphere (RS). Stop distance, or center of rotation distance, is the
sum of the sighting center distance (SCD) and the vertex distance (V). Fig. 9. Schematic drawing of a lens in a frame. OC is the optical center, and OA
is the optic axis, which should pass through the center of rotation (CR) of
the eye. Ray bundles are traced to the far-point sphere (FPS) for
calculation of lens aberrations. Errors are referred to the reference
sphere (RS). Stop distance, or center of rotation distance, is the
sum of the sighting center distance (SCD) and the vertex distance (V).
|
Let us assume that the lens is fitted at the same vertex distance as was
used in the refractive examination or that the prescription has been
compensated for any difference between the two. The image of a distant
object then falls at the far point. As the eye rotates to look off axis, the
far point also rotates, tracing out the far-point sphere. Note
that the ray bundles pass through the center of rotation of the eye. By
convention, the dioptric position of the focus of light from an off-axis
object is calculated relative to the reference sphere, the sphere
tangent to the back surface of the lens at the optical center and centered
on the center of rotation of the eye. Errors in image formation
are then expressed as dioptric differences from the desired focus position
on the far-point sphere. Until recently, throughout the history of spectacle lens design, the basic
input that linked the patient to the lens was the center of rotation
distance. This optical stop of the lens-eye system is where all the
lines of sight to the various points in the field of view cross. Typical Fitting Geometry Figure 10 illustrates the positioning of a frame and lens on the face. Most lenses
are worn tipped slightly toward the eye through an angle of approximately 10 degrees. This
is the pantoscopic angle. Also, most frames, especially
plastic frames, fit the nose such that the center of the lens
is a few millimeters below the pupil when the patient is looking straight
ahead. Fortunately, the combination of downward tip and lowered
fitting position tends to keep the center of rotation of the eye close
to the optic axis of the lens (within 3 mm), and the lens vertex is automatically
approximately on the reference sphere. In short, Figure 10 is Figure 9 tipped downward, with some flexibility added. 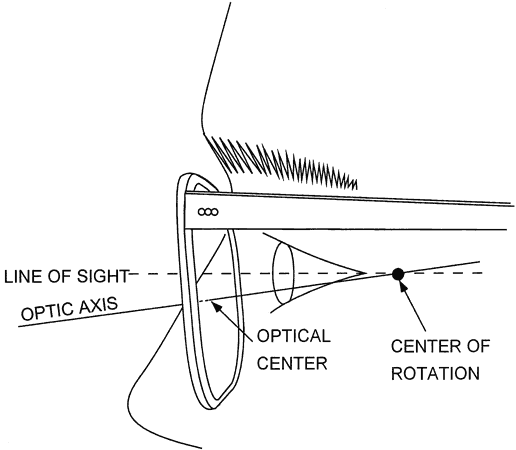 Fig. 10. A typical spectacle-fitting situation. Most glasses are worn with the bottom
of the frame tilted toward the face (pantoscopic tilt). The optical
center of the lens should be below the straight-ahead line of sight
so that the optic axis of the lens passes through the center of rotation
of the eye. (Modified from Davis JK: Prescribing for visibility. Probl Optom 2:131, 1990.) Fig. 10. A typical spectacle-fitting situation. Most glasses are worn with the bottom
of the frame tilted toward the face (pantoscopic tilt). The optical
center of the lens should be below the straight-ahead line of sight
so that the optic axis of the lens passes through the center of rotation
of the eye. (Modified from Davis JK: Prescribing for visibility. Probl Optom 2:131, 1990.)
|
The fit of a frame can be evaluated by drawing an imaginary line perpendicular
to the eyewire at its vertical center and projecting backward
into the eyeball, as shown by the line in Figure 10. The edge of a ruler placed against the frame and cheek area aids in visualization
of the line. This line indicates the location of the optic
axis of the lens. It should seem to pass approximately through the center
of rotation. This point is behind the canthus, as shown in the figure. Because the greatest use of lenses is for straight-ahead and downward viewing, the
normal cosmetically attractive pantoscopic angle is also functionally
desirable. For most prescriptions, departures from the ideal
alignment shown in Figure 10 do not create serious errors. However, in fitting aphakic lenses and strong
hyperopic or myopic corrections, the dispenser must take care to
obtain a proper relationship between pantoscopic angle and the vertical
height of the lens center so that the optic axis will pass close to
the center of rotation. As a general rule, the optical center should
be positioned 1 mm below the pupil center for every 2 degrees of pantoscopic
tilt (3 to 5 mm below the pupil for the normal 6 to 10 degrees
of pantoscopic tilt) when the patient's line of sight is parallel
to the temples. This positioning is also important for high-index and
aspheric lenses. Vertical variations in eye position could be a consideration in the lens
design process, but to date, this has not been the case. For illustrative
purposes, the effect of vertical misalignment on selected lens designs
is sometimes calculated and published.16,17 The longitudinal or axial relationships of the lens, cornea, and center
of rotation are less easily adjusted and have been the principal input
variables that have governed lens design decisions. Viewing Angle Most lens series have been designed to minimize field of view errors for
angles of 30 degrees from the optic axis on each side of the optical
center.14 Some have used 40 degrees for weak prescriptions. These values have been
criticized as being too large because most patients do not make eye
movements 30 to 40 degrees away from the optic axis. However, although
most patients may not turn their eyes 30 degrees from the normal straight-ahead
position, the straight-ahead position, or zero point, on a
lens may not be at the optical center. Because of posture habits, it
is usually above the optical center and may be to either side of the center
of the lens. The combination of this noncentral starting point with
minor eye excursions in all directions can bring the angle of view
to a large value. Davis18 reanalyzed the viewing-angle problem as shown in Figure 11 when designing a polycarbonate lens series. He suggested that the straight-ahead
position for a typical spectacle wearer is approximately 5 mm
above the distance optical center. Around this zero point, a patient
can scan a fairly small field of view without head movements. Other
patients could have different zero positions that surround this first
zero point, creating a set of zero positions (the circle of dots surrounding
the center dot in Figure 11). Davis then assumed that for each of these zero positions, the wearer
would scan an elliptical field 20 degrees vertically by 30 degrees horizontally
without head movement. This pattern creates a family of ellipses
within which field-of-view errors should be corrected. 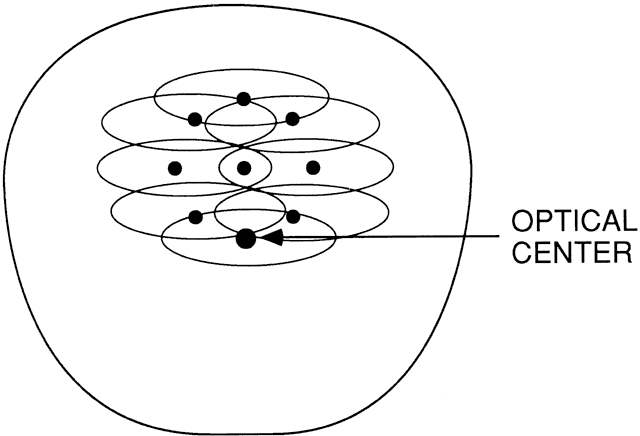 Fig. 11. Spectacle lens scanning ellipses centered at different zero positions for
different wearers. The outer edge of this family of ellipses subtends
an angle of about 28 degrees with the optic axis. (Modified from Davis JK: Prescribing for visibility. Probl Optom 2:131, 1990.) Fig. 11. Spectacle lens scanning ellipses centered at different zero positions for
different wearers. The outer edge of this family of ellipses subtends
an angle of about 28 degrees with the optic axis. (Modified from Davis JK: Prescribing for visibility. Probl Optom 2:131, 1990.)
|
The nasal and temporal edges of the family of ellipses are 25 to 30 degrees
from the optical center. Davis chose an angle of 28 degrees for designing
his lenses. Note that eye movements (scans) of only 15 degrees
laterally require correction of field-of-view errors at much larger
angles of view. However, a 28-degree angle of view describes a circle
on a lens of only 28 mm in diameter. NUMERICAL EXAMPLES OF LENS ERRORS Given the aforementioned information on the geometry of a spectacle lens
on a patient's face, the sagittal and tangential focus error values
can be calculated for any lens using exact surface-to-surface ray-tracing
procedures.14,19 Table 1 shows the results of these calculations for a crown glass lens of power -3.00 D
positioned at different center of rotation distances and ground
with a variety of front (base) curves. The back (ocular) curve for
each base curve was chosen to provide the proper lens power of -3.00 D
for the center thickness of 2 mm and index of refraction of 1.523. TABLE 1. Field-of-View Errors at 30 Degrees for 3.00 Sphere Prescription*
| | CR Distance, 24 mm | CR Distance, 27 mm | CR Distance, 30 mm | CR Distance, 33 mm |
| Front Curves | Vertex Distance, 10 mm | Vertex Distance, 13 mm | Vertex Distance, 16 mm | Vertex Distance, 19 mm |
| Rear Curves | T | S | A | T | S | A | T | S | A | T | S | A |
| + 7.00 | 0.10 | 0.11 | 0.01 | 0.18 | 0.14 | 0.04 | 0.24 | 0.16 | 0.08 | 0.30 | 0.17 | 0.12 |
| 10.00 | | | | | | | | | | | | |
| + 6.00 | 0.02 | 0.09 | 0.07 | 0.11 | 0.12 | 0.01 | 0.18 | 0.14 | 0.04 | 0.24 | 0.16 | 0.09 |
| 9.00 | | | | | | | | | | | | |
| + 5.00 | 0.07 | 0.06 | 0.13 | 0.02 | 0.09 | 0.07 | 0.10 | 0.11 | 0.01 | 0.17 | 0.13 | 0.03 |
| 8.00 | | | | | | | | | | | | |
| + 4.00 | 0.18 | 0.03 | 0.21 | 0.09 | 0.06 | 0.15 | 0.01 | 0.08 | 0.09 | 0.06 | 0.10 | 0.04 |
| 7.00 | | | | | | | | | | | | |
| + 3.00 | 0.32 | 0.01 | 0.31 | 0.23 | 0.01 | 0.24 | 0.15 | 0.04 | 0.19 | 0.08 | 0.06 | 0.14 |
| 6.00 | | | | | | | | | | | | |
| + 2.00 | 0.48 | 0.06 | 0.42 | 0.40 | 0.04 | 0.36 | 0.32 | 0.01 | 0.31 | 0.25 | 0.00 | 0.25 |
| 5.00 | | | | | | | | | | | | |
T, tangential; S, sagittal; A, astigmatic. CR, center of rotation.
*Object at ∞ (20 ft or more) distance. Vertex distances are approximate
only.
Suppose that a patient is wearing this -3.00-D lens at a center of rotation
distance of 27 mm, with a base curve of + 3.00 D. As the patient
looks upward at an angle of view of 30 degrees with respect to the
optic axis, the tangential error will be -0.23 D. The sagittal error
is + 0.01 D, essentially zero. The astigmatic error, the difference
of the two foci, is -0.24 D. Looking through the lens in this position (approximately 16 mm
above the center of the lens), the patient will
have a prescription not of -3.00 D, but of -2.99 -0.24 × 180 (or -3.23 + 0.24 × 090). For sideways viewing at the same
distance off center, the axis of the cylinder shifts by 90 degrees. The power error for this example, the average of the sagittal and tangential
foci, is -0.115 D. One focus is just (0.01 D) in front of the far-point
sphere, whereas the other is almost 0.25 D behind. Therefore, the
patient is slightly overcorrected or overminused when looking off
axis. If the patient accommodates slightly, the foci could be pulled forward
to bracket the far-point sphere and eliminate the power error. If a + 6.00-D base curve is used on the lens front surface, the astigmatism
changes to -0.01 D, essentially zero, but the power error all
around the lens 30 degrees (16 mm) from the center becomes + 0.115 D (approximately 1/8 D). The values in these two examples do not seem
large, but in terms of the precision of refraction and fabrication
of lenses, they are significant. An additional complexity to the lens design process is that most lenses
are spherocylinders. Each principal meridian has its own set of sagittal
and tangential errors to be corrected. The design of spherocylinder
lenses is discussed in detail subsequently. EVOLUTION OF LENS DESIGN Davis14 and Atchison20 have reviewed in detail the historic development of spectacle lens designs. Much
of the information presented in this section is based on their
work. Corrected curve or best-form lenses, lenses designed specifically to eliminate
off-axis aberrations, date back to Wollaston in 1804. However, modern
commercial lens design began in the United States in 1911 when
von Rohr, of Zeiss, patented the Punktal lens. This was a “point-focal” lens
design in which the design goal was to completely
correct radial astigmatism for oblique directions of view. From the data
in Table 1, assuming a 27-mm center of rotation distance, von Rohr would have chosen
a base curve of nearly + 6.00 D for this -3.00-D lens. A problem
with von Rohr's design was that every lens power required a different
base curve to maintain the point-focal correction exactly, making
lens production difficult and expensive. In 1917, Tillyer, a physicist at American Optical Company, filed for a
patent on a different lens design concept that allowed tolerances on both
radial astigmatism and power error. In designing his lenses, Tillyer
believed that he should be guided by the ordering and stock procedures
used in the lens market. He realized that when a patient receives
a prescription for weak powers, at best, it is given in steps of 0.12 D. For
stronger powers, the steps may be 0.25 D for both the spherical
and cylindrical components. He believed that if a patient's actual
prescription tolerances were not closer than 0.25 D, then correcting
oblique astigmatism to a few hundredths of a diopter was unnecessary. He
therefore allowed a maximum tolerance on radial astigmatism that
was equal to the customary steps in prescription accuracy (0.12 D) used
at that time. Tillyer's procedures allowed some flexibility in base curve selection
so that power error could also be corrected. By applying his theory, a
practical single-vision lens series was designed, using selected
base curves that corrected both astigmatism and power errors to within
tolerances more precise than the steps between prescriptions. Referring to Table 1 again for the -3.00-D lens at a center of rotation distance of 27 mm, a
base curve of + 5.00 D meets Tillyer's criterion. Certainly
it cannot be argued that 0.07 D of cylinder would do much harm. In addition, the
average power error of 0.055 D (the average of the T and
S errors) is only one half the value for a + 6.00-D base curve, although
the + 6.00-D base curve provides a better astigmatic correction. The + 6.00-D
design is acceptable, and the + 4.00-D
design is almost within tolerances (0.15 D of astigmatism is slightly
too much). Any base curve within this range provides adequate correction. This
example illustrates the compromises involved in the lens design
process. Another way to state Tillyer's concept is that a range of lens powers
can be used with the same base curve and still correct lens aberrations
within tolerances. This feature is illustrated in Table 2. Here, the base curve is maintained at + 5.00 D while the spherical
lens power is changed from plano to -5.00 D. The astigmatic and power
errors remain below 0.12 D for powers from plano to -3.00 D, so the
same base curve could be used for any spherical lens power within this
range. This flexibility allows a lens manufacturer to provide the optical
laboratory with semifinished blanks using a limited number of base
curves. The laboratory can vary the prescription within predetermined
limits for each base curve. TABLE 2. Field-of-View Errors for Spherical Prescriptions With + 5.00 Front
Curve*
| | | Power of Spherical Lens |
| Distances | Error | 0.00 | -1.00 | -2.00 | -3.00 | -4.00 | -5.00 |
| CR distance, 27 mm | T | 0.03 | 0.06 | 0.04 | 0.02 | 0.12 | 0.24 |
| Vertex distance, 13 mm | S | 0.01 | 0.01 | 0.04 | 0.09 | 0.14 | 0.20 |
| | A | 0.02 | 0.07 | 0.08 | 0.07 | 0.02 | 0.04 |
T, tangential; S, sagittal; A, astigmatic. CR, center of rotation.
*Object at ∞ (20 ft or more) distance. Vertex distance is approximate
only.
The concept of using a single base curve for a limited range of lens powers
and of using a series of base curves to cover the entire prescription
range is in almost universal use currently. This system reduces lens
inventory and eliminates the need for a different base curve for every
possible prescription. Sets of semifinished blanks, with front curves
varying in steps, are stocked in local optical laboratories, and
charts or computer programs show laboratory personnel which blank should
be used for each prescription. Manufacturers also supply finished uncut
lenses using a similar stepped base curve system. The uncut and semifinished
blanks should be compatible. In 1927, Rayton of Bausch and Lomb introduced the point-focal lens concept
to the U.S. lens market, with a modification that allowed a stepped
base curve system to be used. This lens series eventually became the
well-known Orthogon lens series. At one time, most commercial lens series
were designed after either the Orthogon or the Tillyer concept. The
debate continues as to which system is better. For many prescriptions, the
performances of the two series are similar. If power error is
corrected with a tolerance for radial astigmatism, or if radial astigmatism
is corrected with a tolerance for power error, the base curve choices
could be the same. Patient response is seldom correlated with choice
of lens design, probably because the patient has no opportunity to
make a comparison. SIGNIFICANCE OF FITTING DISTANCE A clue to the lack of correlation of patient response with lens theory
is shown in Table 1. Lens performance varies with center of rotation distance or vertex distance. For
this -3.00-D lens, the changes in radial astigmatism and power
error that occur as vertex distance is changed (moving horizontally
along the graph) are similar in magnitude to those that occur with
a change of base curve. A change of 3 mm in vertex distance results in
approximately the same changes that are found with a 1.00-D change in
base curve. It can be argued that the size of a patient's nose has
as much to do with his or her vision as does the selection of lenses
of one design or another. Table 1 shows that a Tillyer design at 27 mm (+ 5.00-D front curve) corrects
astigmatism and becomes a von Rohr type at 30 mm. A von Rohr design
at 27 mm (+ 6.00-D front curve) performs like a Tillyer design
at 24 mm. Also, a + 5.00-D front curve at 30 mm behaves like a + 7.00-D
front curve at 24 mm. THE MASTERPIECE SERIES Spectacles may be worn at center-of-rotation distances as small as 24 mm
and as long as 33 mm. Davis and associates took this variability into
account in the design of the American Optical Tillyer Masterpiece lens
series in the early 1960s.21–24 Base curves chosen were those that performed well for a large range of
center of rotation distances, from 27 to 33 mm. The original Tillyer
design principle was modified to give priority to tangential errors because
it was believed that tangential image detail was deteriorated not
only by focus errors but also by transverse chromatic aberration from
the prismatic effects of off-axis viewing. From Table 1, the tangential error is nearly zero for a base curve of + 4.00 D (+ 3.75 D
was the curve selected). Lens performance also was maintained
for both distance and near viewing, with power error correction
emphasized at distance and radial astigmatism correction emphasized
for near viewing. The base curves of these lenses tended to be flatter
than those of the original Tillyer lens series. The Masterpiece lens series was modified as the Masterpiece II series in 1971 to
include correction for very short center-of-rotation distances. The
tolerances for radial astigmatism and sagittal and tangential
errors were modified to favor the correction of plus error and astigmatism
at the expense of minus-power errors. The front curve selected for
a -3.00-D lens was + 4.25 D. Table 1 shows that reasonable performance is maintained at all fitting distances. Base
curves for the Masterpiece II series were steeper than those
of the original series. The Masterpiece lens series had the distinction of being the first minus
cylinder design lens series; that is, the toric surface was on the back. Minus-cylinder
design has a number of advantages over plus-cylinder
design, as is described in the next section. Once Masterpiece lenses
became popular, other manufacturers gradually began to introduce minus-cylinder
designs in both glass and plastic. In the current spectacle
lens market, almost all lenses made are minus cylinder. SPECIAL PROBLEMS OF SPHEROCYLINDER LENSES Spherocylinder, or toric, lenses present a special problem because there
is only one selection of curvatures to control errors for the two principal
meridians. The cylinder power could be ground on either lens surface, but
for many reasons, almost all lenses made today are of minus-cylinder
design. First, the correction of off-axis aberrations is superior
in minus-cylinder designs. Although it is necessary to compromise
the correction between the two principal meridians, the compromise
is in general a better one than is possible for plus cylinders. Plus cylinders
actually have a slight advantage for plus-power prescriptions. Second, minus-cylinder
design results in less meridional magnification
difference between the principal meridians and between lenses. Third, almost
all multifocal lenses currently made are of minus-cylinder design. When
presbyopia develops, a patient is less likely to have problems
adapting to bifocals if he or she is already wearing minus-cylinder
lenses and there are no shifts in magnification. Finally, minus cylinders
are cosmetically more attractive. A large cylinder is noticeable
when it is placed on the front of a lens. A minus cylinder hides the
edge thickness changes that are created by the cylinder behind the frame
eyewire. The problem of lens design for a spherocylinder lens is illustrated in Figure 12. The CR-39 plastic lens is a minus cylinder design of power + 4.00 -2.00 (or + 2.00 + 2.00, if written in plus-cylinder notation). Each
of the two principal meridians of the lens has its own tangential
and sagittal foci for a given base curve, and these values are
not the same for the two meridians. The graph shows how these errors affect
the spectacle prescription at two points, one in each principal
meridian, at a viewing angle of 28 degrees for a variety of base curves. For
example, at point A, the spherical error in the prescription for
a + 7.25-D base curve is + 0.25 D and the cylinder error is -0.45 D. A
patient looking through point A would be looking through
a lens of power + 4.25 -2.45, with the axis of the cylinder depending
on the orientation of the lens in the frame. 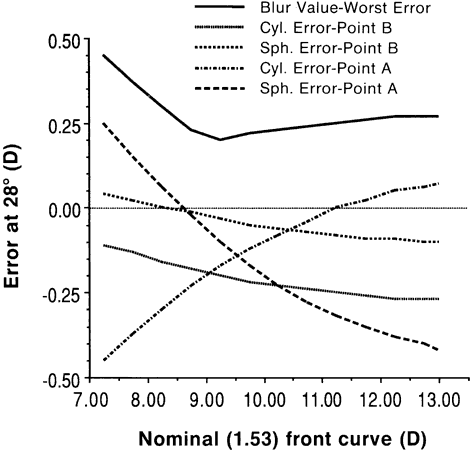 Fig. 12. Inherent lens performance errors for different base curves at an average
fitting distance for a CR-39 plastic lens of power + 4.00 -2.00. Both
the spherical and cylindrical errors were determined at two points 28 degrees
from the optic axis. Point A was in the cylinder axis meridian, and
point B was in the cylinder power meridian. Blur was defined
as the absolute value of the largest of the four errors, with negative
spherical errors weighted by 0.5 against radial astigmatism and plus
power errors. (Modified from Davis JK: Prescribing for visibility. Probl Optom 2:131, 1990.) Fig. 12. Inherent lens performance errors for different base curves at an average
fitting distance for a CR-39 plastic lens of power + 4.00 -2.00. Both
the spherical and cylindrical errors were determined at two points 28 degrees
from the optic axis. Point A was in the cylinder axis meridian, and
point B was in the cylinder power meridian. Blur was defined
as the absolute value of the largest of the four errors, with negative
spherical errors weighted by 0.5 against radial astigmatism and plus
power errors. (Modified from Davis JK: Prescribing for visibility. Probl Optom 2:131, 1990.)
|
Because the four errors for the two principal meridians vary, determining
the single best front (base) curve is complicated. To this end, lens
designers often use a single number, a “blur value,” for
each base curve to evaluate the quality of the design. The blur value
relates off-axis lens aberrations to their effects on visual acuity, based
primarily on the effects of refractive error on visual acuity, as
described previously. Blur value was defined for this example as the
absolute value of the greatest of the four errors at each base curve, with
negative spherical power errors weighted by one half against astigmatic
errors and positive spherical power errors given the same weight
as astigmatic errors.6 Negative power errors were given less weight than other errors because
a patient can accommodate to minimize visual effects. The blur value
is least for a base curve of approximately + 9.25 D, suggesting that + 9.25 D
is the optimal base curve for this lens power. The analysis shown in Figure 12 is performed for all important lens sphere and cylinder power combinations
when a lens series is created. This illustration shows the complexity
of the design process. At one time, such calculations were performed
by hand. The introduction of computers has both quickened the design
process and allowed more complex designs, such as aspheric lenses, to
be developed. MAGNIFICATION AND LENS DESIGN Effects of Lens Magnification The magnification effects of spectacle lenses are as much of a concern
as off-axis aberrations. A patient with a proper refraction may have excellent
visual acuity with a new pair of glasses, yet report that floors
are not level, that stairs are not where they should be, or that things “just
do not look right.” These problems often stem
from the magnification properties of a pair of spectacles. If the two
lenses of a pair are different, the sizes of the images that they form
may be different. Suppose a patient receives his or her first pair of glasses of power right
eye -0.50 D, left eye -1.00 D. Images of the most distant objects
are 2 m (approximately 6 feet) away for the right eye and a little more
than 1 m (3 feet) away for the left. Not only is everything nearer, but
the images also are smaller and may appear to be of different sizes
for the two eyes. The changes in apparent distance and size of objects
conflict with the patient's previous experience without the glasses. Because
differences in the size of the two retinal images provide
the binocular interpretation of space and stereoscopic vision, things
certainly will not look quite right. Remarkably, most patients adjust to this situation rapidly. This new set
of optical inputs is correlated with inputs from the other senses, and
the patient begins to function with the advantage of better visual
acuity. Most people readily adapt to their first glasses or to changes
in the prescription. However, their ability to adapt may differ from
their willingness to do so. Some patients keep their old glasses and wear
them interchangeably with their new ones, although the prescriptions
vary considerably. Others cannot stand a frame that is out of alignment
by more than 1 mm. Quantifying Magnification Problems The effects of spectacle lenses on retinal image size (spectacle magnification) may
be calculated from the formula25: (2)
SpectacleÜqnMagnification = Üp311 - (tn) D1 Üp8 × (11 - hD)
where t is the lens center thickness in meters, D1 is its true (not 1.53) front curve in diopters, n is its index of refraction, h
is the distance from the lens back surface to the entrance pupil
of the eye (vertex distance + 3 mm) in meters, and D is the
lens back vertex power in diopters. The first portion of this equation, which
includes the thickness and front curve of the lens, is termed
the shape factor, and the second portion is termed the power factor. The shape factor almost always provides magnification, and the power
factor provides magnification for plus-power lenses and reduction for
minus-power lenses. Part of a lens designer's job is to use small steps in base curve
between adjacent prescriptions to minimize the magnification differences
that occur when the spectacle lens powers are different for the two
eyes (an anisometropia). In a factory-finished uncut lens series, base
curve steps rarely are as large as 1.50 D. Frequently, they are less
than 1.00 D. In a semifinished lens series, the steps usually are larger, but
in a better series, they rarely exceed 1.50 D. Semifinished series
that are not as well designed have 2.00-D steps. Shape magnification
differences between base curve steps can reach clinically significant
levels in plus-power prescriptions greater than about + 5.00 D, as
shown in Table 3. The front curves and center thicknesses used in Table 3 were chosen for each lens power from a polycarbonate semifinished lens-surfacing
chart. Shape and power magnification were then calculated for
each lens power, using the aforementioned formula. For a 1.50-D or
less difference in power between any two lenses, shape magnification differences
can reach approximately 1.5%, but most differences are about 1.0%, and
some are less. For lens powers below + 3.00 D, the thickness
differences between lenses are too small for shape magnification
differences to be a concern. Therefore, one simple solution to shape
magnification problems is to order both lenses with the same thickness. Then, even
with different base curves for good field-of-view correction, the
shape magnification differences between lenses of different
power are attenuated. TABLE 3. Shape and Power Magnification Values for Selected Lens Powers*
| Lens Power (D) | 1.53 Base Curve (D) | Center Thickness (mm) | Shape Magnification (%) | Power Magnification (%) |
| + 6.00 | + 10.89 | 7.1 | 5.70 | 11.36 |
| + 5.75 | + 10.89 | 6.0 | 5.61 | 10.83 |
| + 5.50 | + 9.75 | 6.6 | 4.70 | 10.31 |
| + 4.50 | + 9.75 | 5.8 | 4.10 | 8.28 |
| + 3.75 | + 8.55 | 5.1 | 3.14 | 6.81 |
| + 3.25 | + 8.55 | 4.7 | 2.88 | 5.85 |
| + 3.00 | + 7.52 | 4.5 | 2.42 | 5.37 |
| + 2.00 | + 6.46 | 3.6 | 1.65 | 3.52 |
*Base curves and center thickness were obtained from a polycarbonate semifinished
lens surfacing chart. Power magnification was calculated using
a vertex distance of 14 mm.
Magnification differences between the eyes usually are small, less than 5%. (The
magnifications of commonly used low-vision aids are in the neighborhood
of 2× to 10× , or 200% to 1000%). However, when
a small image size difference is created between the eyes, the brain
interprets the difference as a clue for binocular stereoscopic depth
perception. Because stereoscopic vision is so sensitive, small differences
in magnification can create significant problems with spatial perception. These
difficulties often are manifested as problems in adapting
to new glasses. The accepted threshold at which problems can occur
is a difference of 0.8% to 1% between the eyes.13 Differences in magnification caused by differences in the astigmatic corrections
for each eye, whether cylinder power differences or cylinder
axis differences, may result in both image size differences and changes
in the shapes of the two images. Oblique cylinders (cylinder axes close
to 45 or 135 degrees) tend to cause the most problems, with patients
reporting problems for cylinder powers of 0.75 D or less. The spectacle magnification formula of equation 2 does not provide a method
for calculating magnification differences between the eyes in anisometropia. The
difficulty occurs because the spectacle magnification
formula relates the retinal image size when a correcting lens is worn
to the uncorrected image size. Unless the uncorrected retinal image sizes
for the two eyes are the same, spectacle magnification calculations
cannot provide any information about the relative image sizes of the
eyes. For example, if the spectacle magnification for the right eye is
calculated to be 5% and the spectacle magnification for the left eye
is 2%, it cannot be said that the right eye image is 3% larger than the
left because the uncorrected right and left eye image sizes may not
have been equal before the spectacles were worn. Calculation of retinal
image size differences between the eyes requires knowledge of such
parameters as the axial length and the power of each eye,26 information that is not easily available. For exact measurement of magnification
differences between the eyes, an eikonometer must be used. One should not assume that a patient's displeasure with a new pair
of glasses is a result of magnification problems. The obvious questions
to be asked are, “What were the powers of the patient's
old glasses?” and “Has the patient had problems adapting to
other pairs of glasses in the past?” The old adage of not changing
the base curves of a new pair of glasses relative to the values of
the patient's old glasses makes little sense because the new power
magnification differences usually are much greater than any likely
change in shape magnification difference. Before attempting to solve
a suspected magnification problem, the glasses should be checked thoroughly
against the lens powers ordered in all respects and the base curves
verified against the manufacturer's chart. Aniseikonia When an anisometrope cannot adapt to the difference in the magnification
effects of the two lenses, then the patient has clinically significant
aniseikonia. Because eikonometers are not commonly available for clinical
use, the diagnosis and management of aniseikonia is usually based
on clinical signs and symptoms, with magnification differences estimated
from the differences in refractive error.27–30 Correction of aniseikonia requires an alteration of base curves and center
thicknesses (alteration of the shape factors) from their normal values
to alter the magnifications of the retinal images. Spectacle lenses
designed for this purpose are termed eikonic or iseikonic lenses. These lenses are often expensive and difficult for the optical
laboratory to manufacture. Rather than provide eikonic lenses, practitioners often alleviate spectacle
adaptation problems, or aniseikonia, by modifying the prescription. When
cylinder corrections are at oblique axes, patients often report
distortion of images (tilting of walls or floors, floors being too close
or too far away). Often the problem can be minimized or eliminated
by a decrease in the cylinder power or a rotation of the cylinder axes
toward 180 or 90 degrees. This prescription modification can be thought
of as a modification of the lens magnification, although the resulting
image blur decreases sensitivity to image magnification. A partial
correction of a large spherical anisometropia, such as that created
by a beginning nuclear cataract in one eye, is another commonly used
solution for spectacle-induced aniseikonia. These types of prescription
modification require sound clinical judgment because visual acuity is
being sacrificed, but they provide an acceptable solution if correction
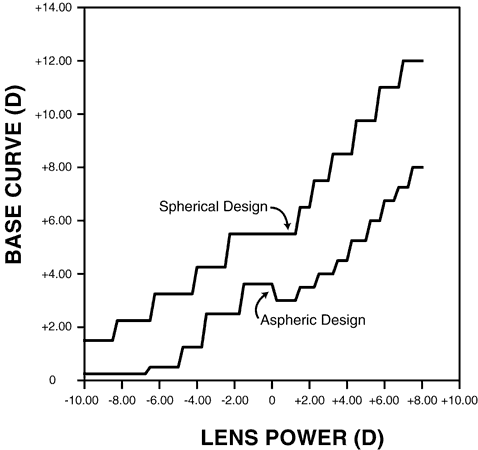
of aniseikonia will not be attempted. THE BASE CURVE CHART, A “BLUEPRINT” OF THE DESIGN A base curve chart presents the base curves that are used for a given lens
power for a particular lens design. If the back surface curves and
center thicknesses are also included, then the chart is more properly
termed a surfacing chart because it provides all the information needed to make a finished lens. Figure 13 shows a hypothetical base curve chart for a lens series. It is hypothetical
in the sense that the base curves and boundaries between them were
not evaluated by computing and do not represent any existing lens series. This
type of chart is used as a guide for laboratories in selecting
semifinished blanks for use in grinding a given prescription. A similar
set of charts could be used in the optical dispensary if base curve
selection depends on frame fitting distance. 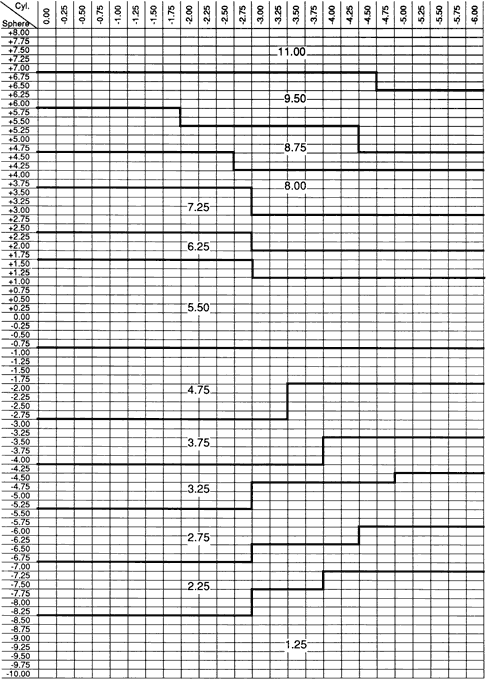 Fig. 13. A hypothetical base curve chart. Fig. 13. A hypothetical base curve chart.
|
In the ophthalmic industry, the base curve chart is a statement of the
lens design. Because it delineates the structure of each lens in a series, the
base curve chart is, in a sense, a blueprint and a guide to indicate
the base curves that the designer intended for various prescriptions. The
dispenser knows which base curves to expect when he or she
orders a prescription by trade name. When the prescription is received, the
base curve choice can be verified against the chart. The spherical components of prescriptions are indicated by the horizontal
rows for sphere powers from + 8.00 D to -10.00 D. The cylinder
components are indicated by the various columns, labeled from 0.00 to -6.00 D
across the top of the page. Each “box” at the intersection
of a row and a column represents a possible spherocylinder prescription. Knowing
the prescription and the 1.53 base curve, the optical
laboratory can easily determine the concave curve. Some charts contain
a column of thicknesses down the left side. Others use a separate
table. This chart contains a number of clues to the care that went into
the design. The following points are important to consider in the
analysis of this hypothetical design: - There is a plurality of base curves. There are a sufficient number to provide
reasonably good performance, although more base curves would provide
even better optical quality. Manufacturers should augment their
charts with information on design criteria and tolerances.
- Base curves are staggered across the page for various cylinder values. It
is obvious that the design for a sphere alone and for the same sphere
with a -6.00 D cylinder may sometimes lead to different base curve
choices, but some lens series call for no change, with the horizontal
boundaries straight. However, the zigzag boundaries are too few. A good
series has 8 to 10 zigzags for each base curve in the minus area. Aspheric
designs may have fewer or possibly no zigzags in some areas of
the chart. Manufacturers should supply information about the design performance.
- There is a + 1.50-D base curve step in the high-plus area. This step
is too large for such thick lenses. The thickness for a + 7.00-D
lens would be approximately 6 mm, resulting in an approximately 0.6% difference
in shape magnification between a + 6.75-D lens that
will have a + 9.50-D base curve and a + 7.00-D lens with a + 11.00-D
base curve. Magnification differences, and to some extent, field-of-view
errors sometimes are sacrificed in the high-plus area
to minimize inventories of these seldom-used lens blanks.
|
