VISUAL ACUITY TESTING Snellen Charts and Projectors Since its introduction in 1862, the Snellen test chart has been the clinically
preferred standard used to measure visual acuity, and thus also
used initially to assess the effect of cataracts on visual function. It
remains the gold standard used to measure minimum separable and legible
acuity,8 to measure the effect of any abnormal state of the eye, as well as for
measurement of the effectiveness of medical and surgical intervention
in diseased states of the eye. Recently, the need to be able to obtain measurements of visual acuity values
that can be used for statistical analysis for research studies has
led to further standardization and modifications of the Snellen chart. One
such modification for such purposes is the Early Treatment Diabetic
Retinopathy Study or ETDRS version.9 It was designed to have a geometric progression of the letter size of
test letters and standardized lighting of the chart. Visual acuity scores
are expressed as the logarithm of the minimal angle of resolution (LogMar), which
is linear, meaning, it decreases by 0.1 unit
for each lower line on the chart. Most current clinical eye research
studies use the ETDRS visual acuity chart measurements as a major end
point. As recently as four decades ago, as a result of high complication rates, cataract
surgery was deferred until a patient did not have much to lose
in terms of visual acuity, should intraoperative or postoperative
surgical complications occur. Patients were advised to wait until their
cataract was “ripe” and their Snellen visual acuity dropped
down to 20/80 or worse before contemplating surgery. With the development
of safer techniques such as the intracapsular cataract extraction (ICCE) technique using the Cryoprobe, and later the extracapsular
cataract extraction (ECCE) technique using automated
irrigation-aspiration (I/A) devices and implantation
of an intraocular lens (IOL), the indication for cataract
surgery was lowered to a Snellen acuity of 20/40 or worse coupled with
anticipated improvement of vision. In most states, a minimum requirement
for an unrestricted license to drive a vehicle was a visual acuity
of 20/40 and a patient could potentially lose his/her driver's
license should his/her Snellen acuity drop below this level. Hence, the
cataract needed to be removed to allow the patient to continue driving. Currently, with the development of even safer techniques such as phacoemulsification
followed by implantation of an IOL (resulting in lower
complication rates and superb postoperative vision), the indications
for surgery have further changed. The American Academy of Ophthalmology (AAO)'s Preferred Practice Pattern for Cataract in the Adult Eye states that there is no single test that adequately describes the effect
of cataract on visual status and functional ability. Cataract/IOL surgery
is therefore indicated when the vision no longer meets the requirements
of the patient, and when the expected surgical benefits outweigh
the risks. Hence, not only the level of visual acuity but other considerations
such as the ability to perform daily tasks of living, ability
to perform work or avocations, and good quality of life in general
are equally important in deciding when cataract extraction should be
performed. Snellen-type visual acuity tests measure the eye's ability
to resolve fine detail at high contrast but do not adequately describe
the ability to see large but low contrast patterns such as faces or nearby
objects. A cataract may affect the results of the Snellen acuity
test minimally, and yet a patient may already experience difficulties
in daily activities such as driving or walking especially in bright sunlight
or at night, or have difficulty in their line of work, such as
lawyers or accountants who need to read fine print accurately or architects
who need to see fine lines in a line drawing. Recently, a number of tests have been proposed to document changes in visual
function that are not detected by the Snellen visual acuity test. Among
the important ones are contrast sensitivity testing and glare
testing.10 A number of glare and contrast sensitivity tests have been devised and
continue to be further refined, especially with the use of computer monitors. Potential
acuity tests such as the Guyton-Minkowsky Potential
Acuity Meter (PAM) and clinical interferometers are
used mainly to determine macular function independent of media opacities
such as corneal, lens, and vitreous opacities. The Resolution Test
Target Projection Ophthalmoscope was developed to document distortions
in vision that are not adequately determined by the Snellen acuity test. The
following are discussions of each of these. Clinical Contrast Sensitivity Tests Contrast sensitivity is a measure of the amount of contrast required to
detect or recognize the target. Cataracts increase intraocular light
scatter causing a reduction in retinal image contrast, and a subsequent
decrease in contrast sensitivity. In general there are two types of
devices used for contrast sensitivity testing.10 The traditional devices consist of sine wave gratings, which are patterns
of alternating light and dark bars produced and controlled by computers, wherein
the spatial frequency, contrast luminance, field size, and
attenuation at the edge of the field are either modifiable or fixed.11 Examples of this are, among others, Optec 3500 Vision Tester (Stereo
Optical Co., Inc., Chicago, IL), B-VAT PC system (Medtronic
Solan Co., Inc., Jacksonville, FL), Smart System 20/20 (M & S
Technologies, Inc., Chicago, IL), and CSV-1000E
Contrast Sensitivity Instrument (VectorVision, Inc., Arcanum, OH). The
second type of devices are based on photographically
reproduced sine wave gratings (such as the Arden plates and the
Vistech vision contrast test system) or variable contrast optic types (such
as the Regan letter chart, the Vistest picture test, the
Pelli-Robson letter chart, and the Melbourne edge test),12 Hess and Woo13 first reported contrast sensitivity function loss in patients with cataracts. They
suggested that early cataracts cause high-spatial
frequency loss, whereas more advanced cataracts produce both high- and
low-spatial frequency losses. Drews-Bankiewicz et
al.14 documented correlations between early nuclear cataracts with loss of contrast
sensitivity in the intermediate and high spatial frequencies (4 to 16 cycles
per degree). Lasa et al.15 found significant contrast sensitivity loss only in advanced cortical
and posterior subcapsular cataracts. This loss was also correlated with
decreased Snellen visual acuity. Adamsons et al.16 however, found that contrast sensitivity scores were lower for all patients
with lens opacities than for clear lenses at high frequencies only, and
all lens opacity groups scored similarly with each other. Recently, Kuroda
et al.17 found a significant correlation between increasing lens density (using
the Scheimpflug camera to measure lens density) and loss of
contrast sensitivity in nuclear and cortical cataracts at 12 cycles per
degree. Glare Testing Glare sensitivity refers to the change in visual function caused by the
presence of a glare (light) source in another part of the visual
field. In general, glare can be divided into either discomfort or
disability glare. Discomfort glare causes a photophobic sensation without
measurable effects on visual function, whereas disability glare
causes reduction in visual function because of the presence of a bright
light source.18 Disability glare is a specific type of glare caused by light scattered
by the ocular media and is the type of glare that is commonly tested
by the devices that have been developed to document glare. Glare testing is helpful in documenting glare disability especially for
those patients who complain of glare when driving at night and having
difficulty with oncoming headlights, or having difficulty reading road
signs when there is bright sunlight.19 Examples of these devices include the Brightness Acuity Tester or BAT (Marco
Ophthalmics, Jacksonville, FL), the CSV 1000HGT (VectorVision
Inc., Arcanum, OH), and the Optec 3500 Vision tester (Stereo
Optical Co., Inc, Chicago, IL). Potential Acuity Tests Pinhole acuity8 is easy and quick to perform and is often used when visual acuity is less
than 20/20. It can give useful information, especially if one obtains
a good reading. However, a poor pinhole acuity result does not necessarily
mean poor macular function because the decrease in retinal illumination
produced by use of the small aperture degrades the image as
it reaches the macula. Recently, Melki et al.20 studied a standardized method of pinhole testing and found it relatively
reliable in estimating the visual outcome after uncomplicated cataract
surgery without coexisting disease. Another version of the pinhole
test described by Hofeldt and Weiss21 uses a specially illuminated near card (Mini-Illuminated Near
Card, Gulden Ophthalmics, Elkins Park, PA). They found that it
was useful in predicting postoperative acuity in cataractous eyes with
comorbid disease. Various tests of visual discrimination such as the ability to perceive
light coming from various quadrants of the visual field (light projection), to
perceive the orientation of the streak from a Maddox
rod, and to discriminate between two light sources versus one source
of light do not depend on macular function. Even color perception is
not a valid measure of macular function, since cone receptors are present
in the peripheral retina. The electroretinogram and visual evoked
potential are not specific for macular function. These tests do not correlate
well with visual acuity in the presence of amblyopia or macular
degeneration. The entoptic phenomenon test is traditionally used in mature cataracts
to test for gross retinal function. This phenomenon is created by sweeping
a small light source such as a hand-held light from side to
side against the eye, usually shining the light through the lower or
upper eyelid pointing toward the macular area. The strips of photoreceptors
beneath the retinal blood vessels do not have time to adapt when
the shadows of the blood vessels move rapidly from side to side, and
the shadows become visible as a branching pattern embracing the macula. Perception
of the vascular shadows described as seeing veins or vines
is a time-honored test for visual function in mature cataracts, but
it is not specific for macular function and therefore does not
correlate well with postoperative visual acuity in the presence of localized
macular disease. Entoptic phenomena are poorly quantifiable and it is difficult to assign
a numeric level of expected visual acuity based on the response of a
patient. Using the bluefield entoptoscope, Sinclair and coworkers22 tested 136 eyes prior to uncomplicated cataract surgery. They obtained
up to 94% correct prediction of good foveal function and at least 75% correct
prediction of poor foveal function. However, Murphy,23 showed less success with bluefield entoptoscopy, especially in dense cataracts. False-positive predictions of potential acuity have also
been reported in the presence of macular disorders. In the presence of dense mature cataracts, if there is serious doubt as
to the status of the retina or optic nerve, and thus the outcome of cataract
surgery, it may be necessary to perform additional tests such
as ultrasonography and computed tomography (CT) scanning. The following two devices were designed as macular function test devices
independent of media opacities in the cornea, aqueous, lens, or vitreous: the
potential acuity meter and the clinical interferometer. In actual
practice, however, both are effective only in mild to moderate cataracts
where there is no macular dysfunction or disease state. However, they
have proven to be very useful within these limits, esp. in predicting
surgical outcomes in questionable cases, as discussed below. The Guyton Minkowski PAM (Marco Ophthalmic, Jacksonville, FL)24 projects a standard Snellen chart through a 0.1-mm diameter aperture. This
projected chart is directed through small windows in the cataract
onto the macula and the patient reads the chart from 20/400 to 20/20. It
uses a low-cost incandescent lamp and has a field of
vision of 6 degrees. In the clinical interferometer, beams of coherent light from two point
sources are directed to the clearest area of the lens into the retina. Interference
fringes in the macula are formed wherever the two beams
overlap and by varying the width of the interference fringe pattern, visual
acuity can be determined with the Snellen equivalent from 20/660 to 20/20, independent
of the optics of the eye. Clinical interferometers
use either red helium neon laser light or white light from an incandescent
source such as a Xenon Halogen lamp, with a field size ranging
from 1.5 degrees to 8 degrees. An example of this is the Heine Lambda 100 hand-held
Retinometer (Lombart Co., Norfolk, VA). In actual use, both the PAM and clinical interferometers underestimate
as well as overestimate the potential vision in certain conditions.25 The PAM tends to underestimate the potential acuity in advanced, dense
cataracts without any clear zones or openings through which to project
the Snellen chart. This is not necessarily a disadvantage in such cases, because
the actual postoperative acuity may be much better than predicted, to
the pleasant surprise of both patient and surgeon. On the other hand, clinical interferometers tend to overestimate potential
vision in patients with macular disease, such as macular degeneration
and amblyopia. In this device the retina has to distinguish the two
overlapping coherent light beam fringes as two distinct lines. There
may happen to be a few good cones that are situated at just the right
position to distinguish these two lines as separate and give a good potential
acuity reading. However, there may not be enough cones to recognize
a Snellen letter of the equivalent level of acuity. This may result
in an overestimation of the potential vision resulting in an unexpectedly
poor postoperative vision. Both the PAM and clinical interferometers are therefore useful to determine
the potential acuity and possible outcome of surgery in patients
with mild to moderate cataracts. However, they perform poorly in dense
opacities, which they cannot penetrate, so that the patient cannot perceive
the test objects. Caution should be used when interpreting results
from patients with macular disease and amblyopia.26–28 Tests for Refractive Distortions in the Lens RESOLUTION TEST TARGET PROJECTION OPHTHALMOSCOPE. Localized refractive distortions may occur during the development of a
cataract, which may distort vision to such an extent that the patient
is incapacitated. This may be of major importance to patients with special
visual needs, such as surgeons, accountants, bookkeepers, and architects. A
device to document these distortions by projecting a series
of parallel lines into the retina, which decrease in size to correspond
to a Snellen equivalent numerical unit of measure, was developed by
the U.S. Air Force29 and modified by Lobo and Weale.30 The Oqual (Zeiss Meditec, Dublin, CA) is mounted on an ophthalmoscope
and the examiner views the projected lines in the fundus, grades
the degradation of the projected chart image, and documents the degradation
of the image using the Snellen equivalent unit.
Recently, wavefront technology,17 using
the same idea but more sophisticated methods, promises to be a useful
tool in documenting and quantifying the existence of these refractive
abnormalities. If the ocular media do not appear opaque enough to explain
visual loss (in the presence of an otherwise normal cornea, retina and
optic nerve), such refractive lens changes may be responsible and may
indicate the need for lens extraction (see under “New
Methods”).
FUNCTIONAL IMPAIRMENT/QUALITY-OF-LIFE TESTS During careful history taking, the patient usually volunteers typical complaints
associated with cataracts, such as painless, progressive loss
of vision, difficulty seeing in bright sunlight or at dawn and dusk, increased
glare from incoming headlights when driving at night, and difficulty
reading road signs. As a result of the vast improvement of cataract
and intraocular lens surgical techniques, with the resultant decrease
in the complication rate of cataract surgery, criteria for cataract
surgery have changed in recent years. These changes allow for earlier
surgery if the cataract interferes with the patient's occupation
and other activities, combined with the determination (using
the potential vision tests described above) that the patient would
indeed benefit from cataract surgery. Hence, any visual difficulty
with daily activities, as well as the patient's occupational, leisure
and social activities, should be inquired about and noted down. A
brief statement should be entered into a patient's chart to summarize
these discussions, such as: “The patient's visual function
has decreased to a level that interferes with the patient's
ability to carry out normal daily activities. In addition, given the
mental status and physical abilities of the patient, there is reason
to expect some surgical benefit in function and personal comfort and/or
activity.” This can be added to the consent form also, with the
statement that possible complications with eye surgery were discussed
with the patient. These discussions with the patient and their proper
documentation in the chart play a crucial role in the decision making
in cataract surgery as well as in litigation when there is a problem
as to the outcome of cataract surgery. Recent research has also revealed the interesting observation that in older
patients, cataracts may play an important role in the causation of
car accidents,31 falling accidents resulting in fractures,32 and mortality and functional decline.33 Hence, earlier visual rehabilitation through cataract/IOL surgery is becoming
not only an option but a necessity. Recently, more detailed and standardized methods of documenting these visual
and functional disabilities have been developed, especially for
clinical research purposes. National Eye Institute Visual Function Questionnaire: 25 Items (VFQ-25) The National Eye Institute Visual Function Questionnaire: 25 Items (VFQ-25) was
developed under the sponsorship of the National
Eye Institute with the goal of creating a survey that would measure
the dimensions of self-reported, vision-targeted health
status that are most important for persons with chronic eye problems.34 The survey measures the influence of visual disability and visual symptoms
on patients' daily visual functions as well as other health
domains such as emotional well-being and social functioning. It
consists of a base set of 25 vision-targeted questions representing 11 vision-related constructs, plus 1 general health rating
question. It takes approximately 10 minutes for an interviewer to administer. There
is also a self-administered format. The VFQ-25 forms (revised 2000), as well as additional information, can
be obtained from the website of the National Eye Institute (www.NIH.GOV). Visual Function Questionnaire—14 Items (VF-14) The Visual Function Questionnaire—14 Items (VF-14) was
developed by a team from the Johns Hopkins University Hospital
and Georgetown University Hospital as a measure of functional impairment
caused by cataract and provides information not conveyed by visual
acuity or a general measure of health status. It has also been shown to
be sensitive and reproducible.35,36 Others test such as the Short Form-36 Items (SF-36),37, 38 Activities of Daily Vision (ADV),39 and Sickness Impact Profile (SIP)40 are other measures of functional impairment that have been used in clinical
research on cataract patients. OPHTHALMOLOGIC CLINICAL EXAMINATION Hand-Held Light Examination Field eye examinations, such as done in epidemiologic studies and surveys, can
be facilitated by the use of a hand-held light in conjunction
with a head-mounted or spectacle-mounted magnifying
loupe, ideally inside a darkened room (to promote mydriasis). Because
one is looking mainly for visually significant cataract, information
obtained with this method, together with a Snellen visual
acuity measurement, is the usual end point for these studies. More sophisticated
equipment such as an ophthalmoscope and a hand-held
slit lamp biomicroscope will be needed if a more precise classification
and grading of the cataract is needed. Ophthalmoscopy The use of the direct ophthalmoscope's built-in +10 lens
both with direct illumination and retroillumination using the light
reflected from the fundus allows the detection of opacities in the lens, especially
in field situations. However, the two-dimensional
monocular view, the limited magnification and the short working distance
makes ophthalmoscopy inadequate for thorough cataract evaluation. The
indirect ophthalmoscope may also be useful in making a gross assessment
of the clarity of the media as one looks at the fundus. Experienced
clinicians performing indirect ophthalmoscopy can often gauge the
amount of vision loss from the haziness in the ocular media that they
observe. These are gross assessments, however, and are inferior to information
obtained from the slit-lamp biomicroscope. Other Accessory Devices Ultrasonography (A and B scan) is used routinely to obtain measurements (axial
length of the eye, anterior chamber depth, lens
thickness) needed for intraocular lens power calculation. In completely
opaque, mature cataracts, it is also useful in determining the
status of the vitreous and retina. Specular microscopy of the lens epithelium (originally
developed for the cornea) is also being
used to study age-related changes41 as well as changes in the lens epithelium in special cataracts such as
the myotonic dystrophy cataract.42 Confocal microscopy (originally used in vivo on the cornea) is also being tried on the lens in vivo, and promises to be useful in the future. Slit-Lamp Examination The optimum way of examining the lens clinically is using the slit-lamp
biomicroscope through a widely dilated pupil. This instrument
provides a three-dimensional view of the lens. One can focus on
specific areas of the lens from different angles, and at the same time
vary the location, direction, and intensity of the illuminating beam
independently. The following techniques can be used: (1) direct
focal illumination using either a wide or narrow beam; (2) retroillumination; and (3) others including specular reflection, indirect
illumination, diffuse illumination, and use of the light
reflected from the iris and posterior capsule. In direct focal illumination, the slit beam is positioned directly on the
area being studied. One can use various configurations of the slit
beam, but the most useful way is a narrow beam to produce the cross section
of the lens. The light is slightly attenuated by passage through
the cornea and undergoes refraction, reflection from the surfaces (zones
of discontinuity), scattering, absorption, polarization, and
fluorescence. Vogt43 first used slit-lamp biomicroscopy using the narrow beam (0.1- to 0.5-mm thick) to study the lens and described
the various “zones of discontinuity” denoting the layers
of the lens fiber cells laid down during a patient's lifetime. These
zones represent lenticular growth periods and aid in determining
time of origin of opacities. Because of the narrow depth of focus of
the biomicroscope, the examination begins at the anterior capsule and
gradually focuses deeper to see the various layers. The zones of discontinuity
are the shells of the nucleus and cortex that are concentric
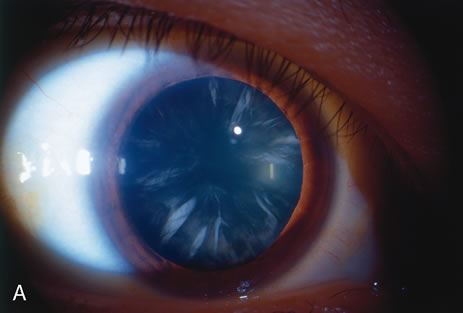
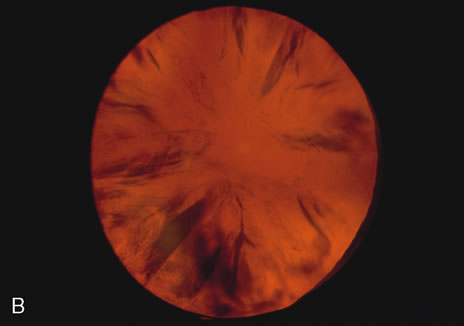
to each other (Figs. 2, 5, 6, and 7). 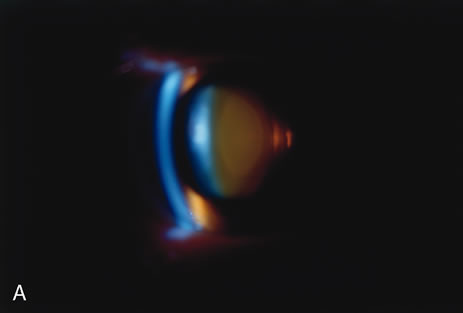 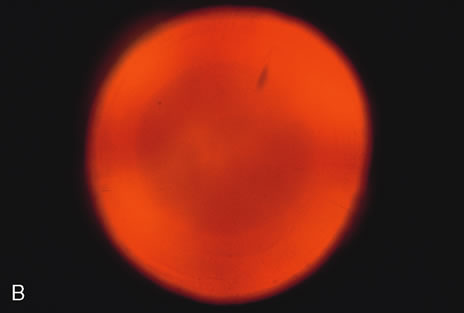 Fig. 2. Brunescent (brown) nuclear cataract using (A) narrow beam slit illumination and (B) retroillumination. The cataract is best seen by direct slit illumination. In
retroillumination, as seen in this image, the outline of
the nuclear cataract may be seen due to its increased refractive index, although
the cataract does not cast any shadows. Because of its central
location, this cataract may cause distortion of images early in their
development. Fig. 2. Brunescent (brown) nuclear cataract using (A) narrow beam slit illumination and (B) retroillumination. The cataract is best seen by direct slit illumination. In
retroillumination, as seen in this image, the outline of
the nuclear cataract may be seen due to its increased refractive index, although
the cataract does not cast any shadows. Because of its central
location, this cataract may cause distortion of images early in their
development.
|
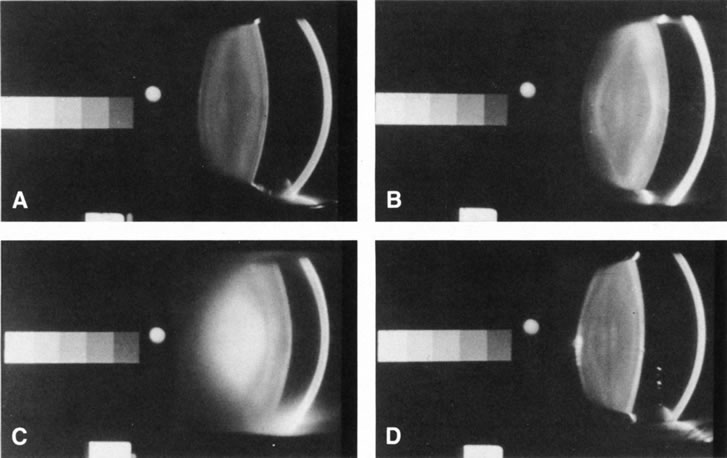 Fig. 5. Scheimpflug slit-lamp photographic images of: (A) normal; (B) cortical; (C) nuclear; and (D). Posterior subcapsular cataracts. The Scheimpflug method allows
for slit-lamp imaging wherein the entire lens is in focus. The
gray scale on the left of each image was built-in to aid standardization
of the image during densitometry (for objective quantification
of the opacities). Fig. 5. Scheimpflug slit-lamp photographic images of: (A) normal; (B) cortical; (C) nuclear; and (D). Posterior subcapsular cataracts. The Scheimpflug method allows
for slit-lamp imaging wherein the entire lens is in focus. The
gray scale on the left of each image was built-in to aid standardization
of the image during densitometry (for objective quantification
of the opacities).
|
|
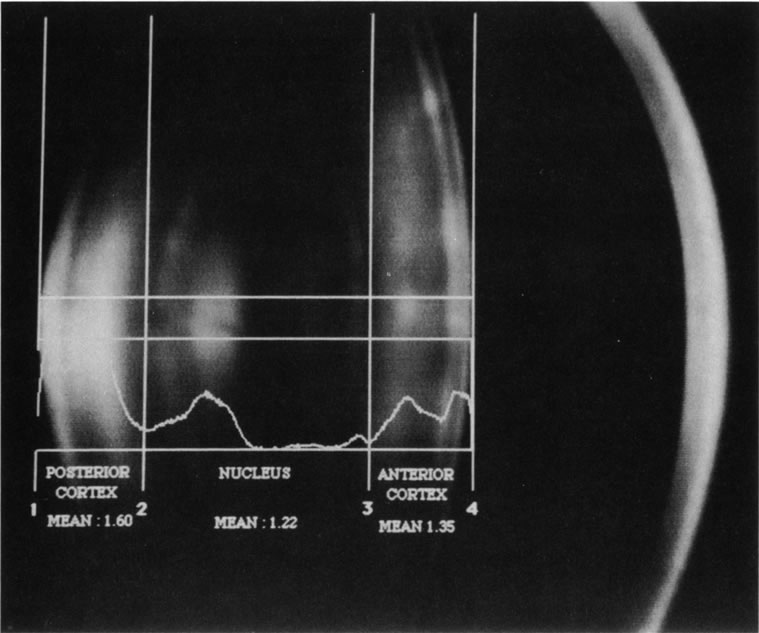 Fig. 6. Automated densitometric analysis of a digital Scheimpflug slit image of
a normal 50-year-old lens. Because of the characteristics
of the lens layers, the location of the cortex and nucleus can be automatically
detected by special software, and with automated densitometry, mean
optical density values can be easily and quickly obtained for
analysis. Thus, automated detection, classification, and grading may
be possible. Note the concentric layers of lens fibers in the cortex
and the nucleus.
|
|
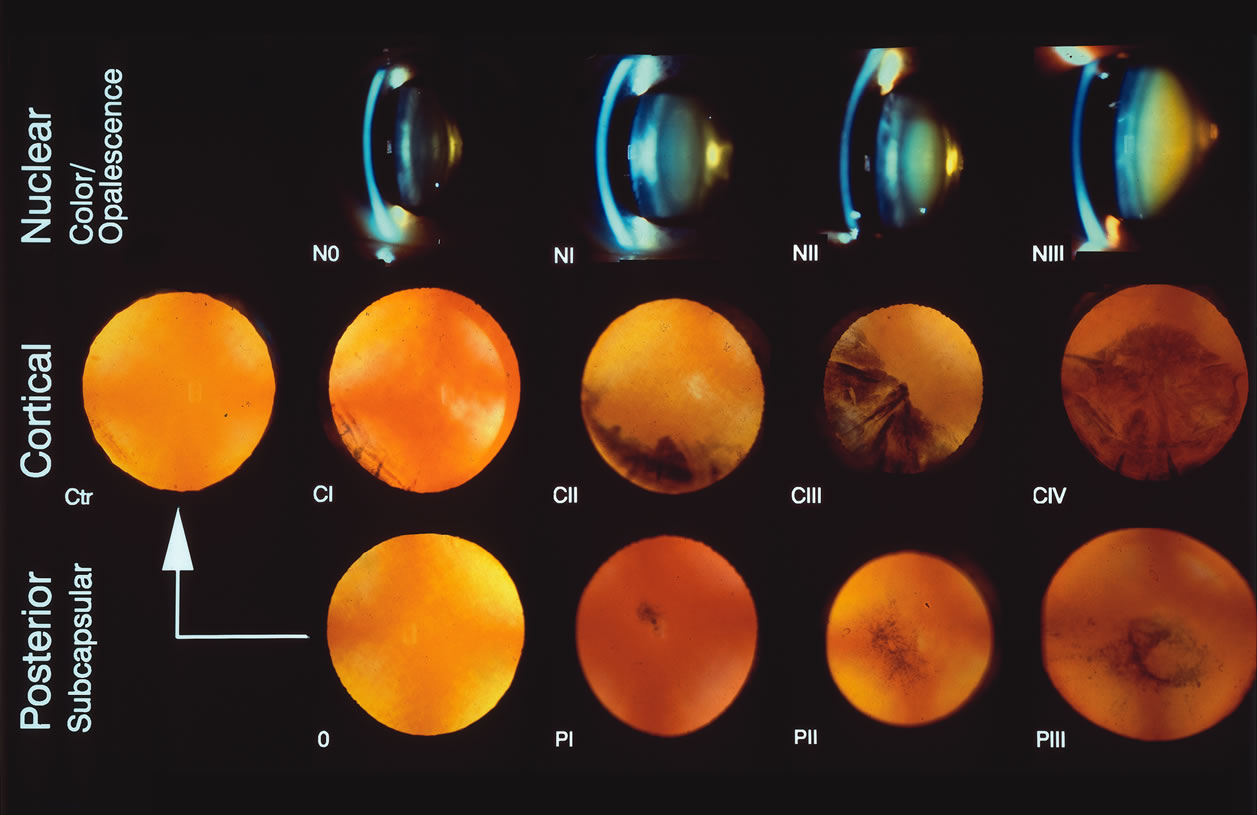 Fig. 7. The Lens Opacity Classification System II (LOCS II) photographic
grading standards. N = Nuclear photographs. Stage 0 = normal; I–III = various stages of nuclear cataract. For
nuclear opalescence, the average opalescence across the entire nuclear
region is used. An opalescence that is less than or equal to Photographic
Standard 0 = grade 0; if the opalescence is less than or
equal to Standard I, the grade is 1, and so on. For Color Grading of the
nucleus, only the N2 standard is used. (<N2 for color=0, equal
to N2 in color=1, and N2 for color = 2) C = Cortical
photographs. 0-Trace (Tr) = normal; I–IV = various steps of cortical cataract (roughly
CII
  ¼, CIII ¼, CIII  ½, CIV ½, CIV  ¾. CV > ¾). P = Posterior subcapsular photographs. 0 = normal; I–III = various stages of posterior
subcapsular cataracts (Chylack LT, Leske MC, McCarthy D, et
al: Lens opacities classification system II [LOCS II]. Arch
Ophthalmol 107:991, 1989. Copyright 1989, American Medical Association
with permission.) ¾. CV > ¾). P = Posterior subcapsular photographs. 0 = normal; I–III = various stages of posterior
subcapsular cataracts (Chylack LT, Leske MC, McCarthy D, et
al: Lens opacities classification system II [LOCS II]. Arch
Ophthalmol 107:991, 1989. Copyright 1989, American Medical Association
with permission.)
|
The lens nucleus can be divided into embryonic, fetal, infantile, and adult. The
embryonic nucleus is a clear central zone found between two
cotyledons that make up the fetal nucleus. These cotyledons are similar
to mirror halves of a peanut. The infantile and adult nuclear zones
lie over this. The sutures classically described as y-shaped are
points of convergence of the anterior and posterior tips of the lens
fibers and may vary in shape.44–45 Recent research suggests that abnormalities in suture shape, which reflect
abnormalities in lens fiber development and/or maturation, may signify
a predisposition to the development of cataracts later in life.46 The nucleus increases in thickness and density with increasing age. The
lens cortex lies between the nucleus and the capsule and varies in thickness. It
is usually clear although some isolated dots may be present
normally. The lens capsule is thicker in the front than in the back
and is the basement membrane of the lens epithelium isolating the lens
from the rest of the eye.46 Direct focal illumination using the narrow beam is useful not only in studying
the anatomy of the lens but also in examining minute opacities
to localize their position and estimate their size. Nuclear cataracts
tend to scatter light so that narrowing the beam prevents the washout
effect and allows examination of details as well as enhances patient
comfort. The Scheimpflug camera (see below) was developed to
increase the depth of focus of images obtained with the slit lamp (Figs. 5 and 6) and is ideal for documenting slit images of the lens, and especially
nuclear cataracts.47–48 It uses a fixed narrow beam and obtains reproducible images in which the
whole-lens thickness is in focus. These images can be examined
by densitometry for statistical comparison with other images of the
same patient taken over time to document and track changes. The broad beam is useful for examining cortical cataracts especially spokes
and water clefts (Fig. 2), which tend to be large and irregular. It is also useful in posterior
subcapsular cataracts, particularly in the early stages, which can
be detected by irregular grainy reflection from the otherwise mirror-like
sheen of the posterior capsule. Abnormalities in size and
position of the lens are also assessed by using either broad or narrow
beams. Retroillumination uses the light reflected from the fundus to highlight
opacities. This is very useful in examining cortical and posterior subcapsular
cataracts (Figs. 1, 3, 7, and 8). However, some cortical water clefts and early posterior subcapsular
opacities may not be easily seen with retroillumination if they are
not dense enough to cast shadows or only refract the retroilluminate
light; these can be best seen with the broad beam. Using retroillumination
on nuclear cataracts does not give much information because these
usually do not cast shadows. However, as seen in Figure 2B, a change in the refractive index can be seen toward the center. Usually, the
outline of the nuclear cataract can be seen as a result of a “magnifying
lens” artifact. This is also easily observed during
direct and indirect ophthalmoscopy. Several retroillumination cameras (modified
slit lamps with the slit beam fixed for retroillumination
and depolarizers built in to remove corneal reflex from the image) have
been developed and are being used for documenting cortical
and posterior subcapsular cataracts.49, 50 |
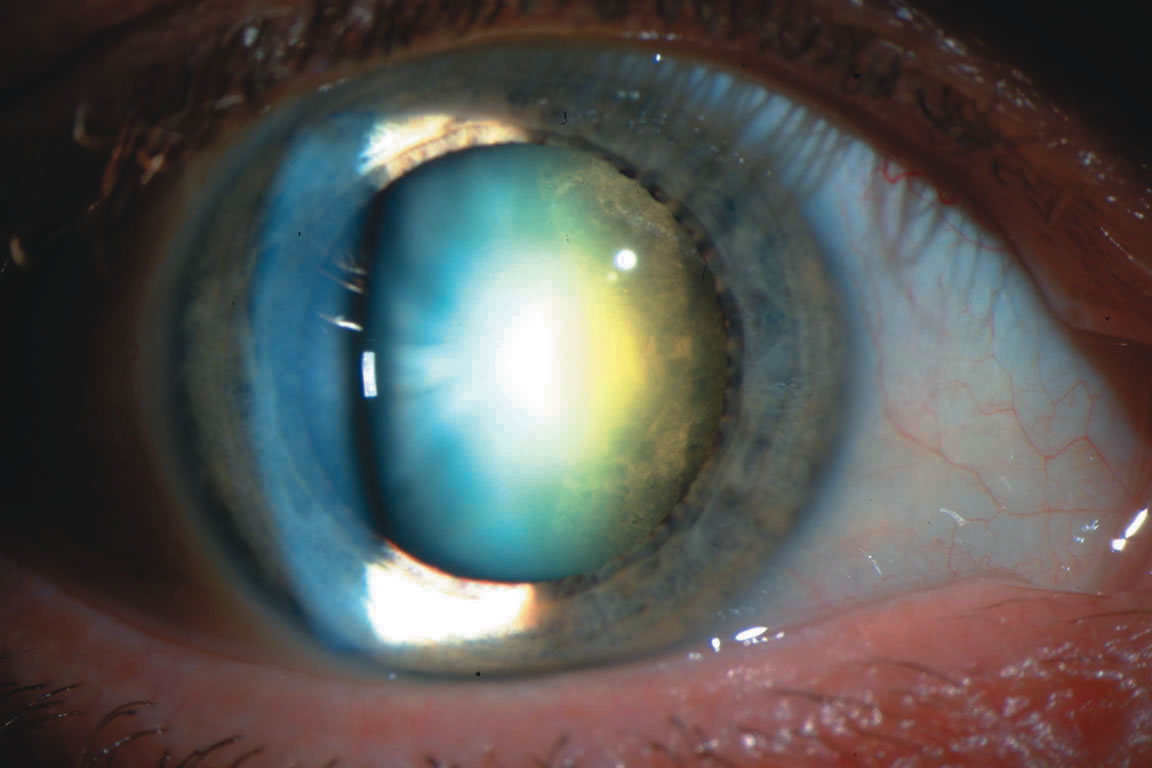
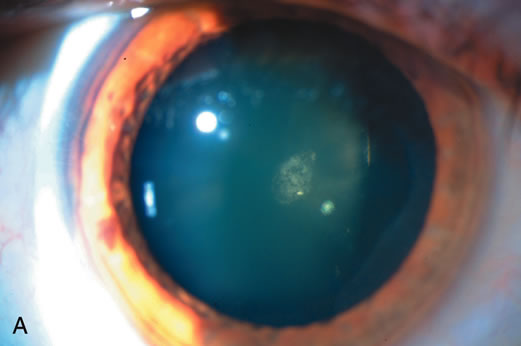 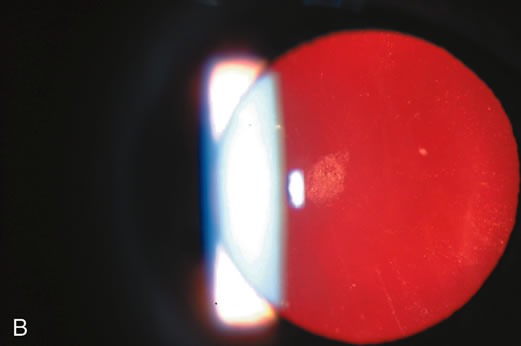 Fig. 3. Posterior subcapsular cataract (PSC) using (A) direct illumination and (B) retroillumination. PSCs usually start centrally and extend toward
the periphery. For this reason, they interfere with visual function, causing
glare disability early.
|
|
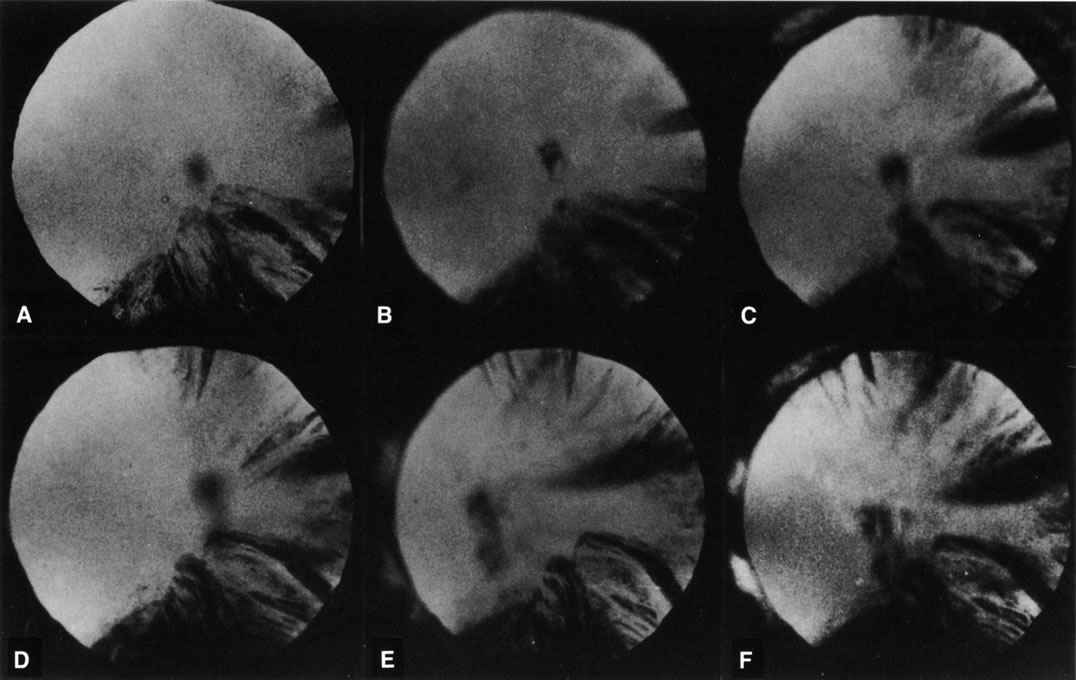 Fig. 8. Follow-up retroillumination photographs of an eye with a cortical
cataract, obtained at various intervals. A. First visit (1-21-87); B. 1 year later (1-27-88); C. 22 months later (11-14-88); D. 28 months later (12-4-89); E. 35 months later; F. 41 months later (6-18-90). With such photographs
one may be able to plot the progression rate of a cortical cataract, and
aid in performing longitudinal studies. Note the central opacity, which
is out of focus and represents a small posterior subcapsular
cataract.
|
The surfaces of the anterior and posterior capsule may be studied using
specular reflection. A bright reflex or shagreen is usually seen as the
beam is moved from side to side across the surface of the lens. When
examining the lens epithelium, for example, this can occur when the
observer focuses on the lens surface and the angle of incidence of the
beam is equal to the angle of reflection. The clinical specular microscope
developed for the corneal endothelium has also been especially adapted
for study of the lens epithelium.41,42 In summary, slit-lamp biomicroscopy is the most useful method for
clinically detecting and localizing lens opacities, determining their
extent and density, and monitoring changes over time. SLIT-LAMP PHOTOGRAPHY OF THE LENS AND GRADING OF CATARACTS Slit-lamp photography has been used to document anterior eye segment
disorders, including abnormalities and opacities in the lens, since
camera attachments to slit lamps became available. Variables to consider
in its use in the lens include the limited depth of field, the variabilities
in light intensities with the slit beam, limits of magnification
with corresponding limits on the area that can be photographed, limits
in the angle of the slit beam used, and limits imposed by pupil
size. The advent of digital cameras has made lens documentation even
more useful. The examiner can check the image quality while the patient
is still on the slit lamp. Patients and their families are often grateful
to see the lens pathology during the consultation. This facilitates
their active participation and cooperation in any discussion and
decision making, especially if intervention is required. These images
can also be sent electronically to distant tertiary centers for quick
consultations or stored in disks immediately for easy transport as well
as inclusion in a patient's chart. Recently, cataract classification systems have been developed that use
carefully selected slit lamp photographs of cataracts as standards for
comparison with the patient's cataracts. These include the following: the
Lens Opacities Classification System (LOCS) version
I,51 version II (Fig. 7),52 and version III,53 the Wisconsin Cataract Grading system,54 the Wilmer Cataract Grading System system,55 the Oxford Cataract Grading System system,56 and the Age Related Eye Diseases Study (AREDS) Cataract Grading
System.57,58 These systems are similar in that they provide lens photographs or films
showing various severities or grades of cortical, nuclear and posterior
subcapsular cataracts to be used as standards, which a clinician
can then compare to the patient's cataract as seen directly on the
slit lamp. For nuclear cataracts, slit photographs of the lens are used, and
for cortical and posterior subcapsular cataracts, retroillumination
photographs are used. Instructions are provided for the clinical
use of the systems, specifically what borders or cutoff points are to
be used for using each standard image. Figure 7 shows the LOCS II standard photographic plate. Another recently described
system that was designed to be simple and easy to use on the slit
lamp, especially for field cataract assessments, is the World Health Organization
cataract grading system.59 Another way of using these classification schemes is to obtain slit-lamp
photographs of a patient's cataract following a specific
photographic procedure described by the authors of each system. These
photographs can later be read by a reading center or by the clinician, comparing
the patient's photograph with the standards. With the
advent of digital cameras and the possibility of automating most of the
photographic processing of the images, this method may become easier
with time. At present, it is only used in clinical research studies
and is expensive, cumbersome, and impractical for regular clinical use. Modified Slit-Lamp Photography Several instruments have been developed to convert the cataract image into
numbers in a more sophisticated way. These use either 35-mm
film or digital cameras to capture the images, which are then digitized
onto a computer. In nuclear cataracts, densitometric analysis of the
cataract image is then performed to convert the values into optical
density units. In cortical and posterior subcapsular cataracts, the area
occupied by the cataract can be measured in square mm. These values
can then be analyzed statistically. SCHEIMPFLUG CAMERAS. Slit lamps modified along the Scheimpflug principle (Fig. 9)47,48 can obtain lens images with enough depth of focus so that the entire anterior
chamber from the cornea to the posterior capsule of the lens are
in sharp detail (see Figs. 5 and 6). Usually, the slit beam is set at 45 degrees away from the image
plane of the camera, which is focused on the lens parallelepiped (Fig. 9). The available charged-coupled device (CCD) cameras, which
are supplied with computer hardware and software, use a slit
beam with a fixed thickness and level of illumination and obtain images
that are reproducible, easily stored in portable disks, and easily
analyzed using built-in densitometers. The operator can manipulate
the software to designate which area to analyze and the average
density is expressed either in optical density units or gray scale/intensity
values. Among those available currently are the Nidek EAS-1000 camera (Scheimpflug Unit, Nidek Tech, Inc., Pasadena, CA) and
the Oxford Scheimpflug camera (Marcher Enterprises, Hereford, U.K.). Figures 5 and 6 show Scheimpflug images of a normal lens and various types of cataracts
obtained using a Scheimpflug camera, and two ways to analyze these images
to obtain the mean density of various areas within the lens.48,50 Longitudinal studies, such as for following the progression of nuclear
cataracts, can thus be conducted in an objective and masked fashion.48 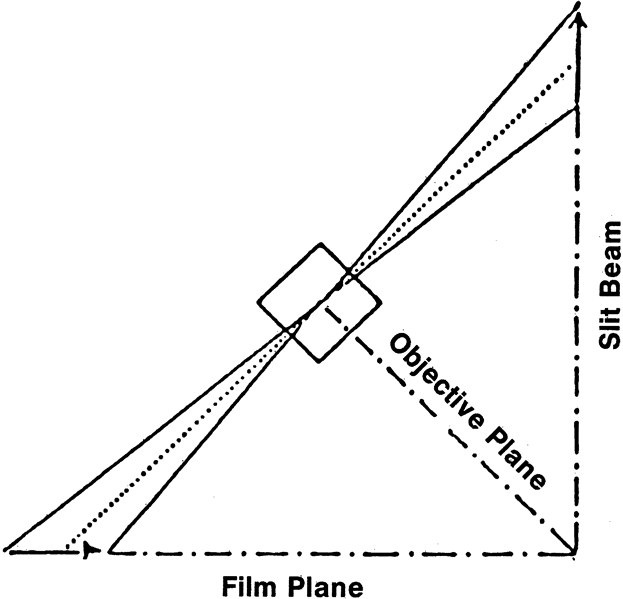 Fig. 9. Scheimpflug principle: When an object plane (slit beam), objective plane (camera lens) and image plane (film plane) intersect, the result is a photograph with a deep depth of focus.47 On most Scheimpflug slit cameras, the slit beam and charged-coupled
device (CCD) camera are at 45 degrees angles to each other, and
the anterior eye segment (cornea to lens posterior capsule) is
in focus in the resultant image. Fig. 9. Scheimpflug principle: When an object plane (slit beam), objective plane (camera lens) and image plane (film plane) intersect, the result is a photograph with a deep depth of focus.47 On most Scheimpflug slit cameras, the slit beam and charged-coupled
device (CCD) camera are at 45 degrees angles to each other, and
the anterior eye segment (cornea to lens posterior capsule) is
in focus in the resultant image.
|
RETROILLUMINATION CAMERAS.
Retroillumination cameras49,50
obtain images of cortical and posterior subcapsular cataracts as shown
in Figures 1B, 7,
and 8. These are useful
for both cross-sectional and longitudinal studies. Various manual or automated
methods have been developed or are being developed for the analysis of
these images to determine the size of opacities. Usually, an artificial
mask with a chosen diameter is used to standardize the area of interest
in the image, and either a percent area or area in square millimeters
is determined. Because of the variability of the background light (the
images are shadows of the cataracts using light that is backlighted from
the retina or optic nerve), densitometry is unreliable. Among the methods
used include computer planimetry, counting boxes, manual and automated
edge detection, and automated area analysis. This method is also being
used to study IOL decentration and posterior capsular opacification after
cataract surgery. Examples of this type of device are the Nidek EAS 1000
retroillumination unit (Nidek, Pasadena, CA), Oxford retroillumination
camera (Marcher Ltd., Hereford, UK), and Topcon CTR (Topcon Medical Systems,
Paramus, NJ).
Other Specialized Slit-Lamp Imaging Systems Various innovators have devised specialized slit-lamp cameras with
improved acquisition and image analysis of cataracts. The Laser Slit
Lamp (Bausch and Lomb Surgical, San Dimas, CA)60 was developed to measure the density of nuclear cataracts. The Sequential
Color Cataract Imaging System,61 provides three lens images for analysis: (1) saggittal sections
of the lens, (2) retroillumination images, and (3) images
of opacities obtained by direct or side illumination. These
devices promise to be useful in clinical studies of the lens and cataracts
but may need further development and standardization. In summary, the use of slit and retroillumination imaging coupled with
a computerized analysis system is presently the state of the art in objectively
measuring cataracts. However, because of the expensive equipment, the
extra time, space, labor, and effort required, and limited practical
clinical use, these systems are presently used mainly in clinical
research settings. The clinical judgment of the ophthalmologist based
on the history and eye examination remains the standard in clinical
practice.
NEW METHODS UNDER DEVELOPMENT New technologies are being applied in the study of cataracts and show great
promise for providing new insights into the cataract problem, as
well as new devices that a clinician can use with cataract patients in
the clinic. In this section, the following devices are discussed: quasielastic
or dynamic light scattering (QELS or DLS), magnetic
resonance imaging (MRI), spectroscopy, wavefront technology, Raman
spectroscopy, autofluorescence, and optical coherence tomography (OCT). These
new noninvasive techniques add to the armamentarium
available to cataract researchers. Steps being taken to develop
these devices for noninvasive clinical use in vivo aim for their possible use on patients for diagnostic purposes in the
near future. Quasielastic or Dynamic Light Scattering The intense scattering of light by a cataract arises from a change in the
interaction and organization of the constituent particles/lens proteins
mediated by lenticular stress. These changes in interaction and organization
are reflected in altered motional dynamics (translational
and rotational diffusion) of the lens proteins in the cytoplasm. The
investigation of lens protein dynamics is being successfully
accomplished by the use of DLS.62 DLS is an established laboratory technique to measure the average size
or size distribution of microscopic particles (3 nm to 3 μm) suspended in a fluid medium in which they undergo random Brownian (or
thermal) motion. Intensity of light scattered by the
particles from a laser beam passing through such a dispersion will fluctuate
in proportion to the Brownian motion of the particles. Because
the size of the particles influences their Brownian motion, analysis of
the fluctuations in scattered light intensity yields a distribution
of the diffusion coefficient(s) of the suspended particles from
which average particle size or particle size distribution can be extracted. In
these experiments, visible light from a laser is focused
into a small scattering volume inside a sample. The scattered light is
collected using a photodetector (photomultiplier tube or an avalanche
photodiode) and is processed via a correlator that yields a
time correlation function (TCF). For dilute dispersions of
spherical particles, the slope of TCF provides a quick and accurate determination
of the particle's translational diffusion coefficient. This
can then be correlated to the size of particles in the solution
via a Stokes-Einstein equation, provided the viscosity of the
suspending fluid, its temperature, and its refractive index are known.62-66 The distribution of particle size obtained from the tissues examined (such
as the lens) can then be plotted (Figs. 10 and 11). 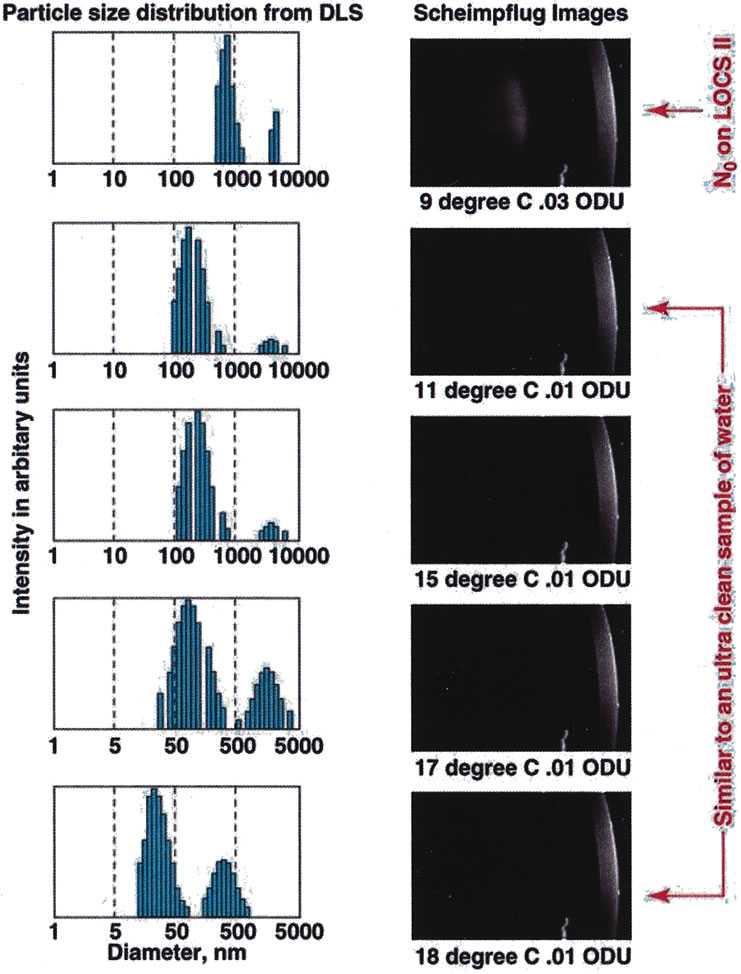 Fig. 10. Data obtained from a cold-induced cataract study using calf eyes. Data
on the left show the size distribution of lens proteins as the
cold cataract appears (as the temperature of the calf lens is lowered) showing
the shift from small to large molecular weight proteins (data
obtained from the dynamic light scattering [DLS] device) versus
Scheimpflug slit-lamp images of the same
calf lens as the temperature is correspondingly lowered and the cold
cataract appears. The DLS device picks up a shift in protein size much
earlier than the Scheimpflug camera shows the appearance of the cataract.66 Fig. 10. Data obtained from a cold-induced cataract study using calf eyes. Data
on the left show the size distribution of lens proteins as the
cold cataract appears (as the temperature of the calf lens is lowered) showing
the shift from small to large molecular weight proteins (data
obtained from the dynamic light scattering [DLS] device) versus
Scheimpflug slit-lamp images of the same
calf lens as the temperature is correspondingly lowered and the cold
cataract appears. The DLS device picks up a shift in protein size much
earlier than the Scheimpflug camera shows the appearance of the cataract.66
|
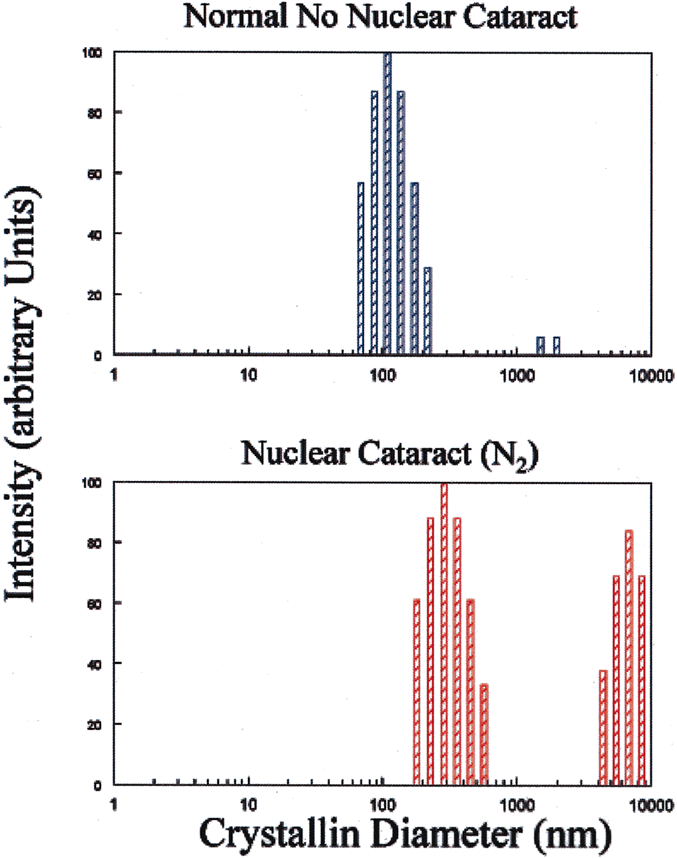 Fig. 11. Comparison between distribution of particles in a normal human lens versus
a nuclear cataract obtained clinically (in vivo) on patients using the NASA-NEI clinical dynamic light (DLS) device.64,66 Fig. 11. Comparison between distribution of particles in a normal human lens versus
a nuclear cataract obtained clinically (in vivo) on patients using the NASA-NEI clinical dynamic light (DLS) device.64,66
|
Clinically, DLS can be used to study cataracts noninvasively at the molecular
level. It is safe and fast to use in early cataract evaluation
because of the very low laser power (50–100 μW) and short data acquisition time (5 seconds). In a cold-induced
cataract model experiment in which the cataract was simultaneously
monitored with both the DLS device and Scheimpflug camera (Fig. 10), the DLS picked up subtle changes in the lens quicker (2–3 orders
of magnitude earlier) than the Scheimpflug camera.66 The DLS measures the Brownian motion of the crystallins inside the lens. The
major proteins that can scatter light in a human eye lens are α-, β-, and γ-crystallins. The α-crystallins are the largest molecules (molecular weight, 106 daltons) and they induce the greatest amount of light scattering
in a DLS measurement. When these protein molecules aggregate, they give
rise to lens opacities. For clinical use, DLS probes can also be integrated with slit-lamp, Scheimpflug, and
autofluorescence instruments because of the current
modular design. Data obtained from patients in clinical studies have
shown good reproducibility.65,66 For clinical purposes, it has been suggested that the log 10 mean particle
size be used as a clinical end point for this device.66 However, more studies are needed to further understand the wealth of data
obtained with this device. Its application in eye research is just
being explored, and much information can be obtained not only on the
lens but also on the cornea,67 vitreous, and retina.68,69 Magnetic Resonance Imaging and Nuclear Magnetic Resonance Spectroscopy
of the Lens As any other human tissue, the lens contains carbon and hydrogen atoms
in which protons spin around their nuclei in random directions. On application
of a magnetic field, these “microscopic magnets” are
aligned in a particular (north-south) direction (higher
energy state). On turning off the magnetic field, the
microscopic magnets return to their original random state (lower
energy state). The frequency of rotation is equal to the energy
of a photon (normally a known radio frequency) that would cause
the nuclei to flip between these two energy levels. This provides
measurements of relaxation rates between different energy states of the
nuclei in relation to the applied excitation photon field. Because they
are dependent on the hydrogen nuclei densities in the tissue, the
relaxation rate information can be translated into images. MRI provides the ability to probe the chemical and metabolic status of
the lens noninvasively. Thus, in response to normal and pathophysiologic
conditions, areas such as lens metabolism, ion concentrations, the
state (bound versus free) of lens water, and metabolite and
macromolecular motional dynamics may be investigated. Valuable biochemical
and biophysical information pertinent to the factors that govern
lens transparency, and conversely, the medical condition of the cataract
can thus be studied. MRI has been used to image the eye but problems have been encountered including
poor resolution; limited access to the surface coil and poor
resultant magnetic signal (because of the location of the eye within
the bony structure of the orbit); motion artifacts (caused
by microsaccadic eye movements, breathing and heartbeat); and
the presence of high susceptibility gradients around the eye. Recently, Lizak
et al.70 used a special technique, magnetization transfer constant enhancement (MTCE), to
enhance the lens image successfully and study diabetic
and galactosemic animal models of cataract, and have applied it
to clinical use. MTCE takes advantage of the magnetic interactions between
water and macromolecule hydrogen atoms. Preliminary clinical studies suggest that cortical lens changes can be
better observed with unenhanced magnetic resonance images, whereas nuclear
lens changes are better observed by the addition of the MTCE preparation
pulse (Fig. 12). MRI, therefore promises to be an imaging method independent of
optical imaging that will allow clinicians to monitor metabolic processes
in the lens.70 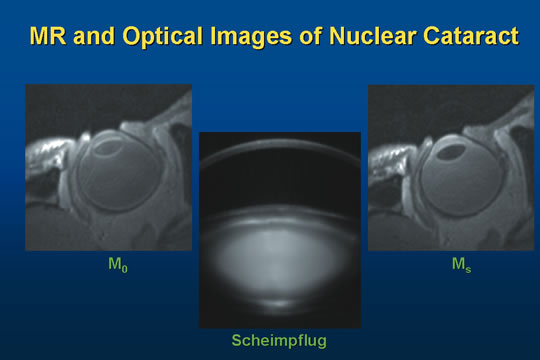 Fig. 12. Sagittal section images of a nuclear cataract. M0: Magnetic resonance image (MRI) of a patient's eye with
a nuclear cataract, taken in vivo and noninvasively. Scheimpflug: Image of the same nuclear cataract (LOCS II nuclear opalescence
grade 2) taken using a Zeiss Scheimpflug slit lamp camera (optical/digital). Ms: MRI image of the same eye with magnetic transfer contrast (MTC) enhancement (see
text). Fig. 12. Sagittal section images of a nuclear cataract. M0: Magnetic resonance image (MRI) of a patient's eye with
a nuclear cataract, taken in vivo and noninvasively. Scheimpflug: Image of the same nuclear cataract (LOCS II nuclear opalescence
grade 2) taken using a Zeiss Scheimpflug slit lamp camera (optical/digital). Ms: MRI image of the same eye with magnetic transfer contrast (MTC) enhancement (see
text).
|
13C nuclear magnetic resonance (NMR) spectroscopy of the intact
lens, on the other hand, has provided information about the production, turnover, and
inhibition of sorbitol by aldose reductase inhibitors. Proton
NMR spectroscopy of 13C-labeled metabolites offers the ability to monitor the reactivation
and dynamics of the hexose monophosphate shunt (HMPS), a
pathway important for the maintenance of the lens redox state, in real
time and noninvasively.7131P NMR spectroscopy allows the monitoring of the phosphorus-containing
metabolites, thereby permitting the real-time assessment
of lens tissue metabolic response to pathophysiologic conditions. Important
metabolites, such as adenosine triphosphate, phosphomonoesters, and
phosphodiesters may be monitored. Furthermore, intralenticular pH
may be measured. However, no clear correlation between phosphorus metabolite
levels and lens clarity has been established to date, despite numerous
NMR and classic biochemical studies. This lack of correlation
suggests the importance of biophysical investigations aimed at the interaction
behavior and organization of the constituent lens proteins in
the cytoplasm, the macromolecular entities responsible for light scattering
associated with cataract.72 NMR spectroscopy may be viewed as an important adjunct to the better established
laser light scattering studies of the lens, and has remained
mainly a laboratory, rather than a clinical, method of studying the human
lens.72 Wavefront Technology Image degradation in the macula because of cataract may not only be caused
by light scattering but also by optical aberrations. As discussed
above (see “Visual Acuity/Function Tests”), several
devices such as the Oqual and resolution test target test have been
devised as simple ways to test for the effect of optical degradation
in the retina. A new technology using wavefront analysis to study optical aberrations
of the eye and in particular the cornea to enhance the results of refractive
surgery in patients has also been used on the lens. Kuroda et al.,17 using the Hartmann-Shack (H-S) Aberrometer (Topcon
Corp., Tokyo, Japan), found that ocular total higher order
optical aberration in eyes with a cortical or nuclear cataracts was
significantly higher than in normal subjects. Corneal total high-order
optical aberration in eyes with mild cortical or nuclear cataracts
did not differ from normal subjects. This suggests that high-order
optical aberration increases in eyes with cataract because
of the local refractive change in the lens. Another finding was that the
polarity of spherical aberration was different between nuclear and
cortical cataracts. In nuclear cataract, the polarity is always negative, suggesting
a delay of the light wavefront occurs when the ray travels
inside the hard nucleus with increased refractive index. In contrast, in
cortical cataract, the polarity was always positive. These findings suggest that in mild cortical and nuclear cataracts, not
only light scattering but also optical aberrations in the lens contribute
to loss of visual function as measured by loss of contrast sensitivity.17 Thus, this new technique may be useful in studying the total effect of
early cataracts on visual function, and explain some patient complaints
such as monocular diplopia, in the presence of mild lens changes. Raman Spectroscopy Raman spectroscopy is routinely used as an analytical tool in chemistry
laboratories. It is a light-scattering technique based on the
Raman effect, which was discovered in 1928. The light (or photons) impinging
on a molecule interacts in various ways but the final
outcome always results in the scattering of light. For example, we do
not see light directly. We always see light and objects as a result of
scattered light. Scattering is absorbance of incident light used in
exciting the atom and reradiation of this light. The Raman scattering
is the result of inelastic collisions in which the scattered photons exchange
energy with the vibrational energy modes of an atom. This frequency
shift (or the difference in frequency of an incident photon
and the scattered photon) points to specific structural information
about a constituent molecule analogous to a certain specific fingerprint
that can identify any species present in the system being investigated. However, the
Raman signal is very weak. Of 106–1010 incident photons only one scattered photon exhibits a Raman shift. Because
of this, the Raman method has remained limited to chemistry research
laboratories since its discovery. Raman spectroscopy has furthered our knowledge of normal aging and pathologic
processes in the lens73 that would not have been possible with other currently available methods. The
structural information it provided includes: SH, S–S, H2O, Trp, Try, Phe, and protein secondary structure. Studies can be carried
out in the intact living lens, thus avoiding any protein disruption
or possible autooxidation of sulfhydryl inherent in studying isolated
protein fractions of lens. Using the optical dissection technique, the
Raman scattered light can be analyzed from any portion of the lens along
the visual axis (or along any axis). This technique monitors
aging changes within the lens so that older nuclear proteins can
be easily compared with those newly synthesized in the cortex. By coupling
with an optical microscope, laser Raman instrumentation has been
transformed into a unique imaging device with excellent spatial resolution. Raman spectroscopy has also been used to demonstrate regional swelling
of the lens in diabetes. In mildly diabetic rats, the overall increase
in lens hydration is hardly detectable. However, regional swelling was
demonstrated by Mizuno et al.74 with this noninvasive technique. This method permitted determination of
water content from the periphery of the lens to the center. The advantage
of this type of noninvasive technique, similar to that of NMR spectroscopy
and QELS, is that it permits analysis of discrete areas of
the lens. Thus, these methods may be helpful in determining the changes
that occur in certain regions of the lens during cataract formation. The
Raman spectra of animal and human lenses has been discussed by Ozaki
in a review article.75 Clinical in vivo use of this technology is limited by the need to use high laser power, and
comprehensive spectral data libraries must first be generated and
established. It then can be used as searchable fingerprints (indices) for
ocular and other diseases. Autofluoresence Spectroscopy Ocular tissues exhibit natural or auto fluorescence (AF) and
it has been found to increase with age in healthy individuals.76 Accumulation of fluorescent proteins in ocular tissue can result from
long-term exposure to the UV or UVA radiation in sunlight. This
accumulation of fluorophores may also be responsible for lens opacification
and can be considered a risk factor for cataract formation. These
fluorophores can be found during cataract formation. In initial stages
these can be characterized by exhibiting fluorescence in the near
ultraviolet and violet regions of the spectrum (340 and 411 nm). However, in
advanced stages of cataract development an increase in
the intensity of the long-wave fluorescence of the lipids in
the blue-green region (430/480 nm) occurs.77 AF from transparent (noncataractous) lenses exhibits a strong
correlation as a function of age (Fig. 13). In this figure, the increased level of fluorescence from the lens
can be attributed to oxidative stress or absorbance of UV light as
a function of age. Because the cornea does not absorb UV, its AF level
remains constant. However, both diabetic lens and cornea show significantly
increased AF levels. 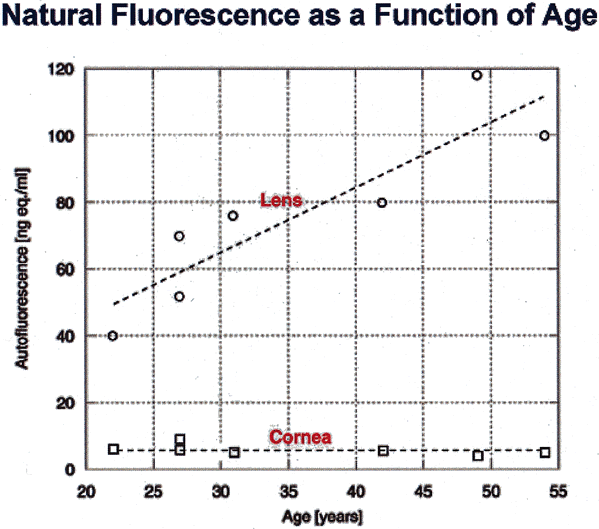 Fig. 13. Natural autofluorescence of the eye with aging. Fig. 13. Natural autofluorescence of the eye with aging.
|
Studies of the AF properties of the ocular media have shown that ocular
AF can be related to metabolic disorders.78,79 Thus prepathologic states can easily be studied by measuring AF intensity
from the corneal tissue because it is readily accessible (no
dilation needed) and its intensity is not age-dependent. Corneal
AF is mainly the result of the pyridine nucleotides and flavoproteins
found in the corneal epithelium and the endothelium. The accumulation
of these fluorophores can be related to the severity or duration
of some pathologies and therefore the corneal AF can be exploited as
a diagnostic index of this class of disorders. In particular, an increase
in the corneal AF has been observed in the presence of early stage
diabetic retinopathy (DR)80 by using a novel instrument.81 Optical Coherence Tomography OCT is a near-infrared optical ranging imaging technique. The images
obtained by OCT are of much higher resolution (approximately 1–15 μm) compared to images obtained by low-frequency ultrasound, pulse-echo
imaging (approximately 100 μm). The two-dimensional image of optically reflecting and backscattering
from tissue microstructure in OCT is constructed using low-coherence
interferometry. Photons that have scattered multiple
times (multiple scattering) are rejected by coherent detection
because it takes advantage of short temporal coherence of broadband
light source, e.g., light-emitting diodes (LEDs). The
interferometric system selects photons that have traveled a specific
distance in the tissue. The beam scans turn the one-dimensional
depth profile into a two-dimensional image. The images are
similar to that of histologic sectioning. At present this technique is
being used to obtain retinal images. High-resolution OCT images
provide detection of subsurface retinal changes that are not seen by
ophthalmologists in conventional settings. This is important in monitoring
injury to the optic nerve from glaucoma. Most biologic tissues
highly scatter in the visible and near-infrared range. In ophthalmology, OCT represents a novel, noninvasive, noncontact transpupillary
tool, which can image the fine anatomic structures within the
eye, structures too fine to be adequately assessed by conventional techniques. The
appearance of a variety of anterior/posterior segment pathologies
can be diagnosed using OCT including cataract, glaucoma, diabetic
retinopathy, macular holes, epiretinal membranes, cystoid macular
edema, central serous choroidopathy, and optic disk pits.82–85 Although OCT has been shown to image cataracts, it has not yet been used
extensively in this area. |




 ¼, CIII


