|
|
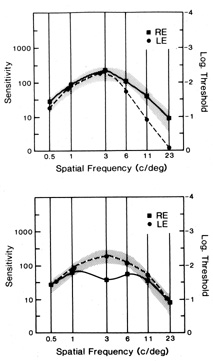
| Fig. 3. Graphs of contrast sensitivity (ordinate) versus spatial frequency (abscissa). The normal range is shaded in gray. In the upper plot there is gradual fall-off of sensitivity at high spatial frequencies resulting from optical blur in the left eye. The lower plot illustrates selective loss of midspatial frequencies in a patient with optic neuritis of the right eye. (Courtesy Nicollet Co., Chicago.) |