|
|
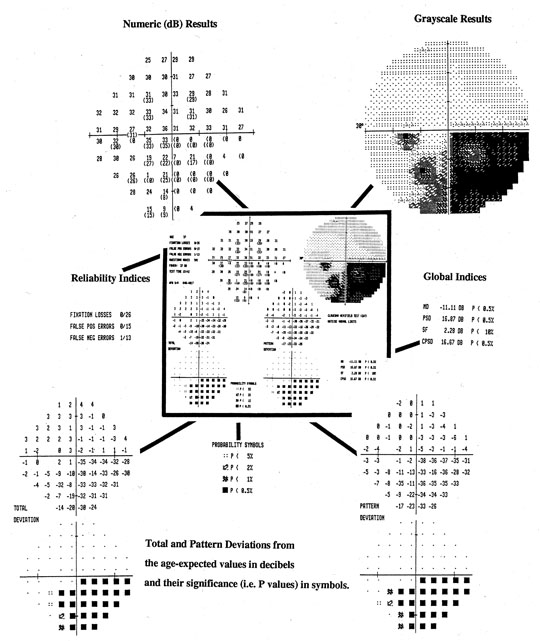
| Fig. 21. Central 30-2 test using full-threshold strategy with STATPAC. Center (darkly outlined): Single field printout from Humphrey Visual Field Analyzer of data from the left eye of a patient with an inferior arcuate scotoma and a dense nasal step. Key components of the printout are shown, enlarged, around central display. Top left: Numeric threshold sensitivity values in dB (“raw data”). Top right: Gray-scale plot. Center left: Reliability indices. Lower Left: Topographic display of total deviation at each test point. Numeric values, representing differences between patient's measures and those of age-matched subjects with normal vision are shown, above, with corresponding probability plots, below. Lower right: Topographic display of pattern deviation at each test point. Above, numeric values (see text); Below, corresponding probability plots. Bottom center: Probability symbols defined; p values represent the probability that individual deviation from normal value can occur in a normal subject. Right center: Global Indices (see text). |