
|
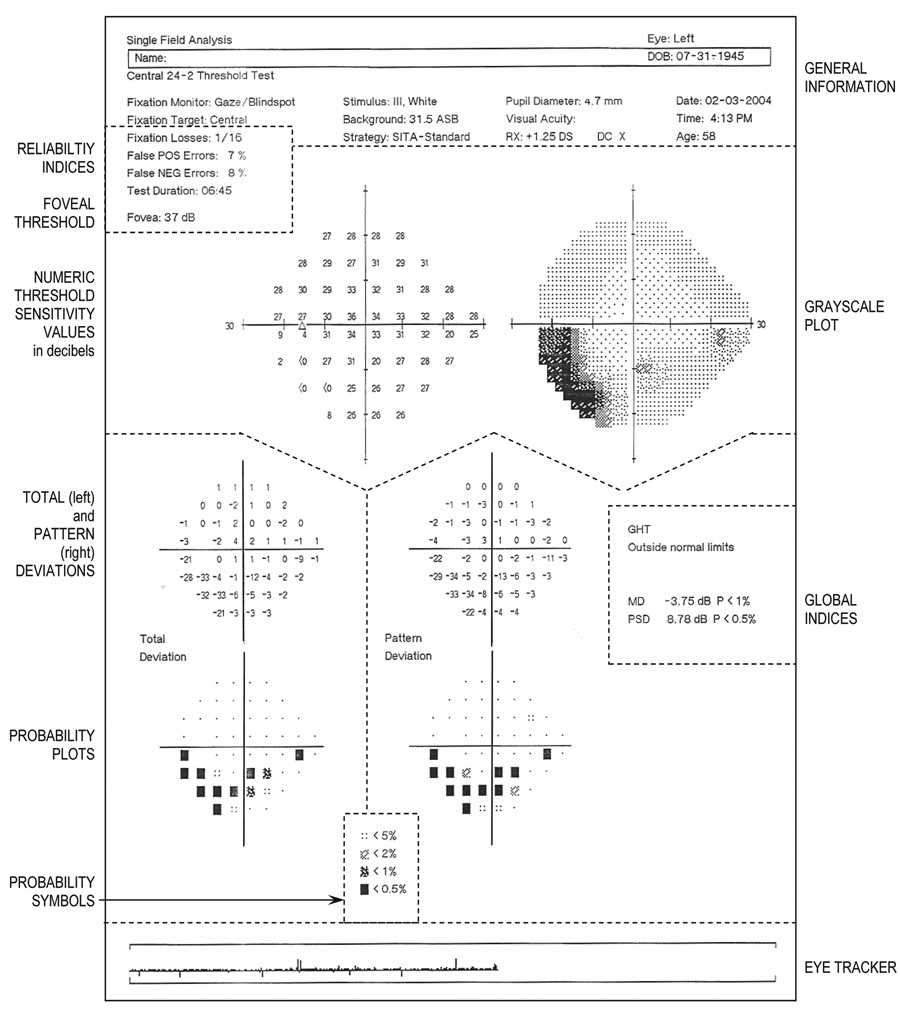
| Fig. 22. Central 24-2 threshold test using SITA-standard strategy. Single field printout from Humphrey Visual Field Analyzer from a 58-year-old patient with an inferior arcuate scotoma, denser temporally. Key sections are identified by legends alongside the printout and are separated by dotted lines that have been added. Top: General information about the patient and the testing procedure. Just below, on the left are the Reliability Indices and foveal threshold. Upper half: The large graphic display shows, on the left, the numeric threshold sensitivity values in decibels (raw data) and, on the right, the gray-scale plot. Lower half: Total deviation (left) and pattern deviation (right) at each tested point. Numeric values are displayed topographically, above, with corresponding probability plots, below. Bottom center: Significance level of the shaded probability symbols (used in probability plots) are defined. Extreme right middle: Global indices (MD and PSD and their respective probability values). |