|
|
|
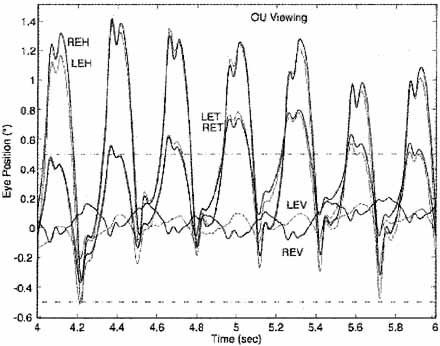
Fig. 13 Tri-planar
recording of a typical IN with a PPFS waveform showing the relative
size and phase relationship of the subclinical see-saw component of IN to
the more prominent horizontal and torsional components. Note the correspondence
of the foveation periods in all planes. In this and Figures
18 and 19 |