
|
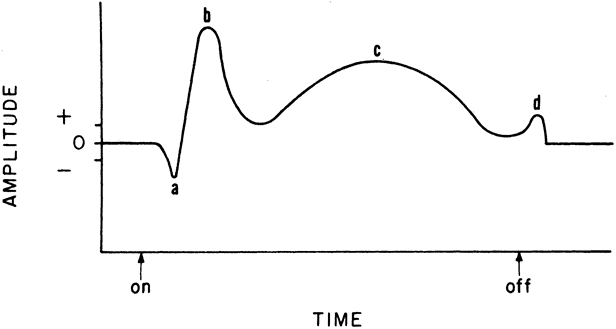
| Fig. 3. Electroretinogram (ERG) recorded with a long-duration flash in the dark. The schematic shows a, b, c, and d waves of the ERG as they would be recorded with a contact lens electrode. The light stimulus is turned on and off as indicated by the arrows. |