
|
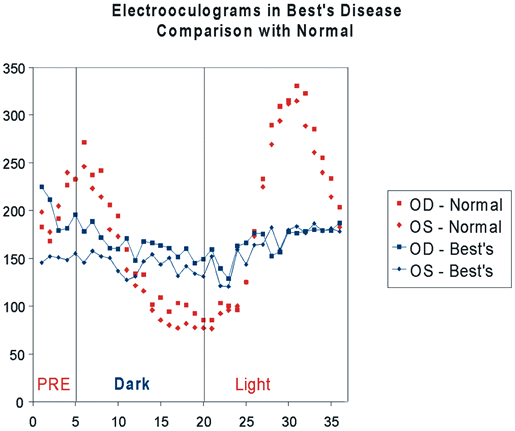
| Fig. 14. Electro-oculographic changes in Best's disease. Vertical axis shows the amplitude response in millivolts. Time is shown on the horizontal axis in minutes. Test begins with a five-minute preadaptation (PRE) period during which the subject is light adapted. Then the subject sits in darkness. Lights are turned on after 15 minutes. The normal decrease and increase in dark and light adaptation, respectively, are not seen, resulting in ratios close to 1 for each eye in the subject with Best's disease. The normal subject has an Arden ratio greater than 2.00 in each eye. (OD, right eye; OS, left eye) |