|
|
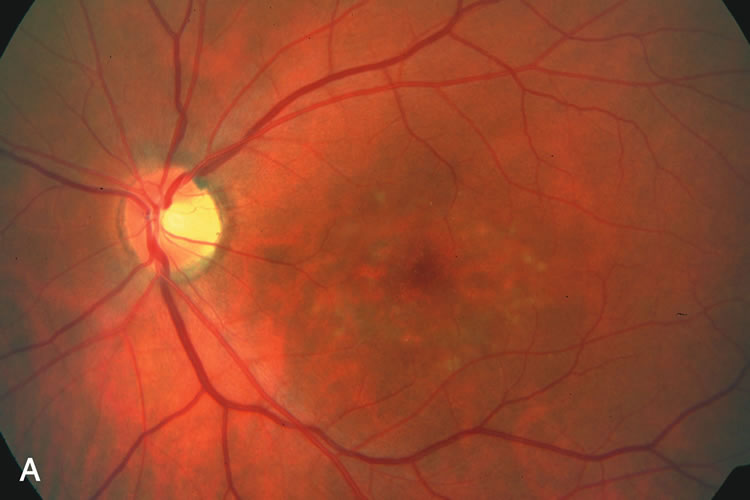
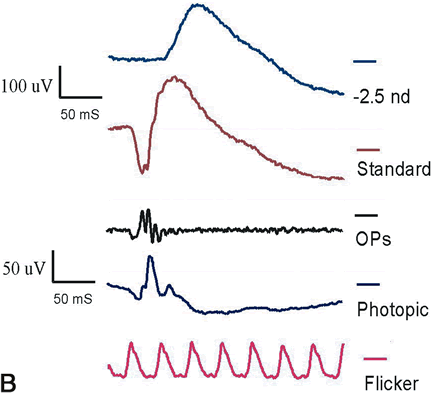
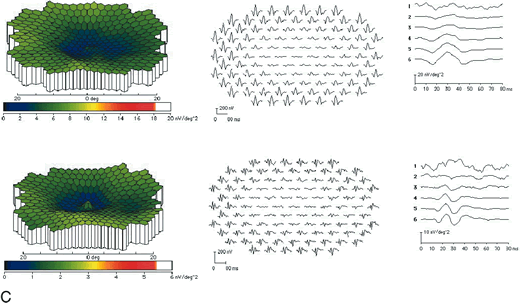
| Fig. 23. Multifocal electroretinogram (mfERG) from a patient with Stargardt's disease. A. Fundus. B. Standard electroretinograms (ERGs), which are within normal limits. C. mfERG. First-order kernels are presented above and second-order kernels presented below. The left column presents pseudocolor representations, the middle column represents individual tracings, and the right column presents average responses from rings that begin in the center for the top waveform and go to the periphery in the bottom tracing. The central ERGs are smaller in amplitude than those in the periphery in the raw signals. This is presented dramatically in the pseudocolor map and the raw waveforms. Averages of concentric rings indicate that the more central rings (two upper tracings) are smaller than the more-peripheral rings (four lower tracings). (OPs, oscillatory potentials) |