
|
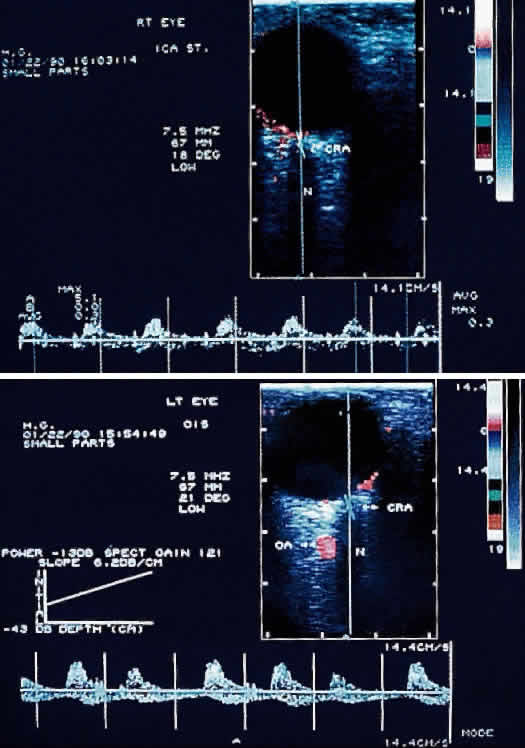
| Fig. 8. Color Doppler imaging study of the central retinal artery in an eye with ocular ischemic syndrome (left). Areas in red superimposed on the B-scan image depict blood flow moving toward the transducer, mostly representing arterial flow. Areas in blue depict flow, mostly venous, away from the transducer. Notice the reduced systolic peaks of the time-velocity waveform (graph below the B-scan image) in contrast to the normal pattern of the uninvolved contralateral eye (right). (Ho AC, Lieb WE, Flaharty PM et al: Color Doppler imaging of the ocular ischemic syndrome. Ophthalmology 99:1453, 1992) |