
|
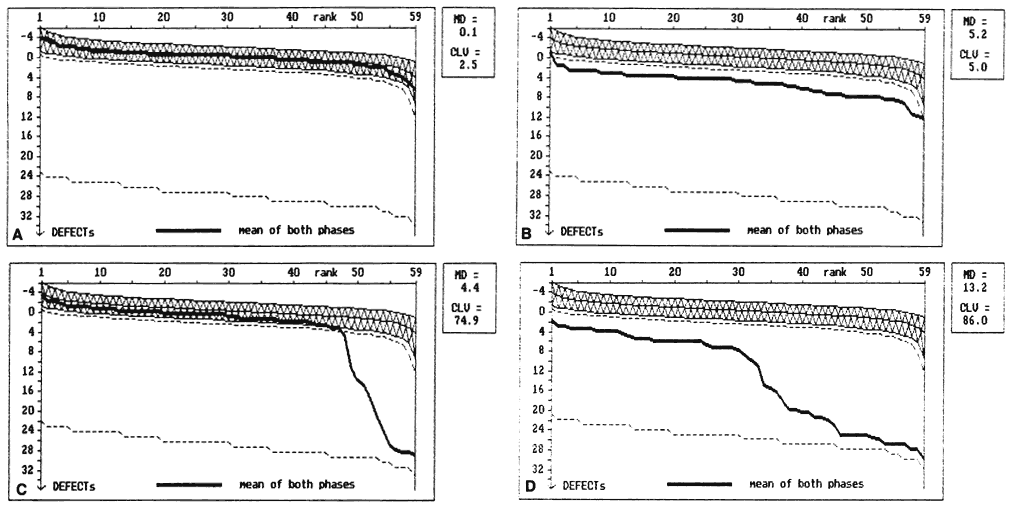
| Fig. 18. Bebie curves. Bebie, or cumulative defect, curves are useful in detecting diffuse depression of the visual field. The curve is a graphic ranking of the defect (the difference between the measured threshold and the age-corrected normal threshold) for each point in the visual field. The x axis represents the rank of the defect from smallest (left side) to largest (right side). The y axis represents the magnitude of the defect. The normal range, between the 5th and 95th percentiles, is shaded. A. A normal Bebie curve. The curve lies completely within the normal shaded area. B. The Bebie curve of a patient with diffuse damage. The Bebie curve is shifted inferiorly, but parallels the normal range. C. The Bebie curve of a patient with purely localized damage. Most of the curve falls within the normal range; however, a sharp decline is measurable at the higher ranks. D. An example of combined localized and diffuse damage. The entire curve is depressed below normal range. The left side parallels the normal range and represents the diffuse loss. The decline on the right side represents the superimposed localized damage. (Courtesy of Balwantray C. Chauhan, PhD.). |