
|
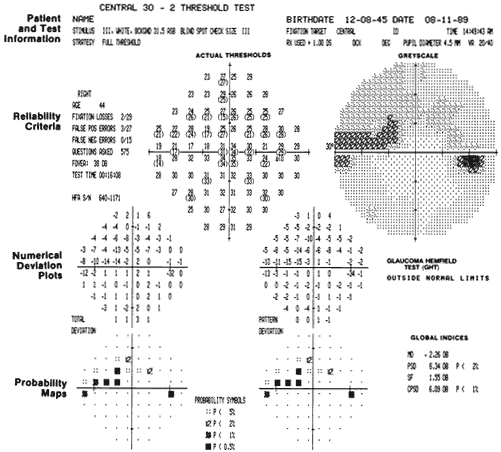
| Fig. 34. Statpac printout for Humphrey program 30-2. The actual threshold plot and the corresponding gray scale are shown at the top. Below on the left is the total deviation plot with its probability map. Below on the right is the pattern deviation plot with its probability map. The total deviation maps display all defects from age-corrected normal values. The pattern deviation maps highlight localized loss. The results of the glaucoma hemifield test are shown below the gray scale. Patient and test information, reliability criteria, and global indices are labeled. The probability symbols are similar in the total and pattern deviation maps indicating localized loss. Note that the normal mean deviation and abnormal corrected pattern standard deviation (p < 1%) are also consistent with a purely localized defect. |