
|
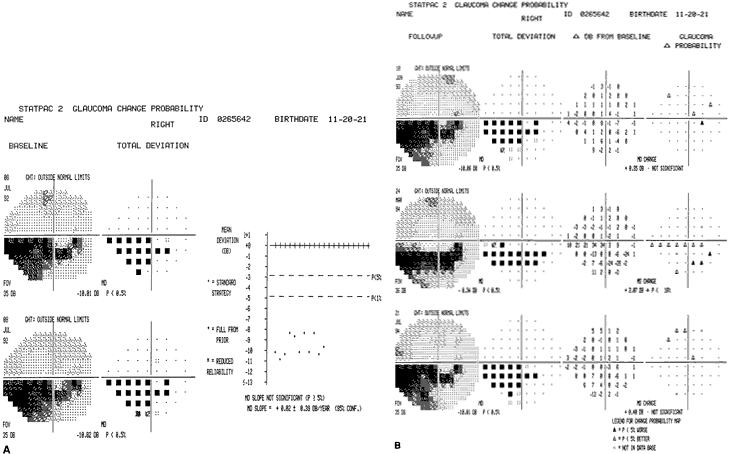
| Fig. 39. Glaucoma Statpac 2 change probability printouts. A. Baseline examinations. Two tests are averaged to obtain a baseline. B. Follow-up examinations. Subsequent tests are compared with the baseline at each point in the visual field. Using information about the normal variability of threshold measurements in patients whose glaucoma is stable, the test evaluates whether each point has changed significantly from the baseline. The results are shown in the plots on the right side of the printout. Closed triangles represent significant depression of the threshold, and open triangles represent significant improvements. An x indicates a value that is too depressed to evaluate. In this example, there is no significant change in the inferior defect. |