Chapter 53
Patterns of Blindness
LALIT DANDONA and ALLEN FOSTER
Main Menu   Table Of Contents

Search

VISION 2020—THE RIGHT TO SIGHT
DEFINITION OF BLINDNESS
BLINDNESS BY AGE
BLINDNESS BY GENDER
BLINDNESS BY RACE
BLINDNESS BY GEOGRAPHIC DISTRIBUTION
BLINDNESS AND EYECARE SERVICES
REFERENCES

VISION 2020—THE RIGHT TO SIGHT
There were an estimated 45 million blind persons in the world in the year 1996,1 with the World Health Organization (WHO) definition of blindness as visual acuity less than 20/400 in the better eye.2 This number is likely to be approximately 50 million in the year 2000.3 To reduce the increasing blindness worldwide, Vision 2020—The Right to Sight, a global initiative to eliminate avoidable blindness, was launched in 1999.1,3–5 This initiative aims to build the momentum and bring together the resources needed to eliminate avoidable blindness around the world by the year 2020. To achieve its goal, Vision 2020 is expected to develop into an effective partnership among professionals, WHO and other United Nations agencies, Ministries of Health, nongovernment developmental organizations, the corporate sector, and the affected communities.3 The three essential elements of Vision 2020 are (1) strategies for disease control, (2) human resource development, and (3) infrastructure and appropriate technology development.1 In this initiative to eliminate avoidable blindness worldwide, the causes of blindness that have been identified as high priority currently for elimination are cataract, trachoma, onchocerciasis, childhood blindness, and refractive errors.1
Back to Top
DEFINITION OF BLINDNESS
An important issue in any discussion of blindness is its definition. The elements of this definition that need attention are (1) the level of distance visual acuity, (2) the presenting or best-corrected visual acuity, and (3) the visual field constriction. The two levels of distance visual acuity that have been used often worldwide to define blindness are less than 20/400 or less than 20/200 in the better eye. In the United States, legal blindness is defined as distance visual acuity of 20/200 or less. Regarding the use of presenting or best-corrected visual acuity to define blindness, it is being increasingly realized that the previous common use of best-corrected acuity to define blindness, which also is recommended by the International Classification of Diseases,2 has resulted in overlooking refractive error as a significant cause of blindness and visual impairment.6 Recent population-based studies have therefore assessed presenting visual acuity followed by refraction and best-corrected acuity,7–11 thereby allowing assessment of blindness and visual impairment due to refractive error as well as other causes. Because visual field constriction causes functional impairment, its inclusion in the definition of blindness is recommended by the International Classification of Diseases.2 However, because of the difficulty in assessing visual fields in large population-based surveys, many surveys have not included visual field constriction in the definition of blindness. Conversely, some recent population-based studies have emphasized inclusion of visual field constriction to less than 10 or 20 degrees of fixation in the definition of blindness.8,11,12 The variations in the definition of blindness have to be taken into account when comparing data from different studies. This chapter discusses the patterns of blindness worldwide by age, gender, race, and geographic distribution using data published during the past decade.
Back to Top
BLINDNESS BY AGE

PREVALENCE

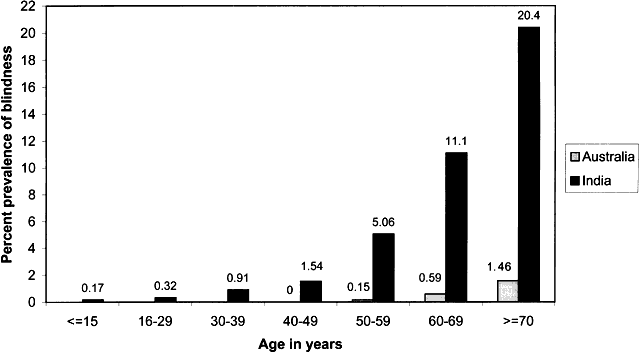
Increase in the prevalence of blindness with increasing age has been reported in population-basedstudies from Africa,13–16 Asia,17–20 Australia,8,21,22 Europe,23 North America,7,24 and for the global data considered together.25 The age-specific rates of blindness are considerably higher in developing countries13–20 than in the developed countries.7,8,21–24 For example, blindness defined as presenting distance visual acuity less than 20/200 or visual field less than 20 degrees in the better eye was present in 0.43%, 4.56%, and 15% of those younger than 40 years, 40 to 64 years, and 65 years of age or older, respectively, in the population of the Indian state of Andhra Pradesh.20 These rates are 13 to 30 times higher than the 0.15% and 1.15% prevalence of blindness, defined as presenting distance visual acuity less than 20/200 or visual field less than 10 degrees in the better eye, reported from Victoria, Australia, in the 40 to 64 years and 65 years or older age groups, respectively22 (Fig. 1).

Fig. 1. Comparison of age-specific rates of blindness in Australia and India. Data shown are for blindness defined as presenting distance visual acuity less than 20/200 or visual field less than 10 degrees in the better eye in the Australian study, and presenting distance visual acuity less than 20/200 or visual field less than 20 degrees in the better eye in the Indian study. Blindness in those younger than 40 years of age was not assessed in the Australian study. (Data from Dandona and associates20 and VanNewkirk and associates.22)

The age distribution of the populations in the developing countries is pyramidal compared with the tubular distribution in the developed countries.26 Hence, because of high birth and mortality rates in developing countries, there are more young people in their populations, whereas the proportion of the population is more evenly distributed among the different age groups in the developed countries. For example, it is estimated that in the year 2000, the distribution of the population of India younger than 30 years of age, between 30 and 49 years, and 50 years of age or older was 61%, 25%, and 14%, respectively, whereas the corresponding distribution for Australia was 42%, 30%, and 28%, respectively.26 Therefore, even with a lower prevalence of blindness in children and young adults than in the elderly, the overall burden of blindness in children and young adults is considerable in the developing countries.11,20,27

CAUSES

The causes of blindness differ by age, and in the different age groups, the causes differ between the developing and developed countries. Among children, the predominant causes of blindness in the developing countries are refractive error, vitamin A deficiency, congenital eye anomalies, and retinal dystrophies,20,27–29 whereas in developed countries, blindness in children is relatively rare with hereditary causes accounting for a large proportion.29,30 Retinopathy of prematurity is becoming a more common cause of childhood blindness in middle-income countries because of better survival of premature babies.31

The common causes of blindness in young adults in the developing countries have been reported to be refractive error and corneal opacity due to vitamin A deficiency from childhood, and use of harmful traditional eye medicines or infectious keratitis in India,11,20 and trachoma and onchocerciasis in the endemic areas of Africa.15,32 In middle age, the causes of blindness in the developing countries include the uncorrected causes from earlier age and also cataract,20 whereas in the developed countries, diabetic retinopathy was earlier reported as an important cause.33 However, more recent studies have not found it to be a significant cause of blindness.21–23

Cataract is the most common cause of blindness in the elderly in the developing countries, and glaucoma is an important cause in some parts.13–20,34 Conversely, among the elderly in the developed countries, age-related macular degeneration is the most common cause of blindness and glaucoma is an important cause.21–23,33 Cataract too has been reported as a cause of blindness in some studies from developed countries.23,33

In the developing countries, the magnitude of blindness that manifests in childhood and young adulthood is significant.13,15,16,19,20,32 Even after taking into account the increase in mortality associated with blindness,35 data from India suggest that the number of blind-person-years experienced in the population because of blindness from refractive error and corneal opacity manifesting at a young age is more than because of cataract blindness, which manifests in later life.20 This implies that the socioeconomic burden on society of this blindness manifesting at a young age is huge.

Back to Top
BLINDNESS BY GENDER

PREVALENCE

Studies from the developing13,15,17,20 as well as the developed21,23,24 countries have reported a higher prevalence of blindness in females than in males. A recent meta-analysis of the data on blindness by gender from around the world reported that worldwide, females bear approximately two thirds of the burden of blindness.36 The odds of blindness in females were found to be higher than in males in all parts of the world included in this meta-analysis, 39% higher in Africa, 41% higher in Asia, and 63% higher in developed countries.36 The exception is regions of Africa in which onchocerciasis is endemic, where the prevalence of blindness has been reported to be higher in males as onchocerciasis blindness occurs more often in this gender.32 The higher burden of blindness in females is likely because of a combination of reasons, including their higher life expectancy, leading to more females than males in the elderly age groups; lower utilization of surgery for cataract and trachoma by females in some developing country settings; and other possible biologic or environmental variables.20,26,36,37

CAUSES

The causes of blindness in males and females generally are similar. However, the rate of blindness due to cataract20 and trachoma38 has been reported to be higher in females. The higher cataract blindness in females might be related to their higher life expectancy and their lower uptake of surgical services.20,36 The higher trachoma blindness in females probably is because of a combination of factors related to close contact with infected children and exposure to poor household sanitation in addition to low uptake of surgery.36 On the contrary, males have a higher rate of blindness due to onchocerciasis in areas endemic for this disease.32

Back to Top
BLINDNESS BY RACE

PREVALENCE

It is not easy to distinguish the effect of racial origin on the occurrence of blindness from other factors such as socioeconomic status and the environment, which interact with one another to determine the pattern of blindness in the different ethnic groups. The rates of blindness have been reported to be very high in the populations of Asian-Indian origin20,39 and some of African origin.15,32 The degree to which race itself is responsible for this very high rate of blindness is not clear as data to tease apart the effect of race from environmental factors and utilization of eyecare services are not readily available yet from these parts of the world. In a study of a mixed population in the United States, the rate of blindness in blacks was reported to be considerably higher than in whites,7 but this difference could not be clearly attributed to racial origin per se.40

CAUSES

Some racial groups have higher predilection for certain blinding diseases. For example, populations of Chinese-Mongolian and Asian-Indian origin have been reported to have a high rate of blindness due to primary angle-closure glaucoma,20,34,41 which is likely because of the high prevalence of this disease in these populations and the lack of strategies in place for early detection and treatment.42,43 The blindness rate due to primary open-angle glaucoma has been reported to be higher in some populations of African origin.14,15,33 This is likely because of higher predilection for this disease in this racial group.44–46

Back to Top
BLINDNESS BY GEOGRAPHIC DISTRIBUTION

PREVALENCE

There are wide variations in the prevalence of blindness between different parts of the world. This is because of a mixture of influences, which include variations in environmental factors predisposing to blindness, inherent susceptibility to blinding conditions, socioeconomic status, and availability and utilization of eyecare services. The reported rates of blindness defined with visual acuity less than 20/400 in the better eye for all age groups in the population considered together vary in Africa between 2.2% in the Central African Republic,32 1.7% in Mali,15 1% in South Africa,14 0.85% in Ethiopia,16 and 0.42% recently in The Gambia.47 These rates in the Indian subcontinent have been reported as 1.78% in Pakistan39 and 1.34% in India.20 In other parts of the world, these rates have been reported as 0.43% in China,17 in Eastern Mediterranean region as 0.6% in Lebanon19 and 0.4% in Turkey,18 and in Eastern Europe as 0.49% in Bulgaria.48 Within the developing countries, the blindness rates can vary in different parts of the same country and have been reported to be higher in rural compared with urban areas.17,20,39 In the same area, those belonging to lower socioeconomic strata have been reported to have significantly higher rates of blindness,11,20 with the odds of having blindness almost 10 times higher in the lowest socioeconomic stratum compared with the highest stratum in an Indian population.20 Disadvantaged groups such as refugees also have been reported to have a particularly high prevalence of blindness.49

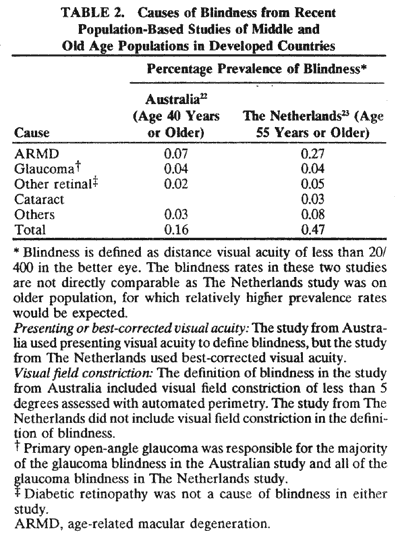
The rates of blindness in the developed countries are much lower and in population-based studies are mostly reported for the middle and old age populations because blindness in the younger age groups is rare. For example, blindness rate with visual acuity less than 20/400 in the better eye has been reported as 0.16% in Australia22 for the 40 years of age or older population and as 0.47% in The Netherlands for the 55 years of age or older population.23 In contrast, blindness defined with the same acuity level has been reported as 4.5% in the 40 years of age or older population in India.20 This is 28 times higher than the rate of blindness in the similar age group in Australia.22 Some underserved communities within the developed countries, however, have relatively high blindness rates, examples of which include an American Appalachian community50 and an Australian Aboriginal population.51

CAUSES

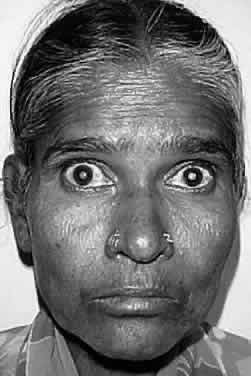
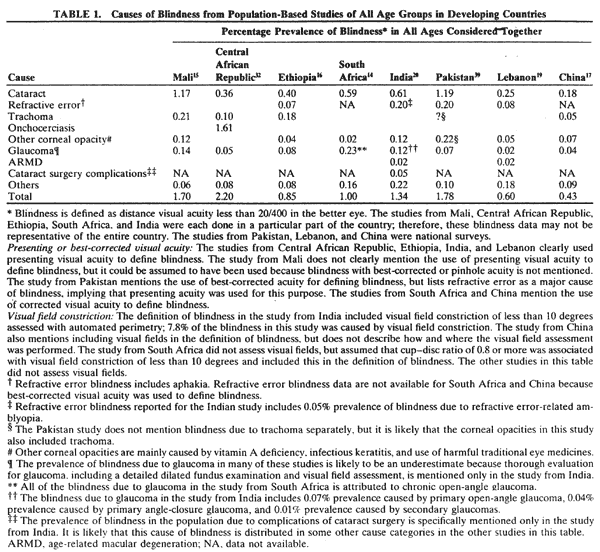
Cataract is the most common cause of blindness in most low-income and middle-income countries (Fig. 2), accounting for approximately half of the blindness (Table 1).13–20,39,47,48 In the studies that have assessed presenting visual acuity, high refractive error is the second most common cause of treatable blindness in some Asian countries, with 11% to 16% of the blindness, defined as presenting acuity less than 20/400 in the better eye, attributed to it.19,20,39 Because blindness due to refractive error usually manifests at an early age (Fig. 3), it has been estimated that the number of blind-person-years experienced due to refractive error blindness in an Indian population is approximately twice as that due to cataract blindness.20 Of all the people blind in the developing countries, 60% to 65% are caused by cataract or refractive error, which is relatively easy to treat. This blindness is currently there because the logistics of providing treatment to those who need it most have not been put into place.

Fig. 2. A typical bilateral dense cataract that often leads to blindness in many developing countries.


Fig. 3. This child from India is blind without spectacles because of high myopia, but he has excellent vision with spectacles.

A recent study from India has reported a high prevalence of 0.28% blindness (visual acuity less than 20/200 in the better eye) in the population 40 years of age or older because of complications resulting from poor-quality cataract surgery.20 This implies that one of every 360 persons 40 years of age or older in this population is blind with this definition from complications of cataract surgery. A high rate of blindness in the population from complications of cataract surgery also has been reported from Saudi Arabia.52 Frequent poor visual outcome after cataract surgery has been reported recently in studies from China, India, and Nepal.53–58 There is a need for more attention to the quality of cataract surgery and postoperative care if this iatrogenic blindness is to be reduced.

In parts of Africa where trachoma is endemic, it has been reported to be the second most common cause of blindness after cataract (see Table 1)15,16 and in some places even the most common cause.59 Trachoma also has been reported to be the leading cause of blindness in an Australian Aboriginal population.51 Onchocerciasis has been reported to be the predominant cause of blindness in some endemic areas of Africa.32 Both these infectious causes of blindness are preventable. The other frequent reasons for corneal blindness in the developing countries include vitamin A deficiency in childhood, infectious keratitis including that caused by measles and ophthalmia neonatorum, and use of harmful traditional eye medicines,20,28,29,59 all of which also are preventable.

Glaucoma has been reported to be a prominent cause of blindness in some parts of Africa14,15 and in India20 (see Table 1). All of the blindness due to glaucoma was attributed to chronic open-angle glaucoma in a South African population,14 whereas one third of all blindness due to glaucoma was attributed to primary angle-closure glaucoma in an Indian population.20

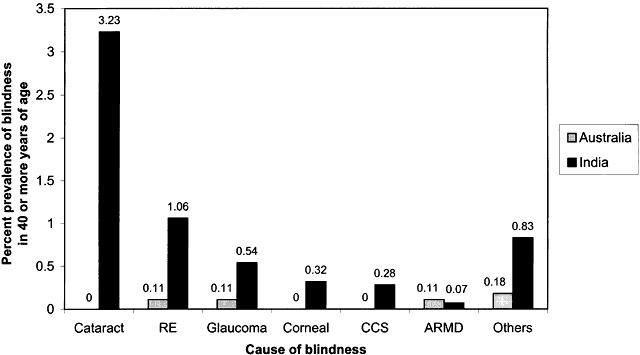
The most common cause of blindness in the developed countries is age-related macular degeneration21–23,33 (Table 2). The other important causes of blindness are primary open-angle glaucoma22,23,33 and refractive error22 (Fig. 4). Cataract also has been reported as a cause of blindness in some studies.23,33 The cause-specific rates of blindness, except for age-related macular degeneration, are many times lower in the developed countries than in the developing countries as a comparison between two studies from Australia and India illustrates (see Fig. 4).


Fig. 4. Comparison of cause-specific rates of blindness in Australia and India. Data shown are for blindness defined as presenting distance visual acuity less than 20/200 or visual field less than 10 degrees in the better eye in the Australian study, and presenting distance visual acuity less than 20/200 or visual field less than 20 degrees in the better eye in the Indian study. RE, refractive error; CCS, complications of cataract surgery; ARMD, age-related macular degeneration. (Data from Dandona and associates20 and VanNewkirk and associates.22)

Back to Top
BLINDNESS AND EYECARE SERVICES
The reduction in blindness in the developed countries has been brought about by better nutrition, community sanitation, and personal hygiene associated with an improvement in the standard of living, resulting in eradication of blindness due to malnutrition and infectious diseases. These historical changes in the patterns of blindness have not resulted from the development of ophthalmic services, but rather primarily because of the successful implementation of general public health measures, resulting in fewer infections and better nutrition of the populations in the developed countries. Advances in the technical skills of ophthalmologists and other eyecare professionals, and their ready availability, during the past few decades have resulted in further reduction of blindness in the developed countries. This is illustrated by the findings from recent population-based studies that blindness due to cataract is now rare in developed countries, and diabetic retinopathy, which was until recently a common cause of blindness in middle age, has not been found in recent studies to be a significant cause of blindness in the developed countries.21–23

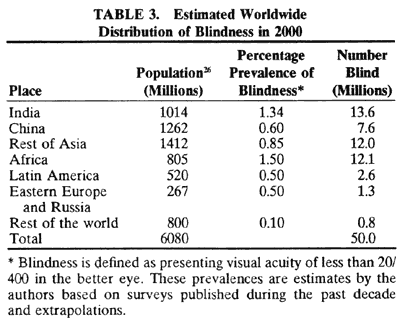
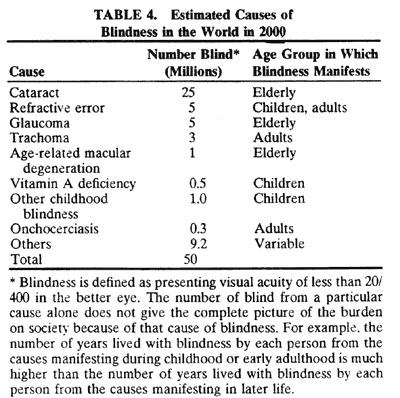
However, blindness is still a significant public health problem in most developing countries. Because of poverty and inadequate community health measures, blindness due to trachoma and vitamin A deficiency is still prevalent in many parts of Africa and Asia.15,16,28,32,59 In addition, most of Africa has few ophthalmologists or other adequately trained professionals to provide the basic refractive services and cataract surgery.1,60 Many Asian countries also have a serious deficiency in the availability of eyecare providers, although not as extreme as in Africa. For example, it is estimated that in the year 2000, Africa had fewer than one ophthalmologist for every 500,000 population, and Asia had one for every 200,000 population.1 India has one ophthalmologist for every 100,000 people, but most are based in urban areas, which have less than 30% of the country's population. The number of personnel available for providing refractive services is estimated as one for 250,000 population in the developing world.1 Because of this deficiency of eyecare providers and the lack of adequate infrastructure, the easily treatable blindness due to cataract and refractive error is high in many developing countries.13–16,20,39 The estimated worldwide distribution and the causes of blindness are listed in Tables 3 and 4.


On a more positive note, there are now some examples of successful eyecare programs in developing countries. A recent study from The Gambia, a country in Africa with a population of 1.4 million, has suggested that there has been a significant reduction in cataract blindness over a decade, which is attributed to the implementation of a National Eye Care Programme that has emphasized human resource and infrastructure development.47 An experiment with good-quality eyecare services linked with a community program also is showing some success in an area of India.61 For the success of Vision 2020—The Right to Sight, the global initiative to eliminate avoidable blindness by the year 2020, the most important action would have to take place at the community level.3 It is likely that the successful approaches will be those that are locally innovative and include involvement of the community in the logistics of eyecare, in addition to paying attention to good-quality training of eyecare providers and development of permanent infrastructure.3,62 The goal of Vision 2020, to eliminate avoidable blindness worldwide, would be accomplished only if the global, regional, and national planning translates into effective eyecare action at the level of each community in the developing world. WHO and the International Agency for the Prevention of Blindness, an umbrella organization of agencies interested in the prevention of blindness, are actively involved in developing the strategies that would be needed to achieve the goal of Vision 2020.1

Back to Top
REFERENCES

1. Programme for the Prevention of Blindness and Deafness, World Health Organization: Global Initiative for the Elimination of Avoidable Blindness. Geneva: WHO, 1997

2. International Statistical Classification of Diseases and Related Health Problems, 10th rev. Geneva: WHO, 1992

3. Foster A: Vision 2020—The Right to Sight. IAPB News 25:3–4, 2000

4. Thylefors B: A global initiative for the elimination of avoidable blindness. Am J Ophthalmol 125:90–93, 1998 (editorial)

5. Pararajasegaram R: Vision 2020—The Right to Sight: From strategies to action. Am J Ophthalmol 128:359–360, 1999 (editorial)

6. Dandona R, Dandona L: Refractive error blindness. Bull WHO 79:237–243, 2001

7. Tielsch JM, Sommer A, Witt K et al: Blindness and visual impairment in an American urban population: The Baltimore Eye Survey. Arch Ophthalmol 108:286–290, 1990

8. Taylor HR, Livingston PM, Stanislavsky YL et al: Visual impairment in Australia: Distance visual acuity, near vision, and visual field findings of the Melbourne Visual Impairment Project. Am J Ophthalmol 123:328–337, 1997

9. West SK, Munoz B, Rubin GS et al: Function and visual impairment in a population-based study of older adults: The SEE Project. Invest Ophthalmol Vis Sci 38:72–78, 1997

10. Reidy A, Minassian C, Vafidis G et al: Prevalence of serious eye disease and visual impairment in a north London population: Population based cross sectional study. BMJ 316:1643–1646, 1998

11. Dandona L, Dandona R, Naduvilath TJ et al: Is current eye-care-policy focus almost exclusively on cataract adequate to deal with blindness in India? Lancet 351:1312–1316, 1998

12. Murdoch IE, Jones BR, Cousens S et al: Visual field constriction as a cause of blindness or visual impairment. Bull World Health Organ 75:141–146, 1997

13. Whitfield R, Schwab L, Ross-Degnan D et al: Blindness and eye disease in Kenya: Ocular status survey results from the Kenya Rural Blindness Prevention Project. Br J Ophthalmol 74:333–340, 1990

14. Cook CD, Knight SE, Crofton-Briggs I: Prevalence and causes of low vision and blindness in northern KwaZulu.S Afr Med J 83:590–593, 1993

15. Kortlang C, Koster JCA, Coulibaly S et al: Prevalence of blindness and visual impairment in the region of Segou, Mali: A baseline survey for a primary eye care programme. Trop Med Int Health 1:314–319, 1996

16. Zerihun N, Mabey D: Blindness and low vision in Jimma zone, Ethiopia: Results of a population-based survey. Ophthalmic Epidemiol 4:19–26, 1997

17. Zhang SY, Zou LH, Gao YQ et al: National epidemiological survey of blindness and low vision in China. Chin Med J 105:603–608, 1992

18. Negrel AD, Minassian DC, Sayek F: Blindness and low vision in southeast Turkey. Ophthalmic Epidemiol 3:127–134, 1996

19. Mansour AM, Kassak K, Chaya M et al: National survey of blindness and low vision in Lebanon. Br J Ophthalmol 81:905–906, 1997

20. Dandona L, Dandona R, Srinivas M et al: Blindness in the Indian state of Andhra Pradesh. Invest Ophthalmol Vis Sci 42:908–916, 2001

21. Attebo K, Mitchell P, Smith W: Visual acuity and the causes of visual loss in Australia: The Blue Mountain Eye Study. Ophthalmology 103:357–364, 1996

22. VanNewkirk MR, Weih L, McCarty CA et al: The cause-specific prevalence of bilateral visual impairment in Victoria, Australia: The Visual Impairment Project. Ophthalmology 108:960–967, 2001

23. Klaver CCW, Wolfs RCW, Vingerling JR et al: Age-specific prevalence and causes of blindness and visual impairment in an older population: The Rotterdam Study. Arch Ophthalmol 116:653–658, 1998

24. Klein R, Klein BEK, Linton KLP et al: The Beaver Dam Eye Study: visual acuity. Ophthalmology 98:1310–1315, 1991

25. Thylefors B, Negrel AD, Pararajasegaram R et al: Global data on blindness. Bull World Health Organ 73:115–121, 1995

26. US Census Bureau. International Data Base: http:/www.census.gov (accessed September 2000)

27. Dandona L, Williams JD, Williams BC et al: Population-based assessment of childhood blindness in southern India. Arch Ophthalmol 116:545–546, 1998

28. Rahi JS, Sripathi S, Gilbert CE et al: Childhood blindness in India: causes in 1318 blind school students in nine states. Eye 9:545–550, 1995

29. Gilbert C, Foster A: Epidemiology of childhood blindness. In Moore A (ed): Fundamentals of Clinical Ophthalmology: Paediatric Ophthalmology. London: BMJ Books, 2000

30. Gilbert CE, Anderton L, Dandona L et al: Prevalence of visual impairment in children: A review of available data. Ophthalmic Epidemiol 6:73–82, 1999

31. Gilbert CE, Rahi J, Eckstein M et al: Retinopathy of prematurity in middle-income countries. Lancet 350:12–14, 1997

32. Schwartz EC, Huss R, Hopkins A et al: Blindness and visual impairment in a region endemic for onchocerciasis in the Central African Republic. Br J Ophthalmol 81:443–447, 1997

33. Sommer A, Tielsch JM, Katz J et al: Racial differences in the cause-specific prevalence of blindness in East Baltimore. N Engl J Med 325:1412–1417, 1991

34. Baasanhu J, Johnson GJ, Burendei G et al: Prevalence and causes of blindness and visual impairment in Mongolia: A survey of population aged 40 years and older. Bull WHO 72:771–776, 1994

35. Taylor HR, Katala S, Munoz B et al: Increase in mortality associated with blindness in rural Africa. Bull World Health Organ 69:335–338, 1991

36. Abou-Gareeb I, Lewallen S, Bassett K et al: Gender and blindness: A meta-analysis of population-based prevalence surveys. Ophthalmic Epidemiol 8:39–56, 2001

37. Fletcher AE, Donoghue M, Devavaram J et al: Low uptake of eye services in rural India: A challenge for programs of blindness prevention. Arch Ophthalmol 117:1393–1399, 1999

38. Ranson MK, Evans TG: The global burden of trachomatous visual impairment. I. Assessing prevalence.Int Ophthalmol 19:261–270, 1995-1996

39. Memon MS: Prevalence and causes of blindness in Pakistan. J Pak Med Assoc 42:196–198, 1992

40. Tielsch JM, Sommer A, Katz J et al: Socioeconomic status and visual impairment among urban Americans. Arch Ophthalmol 109:637–641, 1991

41. Foster PJ, Oen FT, Machin D et al: The prevalence of glaucoma in Chinese residents of Singapore: A cross-sectional population survey of the Tanjong Pagar district. Arch Ophthalmol 118:1105–1111, 2000

42. Foster PJ, Baasanhu J, Alsbirk PH et al: Glaucoma in Mongolia: A population-based survey in Hovsgol province, Northern Mongolia. Arch Ophthalmol 114:1235–1241, 1996

43. Dandona L, Dandona R, Mandal P et al: Angle-closure glaucoma in an urban population in southern India: The Andhra Pradesh Eye Disease Study. Ophthalmology 107:1710–1716, 2000

44. Tielsch JM, Sommer A, Katz J et al: Racial variations in the prevalence of primary open-angle glaucoma. JAMA 266:369–374, 1991

45. Leske MC, Connell AMS, Schachat AP et al: The Barbados Eye Study: Prevalence of open angle glaucoma. Arch Ophthalmol 112:821–829, 1994

46. Buhrmann RR, Quigley HA, Barron Y et al: Prevalence of glaucoma in a rural East African population. Invest Ophthalmol Vis Sci 41:40–48, 2000

47. Faal H, Minassian DC, Dolin PJ et al: Evaluation of a national eye care programme: A re-survey after 10 years. Br J Ophthalmol 84:948–951, 2000

48. Vassileva P, Gieser SC, Vitale S et al: Blindness and visual impairment in Western Bulgaria. Ophthalmic Epidemiol 3:143–149, 1996

49. Awan HR, Ihsan T: Prevalence of visual impairment and eye diseases in Afghan refugees in Pakistan. East Mediterr Health J 4:560–566, 1998

50. Dana MR, Tielsch JM, Enger C et al: Visual impairment in a rural Appalachian community: Prevalence and causes. JAMA 264:2400–2405, 1990

51. Stocks NP, Newland H, Hiller J: The epidemiology of blindness and trachoma in the Anangu Pitjantjatjara of South Australia. Med J Aust 160:751–756, 1994

52. Al-Faran MF, Al-Rajhi AA, Al-Omar OM et al: Prevalence and causes of visual impairment and blindness in the South Western region of Saudi Arabia. Int Ophthalmol 17:161–165, 1993

53. Pokharel GP, Selvaraj S, Ellwein LB: Visual function and quality of life outcomes among cataract operated and unoperated blind populations in Nepal. Br J Ophthalmol 82:606–610, 1998

54. Zhao J, Sui R, Jia L et al: Visual acuity and quality of life outcomes in patients with cataract in Shunyi county, China. Am J Ophthalmol 126:515–523, 1998

55. He M, Xu J, Li S et al: Visual acuity and quality of life in patients with cataract in Doumen County, China. Ophthalmology 106:1069–1615, 1999

56. Dandona L, Dandona R, Naduvilath TJ et al: Population-based assessment of the outcome of cataract surgery in an urban population in southern India. Am J Ophthalmol 127:650–658, 1999

57. Limburg H, Foster A, Vaidyanathan K et al: Monitoring visual acuity outcome of cataract surgery in India. Bull WHO 77:455–460, 1999

58. Singh AJ, Garner P, Floyd K: Cost-effectiveness of public-funded options for cataract surgery in Mysore, India. Lancet 355:180–184, 2000

59. Rapoza PA, West SK, Katala SJ et al: Prevalence and causes of vision loss in central Tanzania. Int Ophthalmol 15:123–129, 1991

60. Foster A: Who will operate on Africa's 3 million curably blind people? Lancet 337:1267–1269, 1991

61. Dandona L, Dandona R, Shamanna BR et al: A model for high-quality sustainable eye-care services in rural India. In Pararajasegaram R, Rao GN (eds): World Blindness and Its Prevention. Vol 6. Hyderabad: International Agency for the Prevention of Blindness, 2001

62. Dandona L: Blindness control in India: Beyond anachronism. Lancet 356:S25,

Back to Top