Chapter 54
Screening: Relationship to Diagnosis and Therapy
M. Cristina Leske, Barbara S. Hawkins, Leslie Hyman and Päivi H. Miskala
Main Menu   Table Of Contents

Search

OVERVIEW
APPLICATIONS OF SCREENING
REFERENCES

OVERVIEW
Although primary prevention is directed to averting the initial occurrence of disease, for example, through immunizations, secondary prevention aims to improve outcome of disease by early detection and treatment.1 Screening, typically considered as secondary prevention, seeks to detect disease at a preclinical stage with the expectation that early treatment will deter disease progression.

DEFINITIONS

Screening has been defined as the presumptive identification of unrecognized disease or defect by the application of tests, examinations, or other procedures that can be applied rapidly. Screening tests sort out apparently well persons who probably have a disease from those who probably do not.2 By this definition, screening is conducted on asymptomatic, presumably healthy individuals who are tested to determine whether they have high or low probabilities of disease. The results of screening, therefore, are tentative, and neither positive nor negative findings can be considered conclusive. Positive screening results do not necessarily imply disease; they only indicate the need for additional evaluation, typically by more extensive and more expensive methods. Similarly, negative screening results cannot be interpreted as conclusive evidence of the absence of disease.

Screening activities can be classified as “mass” or “selective.”3 Mass screening, or population-based screening, is provided on a large scale to unselected populations, such as visitors to health fairs, shopping centers, or other ad hoc settings. Selective screening, or high-risk screening, is limited to persons who have already been identified as being at an increased risk for a particular disease. Tools suitable for mass screening are typically less invasive and less expensive than screening tools to be applied in select population settings.4

Screening may be performed on volunteers in different community settings or on patients seeking health care for unrelated symptoms. Identifying previously unrecognized disease by screening among patients consulting for an unrelated disease (e.g., glaucoma screening of a patient consulting for myopia) is sometimes defined as case finding. When implementing a screening program, it is appropriate to provide follow-up evaluation for persons with positive screening tests. Screening is more likely to identify cases with a long preclinical phase of the disease than cases with a short preclinical phase.5

CRITERIA

Screening raises ethical, clinical, as well as scientific issues, and the decision to screen for a particular disease must be evaluated carefully. Several general principles have been proposed to assist in this evaluation.3,6–9 To be suitable for population-based screening, a disease should meet the following criteria:

  1. The disease should have an important effect on morbidity or mortality.
  2. The disease should have a sufficiently high prevalence within the target population to justify screening.
  3. The disease should have a natural history that is adequately understood.
  4. Treatment of the disease should be acceptable, effective, and available.
  5. The outcome of disease would be better if treatment were initiated before the usual time of diagnosis.
  6. Screening tests should be acceptable, reliable, and valid (i.e., high sensitivity and specificity) and have a reasonable cost.
  7. The cost of screening and subsequent follow-up evaluation and care should be less than the cost of providing treatment and other services at the usual time of diagnosis.

The rationale for each criterion is discussed below.

Morbidity and Mortality

A condition merits screening only if it has an important public health impact and is serious enough to affect the quality or quantity of life.

Prevalence

Ideally, screening should be aimed at detecting relatively common conditions within the population targeted. As the prevalence of a condition increases in the target population, screening yields more cases and the cost per case detected decreases.9

Natural History

Knowledge of the course of the disease process is essential for screening.10 In some conditions, there is a marked overlap in measurements between diseased and nondiseased persons, and the diagnosis is not clear cut. To be suitable for screening, a disease must have a clearly recognized biologic onset and a diagnosis that can be confirmed by accepted criteria. The disease should also have a latent, asymptomatic stage before it becomes clinically apparent (see Fig. 1). The presence of this asymptomatic stage will permit detection and intervention before the usual time of diagnosis. The time lapse between early detection by screening and the usual time of diagnosis is known as the lead time.8,11

Fig. 1 Stages in the natural history of disease and lead time of screening.

Effectiveness and Availability of Treatment

Screening is of value when the disease can be effectively treated or controlled. With incurable hereditary conditions, control of disease may be possible with counseling.12

In addition to being effective, the treatment must be accessible. Screening is justified only when facilities for diagnosis and treatment are available to persons with positive screening results. A major issue to emphasize, because it is often overlooked, is that resources for effective follow-up must be an integral part of a screening program.

Better Outcome with Early Treatment

The rationale for screening is that early detection and treatment will improve disease outcome. This goal can be attained only if intervention in the asymptomatic stage (Fig. 1) produces better results than when treatment is begun after the usual time of diagnosis.

Screening Tests

An important prerequisite for a screening test is its acceptability to the person being screened and to those performing and interpreting the test. Other requirements are simplicity, so the test can be easily administered and reliability or reproducibility, so that consistent results may be expected on repeated measurements by the same or a different observer. An important requirement is test validity (i.e., the ability to correctly identify diseased and nondiseased persons).1,4 Validity is measured by sensitivity and specificity (see Table 1). Sensitivity is the ability of a test to identify cases (i.e., diseased persons) correctly. Thus, a screening test with 90% sensitivity will be positive in 90 of 100 cases screened. Specificity is the ability of a test to identify noncases (i.e., nondiseased persons) correctly. Thus, a test with 95% specificity will be negative in 95 of every 100 noncases tested. In the example given in Table 1, Test A has a 70% sensitivity and 80% specificity.


TABLE 1. Example of Sensitivity, Specificity, and Predictive Values of a Screening Test, Assuming an Eye Disease with a Prevalence of 10% in the Target Population


Results of Screening Test A Eye Disease X  
  Present Absent Total
Positive test 70 (a) True positives180 (b) False positives250 (a + b) All positive tests
Negative test 30 (c) False negatives720 (d) True negatives750 (c + d) All negative tests
Total100 (a + c) Cases900 (b + d) Noncases1000 (a + b + c + d) Total

Sensitivity and Specificity
The denominator for these calculations is the number of cases (a + c) or noncases (b + d) of Eye Disease X.
  • Sensitivity is the proportion of true positives (cases with positive screening tests) among all cases = a/a + c (70/100= 0.70 or 70% sensitivity).
  • Specificity is the proportion of true negatives (noncases with negative screening tests) among all noncases = d/b + d (720/900= 0.80 or 80% specificity).

Predictive Values
The denominator for these calculations is the number of persons with positive tests (a+b) or negative tests (c + d).
  • Positive predictive value is the proportion of true positives (cases with positive screening tests) among all those with positive tests = a/a + b (70/250= 0.28 or 28%).
  • Negative predictive value is the proportion of true negatives (noncases with negative screening tests) among all those with negative tests = d/c + d (720/750= 0.96 or 96%).


Sensitivity and specificity should always be evaluated together. A test with high sensitivity will detect most of the cases and will thus have few false-negative results. However, if the same test has low specificity, many false-positive results will occur and lead to overreferrals. In contrast, a test with low sensitivity and high specificity will have many false-negative results but few false-positive results.

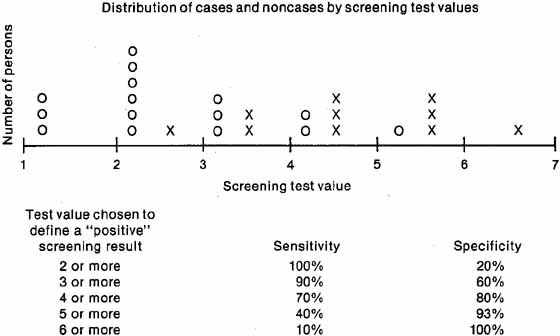
Ideally, a test should have high sensitivity and high specificity, but this goal is difficult to achieve in practice. Because the test results of diseased and nondiseased persons usually overlap, some cases have low (negative) test values and some noncases have high (positive) values (see Fig. 2). The specific test value chosen as a cutoff to define a “positive” screening result will affect both the sensitivity and the specificity. If a low cutoff value is chosen, the sensitivity will be high, because most cases will have “positive” screening results and will be referred for further diagnostic examinations. The specificity, however, will be low because many noncases will also be referred. Increasing the test value chosen as “positive” to trigger referral will increase the specificity, at the expense of the sensi-tivity. The decision to select a specific test value to determine referral depends on the disease being detected. If the failure to detect cases has serious consequences, for example, nondetection of malignant disease, a low test value should be chosen for referral, thus increasing sensitivity even though the specificity will decrease. If an excessive number of overreferrals is unacceptable, for example, when follow-up of screening requires invasive procedures, a high screening test value should be chosen for referral to increase specificity, although the sensitivity will decrease.

Fig. 2 Sensitivity and specificity at different screening test values (0, noncases; X, cases).

The evaluation of tests also includes “predictive values.” Sensitivity and specificity evaluate the ability of a test to separate cases correctly from noncases and are measures of validity, but predictive values are not. The predictive value of a positive test refers to the percentage of cases found among all those with positive tests (Table 1). In the example in Table 1, where Disease X had a prevalence of 10%, 250 persons had positive tests and 70 truly had the disease, resulting in a positive predictive value of 28% for Test A in this population. The predictive value of a negative test is defined as the percentage of noncases found among persons with negative tests (Table 1). Therefore, if 720 of 750 persons with negative tests were noncases, the negative predictive value was 96%. Predictive values depend not only on sensitivity and specificity of the test, but also on the prevalence of disease in the population screened. As the prevalence of the disease increases, the positive predictive value increases (see Table 2). Therefore, false-positive results are reduced when screening is performed in populations where the disease is common; conversely, screening leads to a large number of overreferrals when carried out in populations where the disease is rare. For this reason, the cost per case detected increases when the population screened has a low prevalence of disease.


TABLE 2. Positive Predictive Values by Disease Prevalence at Selected Levels of Sensitivity and Specificity


   Disease Prevalence
Sensitivity Specificity 0.5% 1% 2% 5% 10%
50%50%0.5%1%2%5%10%
50%90%2%5%9%21%36%
75%50%0.7%1%3%7%14%
90%95%8%15%27%49%67%


TWO-STAGE SCREENING.

Sometimes a screening program is multiphasic, that is, involves a series of sequential tests.4 Usually, an initial screening test that is inexpensive and noninvasive is performed first; then those with positive results are retested using a more accurate test, which is typically more expensive and/or more invasive.4 In this situation, sensitivity and specificity of the two screening tests can be combined and used in sequence, being referred to as net sensitivity and net specificity.4 These concepts are illustrated through the example that assumes multiphasic screening for Disease X, first using Test A (see Table 1) and then applying Test B (see Table 3) to the subset that screened positive with Test A.


TABLE 3. Example of Two-Stage Screening, Net Sensitivity and Net Specificity for a Sample Eye Disease X, Based on Screening Test A Followed by Screening Test B


Result of Screening Disease  
Test B Present Absent Total
Positive63 True Positives18 False Positives81
Negative7 False negatives162 True negatives169
Total70 Cases180 Noncases250
    
 This number is obtained from Table 1 and represents the true positives (tested positive and had the disease) from Test AThis number is obtained from Table 1 and represents the false positives (tested positive and did not have the disease) from Test A 

(Test B: Sensitivity = 90%; specificity = 90%)
Net Sensitivity
True positives from Test B: 63 = 63%
All cases in population for Test A: 100
Net specificity:
True negatives from Test A + True negatives from Test B: 720 +162 = 98%
All noncases in population for Test A: 900


Net sensitivity and net specificity are derived in two stages. Stage 1 evaluates the initial screening test for the total population, as presented for Test A in Table 1. For Stage 2, individuals who tested positive by Test A are rescreened using Test B. In the example, the 250 individuals who tested positive, as in Table 1, would be retested with Test B, which has 90% sensitivity and 90% specificity as indicated in Table 3. To calculate net sensitivity, the numerator is the number of individuals who were identified as true positives (i.e., tested positive and have the disease) by Test B, which is 63 in the example, and the denominator includes the total number of cases (i.e., the sum of true positives and false negatives) in the target population initially screened with Test A, which is 100 in the example. Therefore, net sensitivity is 63% and is lower than the sensitivity of either test, being equivalent to the sensitivity of Test A times the sensitivity of Test B. Net specificity is calculated by defining the numerator as the sum of the true negatives (i.e., tested negative and do not have the disease) identified by Tests A (n = 720) and B (n = 162) and the denominator as the total number of noncases (i.e., a sum of true negatives and false positives) in the population (n = 900), evaluated by Test A. Therefore, the net specificity is 98%, which is higher than the specificity of Test A and Test B, resulting in an overall gain by using the two screening tests. As demonstrated by this example, retesting individuals who initially test positive will increase specificity, thus decreasing the likelihood of over-referrals due to false-positive tests. Positive predictive value also increases by retesting persons in this group, because they have a higher prevalence of the disease.

Cost-Effectiveness

Aside from the purely humanitarian and social benefits of preventing morbidity, the cost-benefit of screening must be evaluated. Although screening may ultimately reduce the public health impact of a disease and bring about economic savings, the screening process itself generates costs. A common problem is the lack of inexpensive tests that can effectively separate cases from noncases. In addition to the resources expended in the testing process itself, these costs include the follow-up and diagnosis of persons with positive tests, as well as the costs of treating all the newly detected cases. The errors in classifying persons as “positives” and “negatives” also have a cost. Besides being subjected to unnecessary diagnostic tests for a condition they do not have, persons with false-positive tests may suffer other undesirable consequences, such as anxiety and worry at being considered a disease suspect. Additionally, costs are incurred by persons with false-negative screening tests, who may derive false reassurance from screening. Thus, screening for eye conditions may be justified if the cost of a screening program and associated services is less than the costs incurred when the disease is detected at the usual time of diagnosis, for example, the costs of providing long-term services for the visually disabled. It is also justified if earlier diagnosis will diminish psychologic and/or other negative consequences associated with the ophthalmologic condition.

Back to Top
APPLICATIONS OF SCREENING
Few conditions meet all the criteria for screening, and the issues related to screening may be different depending on the condition. To illustrate issues related to screening in ophthalmology, the remaining section will focus on glaucoma and amblyopia screening.

GLAUCOMA SCREENING

Primary open-angle glaucoma is a major cause of blindness and visual impairment throughout the world, particularly affecting persons of African descent.13 Because the visual disability caused by glaucoma is knownto be preventable by early treatment, efforts have been made to identify the disease in its asymptomatic stages. To assess the value of these efforts, it is necessary to determine how well the disease meets the criteria required for screening. First, the disease must be defined.

Definitions

The glaucomas are a group of conditions characterized by progressive optic nerve damage.14 Primary open-angle glaucoma occurs in the presence of an open iridocorneal angle and without any apparent cause; the diagnosis is made after other possible types of glaucoma have been excluded. The primary open-angle type of glaucoma is the most frequent among adults of European and African descent and is an important cause of visual disability. The discussion that follows is limited to screening for primary open-angle glaucoma, referred to hereafter as glaucoma, for brevity.

The diagnosis of glaucoma is made in the presence of nerve fiber bundle defects of the visual field, accompanied by structural changes of the optic disc (cupping or excavation), in the absence of other causes. An intraocular pressure over the population mean often, but not always, accompanies the disease. It is well recognized that field defects and disc cupping may occur at any intraocular pressure level. Therefore, glaucoma definitions from large epidemiologic studies are based on the presence of disc and/or field changes and, with few exceptions, do not use specific numerical values of intraocular pressure as a diagnostic criterion.13–29 Glaucoma definitions, however, are not standardized. Some reports distinguish normal tension glaucoma (disc and field changes with intraocular pressure less than or equal to 21 mm Hg) as a subcategory of open-angle glaucoma.22 For the purposes of this discussion, the diagnosis of primary open-angle glaucoma requires characteristic visual field and disc changes in the absence of other possible causes, regardless of intraocular pressure. Persons with pressures over 21-mm Hg, but without disc or field changes, are categorized as having ocular hypertension not glaucoma.30,31

Criteria

Traditionally, the most commonly used method for early identification of glaucoma has been mass tonometry screening, implemented in many community settings. This approach, however, has limitations, and its effectiveness has long been in question,32–39 thus leading to the search for better screening methods. The rationale for developing new methods and approaches to population screening rests on the assumption that detecting undiagnosed glaucoma is a desirable public health measure. To evaluate the validity of this assumption, a discussion of the criteria to justify screening, as applied to glaucoma, follows.

PUBLIC HEALTH IMPACT.

Glaucoma is a leading cause of blindness worldwide and is among the three leading causes of blindness in the United States, being the major reason for blindness registration among the African-American population.40 Although precise data are difficult to obtain, over 2 million Americans were estimated to have glaucoma in 2003 and about 90,000 were thought to be blind from the disease.41 Available sources suggest that glaucoma is responsible for 11% to 13% of existing blindness,42,43 a frequency that increases to over one-fourth among persons of African origin.44,45 In one U.S. study, primary open-angle glaucoma was 6.6 times higher in the black than in the white participants, and glaucoma blindness was seen at an earlier age, markedly increasing with age.43 These and other health care utilization data13 indicate that glaucoma is an important cause of visual impairment, especially among the African-derived population.

When assessing the impact of glaucoma, it is necessary to consider its effects on quality of life, which are largely dependent on the stage of the disease. The quality of life of glaucoma patients has been studied using various methods and approaches. Results consistently show a clear relationship with degree of visual function, particularly visual acuity.46–50 Most glaucoma patients, however, do not have important visual losses until advanced stages of the disease, thus suggesting that early glaucoma may have few or no effects on vision function-related quality of life. Alternatively, it may be that current instruments are not sufficiently sensitive to assess these effects. Using available methods, the impact of glaucoma is mainly evident among patients who have later stages of the disease.

PREVALENCE.

The prevalence of glaucoma is best determined by multiple diagnostic methods, including tonometry, ophthalmoscopy, and visual field testing of every survey participant. The first prevalence studies of glaucoma were conducted in Europe, starting in the 1960s, but a large number of studies from various parts of the world have followed (see Table 4).15–29 The earlier prevalence studies initially screened for glaucoma with tonometry and sometimes with ophthalmoscopy, with referral for visual field tests being limited to a subset of participants, such as the glaucoma suspects. This two-stage testing protocol leads to an undercounting of cases having ocular tensions below the cutoff for positive tonometry screening. In contrast, recent studies have emphasized methods other than tonometry for preliminary screening and have not included elevated intraocular pressure as a diagnostic criterion. As seen in Table 4, the variations in definitions of elevated IOP or ocular hypertension have led, at least in part, to differences in the prevalence of these conditions.


TABLE 4. Estimated Prevalence of High Intraocular Pressure and Glaucoma Defects at Screening in Population-Based Studies of Persons Older Than 40 Years of Age
Click Here to view Table 4.

When glaucoma is defined on the basis of optic disc changes with field defects, prevalence is around 1% to 2% for white populations aged 40 years and older (Table 4). Prevalences of open-angle glaucoma are markedly higher among black populations,19–21,29 especially those reported from studies in the Caribbean Islands of St. Lucia20 and Barbados.21 The prevalence of intraocular pressure over 21 mm Hg is also higher in these areas (Table 4).20–21 All studies show a sharp increase in glaucoma prevalence with age. At 70 years of age, prevalences reach 1% to 3% in white populations13,18,19 and 8% to 14% in black populations.19–21 For the purposes of screening, the prevalence of undetected cases is of most interest, since these persons are the target for screening efforts. A consistent result among population studies is that at least half of the cases were newly discovered and were unaware of their glaucoma diagnosis.19,21,24,26,27 Although the degree of severity of these undetected cases is seldom reported or compared to the known cases, they are likely to have an earlier stage of disease than persons with a known glaucoma diagnosis. Supportive evidence is provided by a Swedish study, where glaucoma cases newly identified in a population screening had significantly better visual field status and lower intraocular pressure than self-selected cases.51 If the goal of a screening program is to find all undetected cases, these results indicate that the program must include tests that are sufficiently sensitive to identify early glaucoma.

NATURAL HISTORY.

The reasons why open-angle glaucoma develops are not well understood, but age, high intraocular pressure, family history, African ancestry, and myopia have been confirmed as risk factors in many studies. (Hypertension and diabetes are positively associated with elevated intraocular pressure, but a similar relationship to glaucoma has not been shown consistently.13,27,52–54) Since high intraocular pressure often accompanies the disease, the distinction between “ocular hypertension” and glaucoma is not always clear cut, leading to a potential overlap between diseased and nondiseased persons.30,31 However, the natural history does not always consist of an orderly progression from an asymptomatic stage with high intraocular pressure to a clinical stage with optic nerve damage and visual field loss. Glaucoma damage may occur at any tension level and is not necessarily preceded by an increase in intraocular pressure.55,56 Although many persons sustain high intraocular pressures without damage, others develop field loss; it is not yet possible to distinguish between persons who will develop damage from glaucoma and those who will not. Ocular hypertensives are at higher risk of optic nerve damage, but the magnitude of this risk is small, estimated at less than 1% per year.13 Incidence was somewhat higher in the black population of the Barbados Eye Study cohort, where 5% of ocular hypertensives developed OAG after 4 years of follow-up.56 Consistent results were found in the Ocular Hypertension Treatment Study, suggesting a higher glaucoma risk in African-American participants.57

A requisite for screening is that the disease have a long preclinical stage to allow early detection. The natural course of glaucoma has been difficult to determine, because under usual standards of practice, all diagnosed patients are given intraocular pressure-lowering treatment. Recently, some information on natural history has been obtained from clinical trials with untreated and treated arms. These data indicate there is large variability in clinical course among individuals, with some patients progressing rapidly and others remaining very stable for years, with and without treatment.58,59 This variability could be explained by the presence of factors related to progression,60 which should be considered when planning patient management.

EFFECTIVENESS AND AVAILABILITY OF TREATMENT.

At present, medical and surgical therapies for open-angle glaucoma are based on lowering the intraocular pressure. This approach to treatment has been assumed effective in preventing, but not reversing, visual loss. Until recently, the available evidence on the effectiveness of intraocular pressure–lowering treatment to decrease the progression of glaucoma was mainly derived from nonrandomized studies and from clinical trials including ocular hypertensives.61 To demonstrate effectiveness, it was necessary to have evidence from randomized, controlled clinical trials that compared the frequency of visual field progression in treated and untreated patients with glaucoma. The Collaborative Normal Tension Glaucoma Study compared progression in treated versus untreated eyes of patients with a median IOP of 20-mm Hg or less.58 Although results showed a slower progression in treated eyes after controlling for the effects of cataract, the intent-to-treat analysis revealed no significant difference in visual field progression between groups.58

Definitive evidence on the effectiveness of treatment to slow progression in various types of glaucoma was provided by the Early Manifest Glaucoma Trial.59 The results are highly relevant to population-based screening, because participants in the trial were all previously undetected and largely identified from a specific population. After a median follow-up of 6 years, the progression of patients randomized to treatment was significantly slower than in the untreated control patients, with the overall risk being reduced in half.60 Results were consistent across various patient categories, such as older and younger ages, high and normal tension glaucoma, and eyes with more or less visual field loss at baseline.59

Similar results on the effectiveness of lowering the intraocular pressure to reduce the incidence of glaucoma were reported by the Ocular Hypertension Treatment Study, a large randomized clinical trial.57 In this study, ocular hypertensive patients treated with topical medications experienced conversion to glaucoma at less than half the rate of untreated patients, although the incidence of glaucoma in either group was low. This finding indicates that therapeutic lowering of intraocular pressure can slow disease onset and as such, it has potential for possible primary prevention of glaucoma. There are many caveats to consider, because the prevalence of ocular hypertension in the population is high (Table 4), yet the incidence of glaucoma is low, so that most ocular hypertensives will never develop optic nerve damage. Universal treatment for ocular hypertension is thus not recommended and should be limited to persons at higher risk. Additional information is needed to develop guidelines regarding which individuals with ocular hypertension would benefit most from treatment. The effectiveness of treatment in ocular hypertension relates to primary prevention of glaucoma and not directly to screening, which is a secondary prevention measure aimed to identify undetected glaucoma.

BETTER OUTCOME WITH EARLY TREATMENT.

A crucial issue to justify screening is that the outcome must be clearly and significantly improved by bringing the patient under clinical care in the asymptomatic preclinical stage. Evidence to indicate that early treatment improves visual field outcomes was provided by the Early Manifest Glaucoma Trial, based on a highly sensitive method to detect early changes.59 In addition to clinical outcomes, it is important to know whether early detection and treatment of glaucoma lead to improved quality of life for the patient. Because glaucoma treatment is lifelong, the early identification of cases through screening will lead to a prolongation of the usual length of therapy, as compared to no screening. This prolongation has consequences for the patient, because current treatments have a number of side effects and potential complications, which may affect quality of life. Further evaluation is needed of the long-term effects of early treatment on clinical and nonclinical outcomes. The additional costs of extended glaucoma treatment must be considered in the calculation of cost-effectiveness of screening.

Evaluation of Glaucoma Screening Methods.

Are acceptable and valid screening tests available? Can these be applied at a reasonable cost? Should they aim to detect very early disease stages (which requires highly sensitive tests), or to detect moderate or more advanced disease (which has more impact on the patient)? These issues are important in glaucoma, which has no symptoms until vision is impaired. The most frequently used screening methods aim to detect different manifestations of glaucoma: (1) tonometry to detect high intra-ocular pressure; (2) assessment of the disc to detect structural optic nerve changes, usually through ophthalmoscopy; and (3) perimetry to detect functional losses of the visual field. An overview of these screening methods is presented in Table 5.


TABLE 5. Comparison of Methods for Glaucoma Screening
Click Here to view Table 5.

INTRAOCULAR PRESSURE

Historically, the most commonly used test in glaucoma screening has been tonometry, although its shortcomings to detect the disease are now well recognized.32–37 Ocular tensions are extremely variable, and values are affected by age, time of day, sex, type of tonometer used, central corneal thickness, and many other factors.62,63 Some screening programs have used the Schiotz tonometer because it is less costly and simpler to use, but its measurements are subject to interinstrument and interobserver variations. Furthermore, Schiotz measurements may differ from those obtained with the Goldmann applanation tonometer. Interpretation of the Goldmann readings must consider the potential effects of central corneal thickness, because persons with thick corneas may have artifactually high readings and the reverse may occur in those with thin corneas.63,64 As such, screening with Goldmann tonometry could potentially lead to over- and under-referrals.

Most tonometry screenings consist of a one-time measurement of intraocular pressure. The results of these screenings are difficult to evaluate. The large variability in measurements and the increasing skewness of the intraocular pressure distribution with age make it difficult to define the boundary between “normal” and “high” tensions. In addition, the significance of one high measurement is uncertain, since repeat measurements may not be elevated. Usually, levels of 21 or 22-mm Hg have been used as the cutoff point for referral. With this criterion, a large number of persons will be referred after screening, because such values are found in at least 5% of white adults, especially at older ages, and even more frequently in African-Caribbeans (Table 4). Available data suggest that intraocular pressure is lower in Japan,22 where levels decrease with age.

Evaluations of tonometry screening must exclude the one-third to one-half of the prevalent cases who have a previous glaucoma diagnosis.19,21,24,26,27 These evaluations should also be based on studies that use several methods to detect structural and functional signs of glaucoma damage. A summary of such tonometry evaluations is presented in Table 6, which includes results for new and existing cases separately, if available.


TABLE 6. Evaluation of Tonometry Screening to Detect Glaucoma in Population Studies
Click Here to View Table 6.

Despite methodologic differences, the proportion of open-angle glaucoma cases found to have intraocular pressure over 21-mm Hg at screening generally varies from about one-half to two-thirds of the total cases, being even lower in some studies. As a consequence, the sensitivity of tonometry is consistently low (see Table 6), with somewhat higher sensitivities in African-Caribbean populations. In Barbados, West Indies, the sensitivity of tonometry to detect new cases of open-angle glaucoma was 74%. Sensitivity decreased to 63% when including known cases under treatment, and the same results were found in St. Lucia, West Indies; positive predictive values were also higher in these studies, in which glaucoma prevalence and mean intraocular pressure are also higher than in other populations (Table 4). The use of an intraocular pressure criterion over 21-mm Hg at screening yields comparable specificities across studies, with positive predictive values depending on the population prevalence (Table 6).

The above results are based on a one-time tonometry measurement. Retesting of glaucoma patients increases the frequency of elevated pressures. In Baltimore, the frequency of intraocular pressures over 21-mm Hg in all open-angle glaucoma cases rose from about 50% at screening to 75% when screening and/or one follow-up pressure was considered.66 For newly diagnosed open-angle glaucoma, comparable results from Barbados show increases from 74% to 81%.67 Most screenings, however, are limited to a one-time tonometric examination. A related problem is that one-fourth68 to one-half69 of the presumed ocular hypertensives will have normal ocular tensions at retesting. On the other hand, about 7% of those with normal pressures will have elevated measurements on repeat tonometry.68

To reduce the large number of overreferrals and decrease costs of tonometry screening, one option is to increase the referral level, for example, to 25 mm-Hg or higher. This change decreases the number of referrals and increases the positive predictive value but leads to a large decrease in sensitivity. In population studies, for example, only about one-third of cases have pressures of 25 mm-Hg or more at screening.66 Therefore, an unacceptably high percentage of the cases may be missed, if referral levels are raised.

These findings have several implications for screening programs. Although measurements of the intraocular pressure on more than one occasion increase sensitivity, the use of one-time tonometry for screening will miss about one-half (or more) of cases. At least 5% to 10% of those screened will be referred for further testing, but most will not have glaucoma. One-half to three-fourths of those referred will be confirmed as ocular hypertensives and asked to return for periodic follow-up visits. Although they are at increased risk of field loss, the magnitude of this risk is low, estimated to be around 1% to 2% per year of follow-up. The magnitude of these estimates will vary depending on the age and racial composition of the population screened. In sum, although tonometry is useful to detect ocular hypertension, it is widely recognized that this method alone is not acceptable for glaucoma screening.

STRUCTURAL ASSESSMENT

Techniques that allow a direct appraisal of the structural changes indicative of glaucoma have the potential for high sensitivity and specificity. Methods for this examination include ophthalmoscopy, which is most commonly used in screening, as well as photographic gradings of various anatomic features of the optic disc, such as cup-disc ratios. Other methods include nerve fiber layer photography and a variety of new and sophisticated imaging techniques. The requirements and resources to implement these techniques vary widely, and their methodology and application need further development and assessment for screening.

Screening by ophthalmoscopy requires skilled and reproducible observers. Rigorous training and standardization are needed for accurate observation of the optic disc and for appropriate referral. The specific disc findings that will result in a positive screening also require strict definition and evaluation of reproducibility within and among observers. Screening by ophthalmoscopy in the Framingham Eye Study showed that 76% of the persons with field defects had a vertical cup-disc ratio of greater than 0.4 and that 71% had high horizontal cup to disc ratios.65 In the Bedford Glaucoma Survey, however, screening based on disc appearance had a sensitivity under 40%.69 A recent evaluation of direct opthalmoscopic assessment of the optic disc reported limited sensitivities and specificities for individual disc features.70 Best results were achieved by combining data on narrowest rim width and parapapillary atrophy, which achieved a sensitivity of 81% and a specificity of 90%.70 In general, evaluations of ophthalmoscopy confirm the influence of observer variation on the results, although satisfactory agreement has been reported in some settings.70

The use of fundus photography for screening has limitations because of the additional resources and trained personnel required to take and interpret the photographs, as well as the pupil dilatation required by some techniques. In addition, media opacities, small pupils, and technical problems lead to incomplete population coverage, even while using nonmydriatic cameras.71 As with ophthalmoscopy, the sensitivity and specificity of photographic evaluations vary according to the criteria used to define abnormal disc structure (e.g., horizontal or vertical cup-disc ratio, narrowest remaining neuroretinal rim, “cupping” or “excavation”); they also vary with the disc criteria used to define the presence of glaucoma changes, even among experts.72 Population studies using photographic gradings have documented the limitations of existing disc criteria. For example, the Baltimore Eye Survey found 63% sensitivity and specificity for cup-disc ratios of 0.35, with 18% sensitivity and 98% specificity for cup-disc ratios of 0.7; similar results were found when using narrowest remaining neuroretinal rim as a criterion.66 Optic disc parameters from fundus photographs are thus not sufficiently sensitive or specific for glaucoma screening.

Insufficient evidence exists for the use of nerve fiber layer assessment in screening. To date, it has been used among groups of selected patients, but not on a population-wide basis.71,73–76 Further development and assessment of these methods, which allow the detection of early glaucoma damage, would enhance their use in screening. Considerable interest exists in developing advanced imaging modalities to enhance glaucoma detection and follow-up; these include optical coherence tomography, scanning laser polarimetry, and scanning laser tomography and others.77–79 These modalities offer advantages in terms of quantification, reproducibility, and possibly high sensitivity, as compared to other qualitative techniques, such as photographic gradings. These advantages have to be balanced against the high cost of the instruments and related feasibility issues, which limit their widespread use in screening. Various evaluations of these techniques are ongoing.

FUNCTIONAL ASSESSMENT

Visual field testing provides a direct functional evaluation of optic nerve status and is important in determining the diagnosis and extent of glaucoma damage. Other factors, such as cataract and retinal abnormalities that might impact the visual field, also need to be taken into account. Automated, computerized perimetry is in widespread use and is potentially useful for screening, because it does not require highly trained examiners and provides more standardized testing conditions than manual perimetry. Its use in screening has been infrequent because of limitations such as lengthy testing protocols, costly and poorly portable instruments, and variability of results, which are greatly influenced by patient-related factors, such as understanding and cooperation. The high frequency of unreliable tests, and difficulties experienced by some individuals in completing perimetry are further deterrents in screening.80 Evaluation of several automated perimeters in screening has found sensitivities of over 90%, with specificities being somewhat dependent on the type of instrument and algorithm used to detect visual field defects.81 Several analytic strategies and algorithms have been developed to enhance the testing and interpretation of results provided by automated perimeters.82–86 Although evaluations of their sensitivity and specificity to distinguish glaucoma patients from selected visually normal individuals give encouraging results, their performance in population-based settings has the potential for low specificity, because many conditions or artifacts may trigger a positive visual field test.

Standard threshold perimetry is the most commonly used method to test the visual field in practice. Newer techniques include short wavelength automated perimetry, frequency doubling technology perimetry, high pass resolution perimetry and motion-detection perimetry.81 Some of these are not suitable for screening because of cost or logistic issues. The development of shorter testing algorithms, such as SITA (Swedish Interactive Testing Algorithm) and SITA Fast,85,86 obviate the problems of prolonged testing times. As compared to standard threshold perimetry, these new algorithms may reduce testing time by more than 50%, while increasing sensitivity and reproducibility.81 The development of less costly and portable automated instruments such as the frequency doubling technology perimeter, which offers shorter algorithms, has increased advantages for screening.87 Results to date show high sensitivity and specificity in distinguishing glaucoma patients from controls, particularly when detecting moderate to advanced disease.88 Because the results are not affected by pupil size or blur, this instrument has potential for screening but needs additional testing on a population-wide basis. In sum, significant advances in automated perimetry have occurred. To date, most of these advantages are applicable for clinical purposes, but much remains to be done to increase the feasibility of perimetry screening.89

OTHER TECHNIQUES

Because of the limitations of all of the previous techniques, other screening methods are being investigated. Efforts to increase the sensitivity and specificity of screening also include the use of multiple testing methods, combinations of referral criteria, and questionnaires to identify possible predictive factors, such as medical or family history.66,90,91 Further evaluation is needed to determine fully the role of all of these approaches in screening.

Conclusions

Past assessments of the scientific justification for glaucoma screening have concluded that supportive evidence was lacking, because some of the criteria to justify screening were not met or incompletely met.36–39,89 As such, national task forces on prevention have not recommended glaucoma screening at the time of this writing.38,39 One major weakness has been the lack of evidence on the effectiveness of intraocular pressure-lowering treatment in previously undetected glaucoma. Although this evidence is now available, other issues remain to be resolved.

A major challenge is the unavailability of acceptable and cost-effective screening methods that can be applied on a community-wide basis. None of the current screening tests for glaucoma is ideal. Mass tonometry screening of unselected populations, which has been used in the past, cannot be justified because of the large number of false-positive referrals, the low prevalence and incidence of disease in confirmed ocular hypertensives, and the substantial number of persons with glaucoma who will be missed. Instead, screening methods should be based on structural and/or functional assessment to detect glaucoma damage. Aside from logistic considerations, these techniques need further evaluation before being applied on a population-wide basis. Most are likely to have high sensitivity and specificity to detect moderate or advanced glaucoma, with increased efforts needed to detect early disease.

Whenever feasible, a comprehensive eye examination has been a recommended approach to detection of glaucoma,39,92 particularly because it can identify other eye conditions. Another strategy proposed is the training of family practitioners in ophthalmoscopy.93 The effectiveness of ophthalmoscopy and automated perimetry to detect glaucoma in primary care and other settings needs further evaluation, as well as the use of various types of personnel in screening.94–96 At present, conventional perimeters are not a practical alternative, owing to their cost and other limitations, but new approaches are now available and show promise for use in screening.

Another remaining issue is to document the impact of detecting and treating very early disease on quality of life. Such documentation requires instruments that are sensitive to vision problems in glaucoma. Screening to find patients with early disease requires strong evidence of benefit, because it will require considerable efforts and highly sensitive tests. Additionally, this approach will prolong the usual time span of treatment and affect cost-effectiveness. It will be difficult to estimate cost-effectiveness until this issue is resolved and decisions made regarding the screening tests to use.

Rather than mass screening, a more effective approach at present is identifying high-risk groups and targeting them for selective screening or case-finding. Because these groups have an increased prevalence of disease, positive predictive values will increase and costs per case will decrease. Until the uncertainties of population screening are resolved, it seems justified to concentrate on selective screening, for example, testing relatives of glaucoma patients97 or persons of African origin.

In sum, although many advances have been made in glaucoma screening, a considerable number of issues need to be addressed. As such, it seems premature to provide a recommendation on the advisability of community-based glaucoma screening.

AMBLYOPIA SCREENING

Definitions

The word amblyopia has often been used in a broad sense to denote nonspecific losses of visual acuity.98,99 For the purposes of the present discussion, amblyopia is defined as low vision that occurs in infants or young children who have experienced some disturbance of binocular and/or foveal vision during development of the visual system but who have no detectable ophthalmologic defect.100 Strabismic or squint amblyopia is often observed in children whose eyes are improperly aligned. Amblyopia ex anopsia designates the condition in children who have had one eye obstructed at an early age.100,101 In these types of amblyopia, visual acuity remains impaired after the original defect has been corrected, and there is no discernible reason for poor vision. Except in cases in which media opacities or severe bilateral refractive errors have degraded the visual image falling on the retinas of both eyes, amblyopia is usually unilateral. The remainder of this discussion focuses on the unilateral condition. Visual impairment ranges from slight abnormality to functional blindness; light perception is always maintained.102

Criteria

PUBLIC HEALTH IMPACT.

Although amblyopic eyes retain some sight, visual acuity may fall below the level of legal blindness, which is 20/200 (6/60) in the United States and 20/400 by World Health Organization criteria. As long as good vision is maintained in the other eye, unilateral low vision is generally considered to be a mild handicap. Because only one eye is usually affected, amblyopes typically are not included in statistics regarding blindness.103–105 Amblyopia may place the individual at greater risk of mishap, both to the good eye and in general, because as much as one-fourth of the normal bilateral visual field may be lost in unilateral blindness.106

Feman et al.107 studied the causes of blindness of 539 eyes of new applicants for aid to the blind in Tennessee between July 1980 and June 1981. Seventy-four (14%) of the eyes were blind because of amblyopia. These findings are similar to those from the Framingham Eye Study; in 18 (11.8%) of the 152 blind eyes, blindness could be attributed only to amblyopia.17 In contrast, based on registration of partially sighted individuals in the county of Avon, England, Grey et al.108 found that amblyopia accounted for only 10 (0.9%) of 1146 blind eyes and 7 (1.3%) of 546 eyes with partial sight. From nationwide survey samples of 14,577 settled persons and 2233 bedouins in Saudi Arabia, Tabbara and Ross-Degnan109 calculated the prevalence of amblyopia to be 0.82%. Amblyopia was the third most common reason, after refractive errors and cataract, for reduced visual acuity (<20/60 [6/18]) in this population. Tommila and Tarkkanen110 collected histories of amblyopes in Finland who lost vision in the good eye from trauma or other causes and concluded that amblyopes are at greatly increased risk of bilateral blindness. Although this conclusion was based on a small number of patients and imperfect methodology, it implies that the public health problem may be greater than current data suggest. A more recent population-based study in the United Kingdom supported the findings of the Finnish study.111 Jakobsson et al.112 investigated the prevalence of amblyopia among patients at Visual Rehabilitation Centres in southeast Sweden. They estimated that 195 patients (1.7%) of 11,365 patients (average age 69 years) with visual handicap had amblyopia in one or both eyes. Of these 195 individuals, 40% had macular degeneration in the nonamblyopic eye. Stewart-Brown et al.113 confirmed earlier reports that children with amblyopia perform poorly at reading in comparison to their peers without any visual defect or with myopia only. No quality of life data have been published for amblyopes to date; assessment of the social impact on children is difficult.

PREVALENCE.

Prevalence rates of amblyopia in the United States are not well documented. A prevalence of 2% is frequently quoted,100 but this figure may be an underestimate.114 Prevalence data from several studies in different populations are summarized in Tables 7, 8, and 9.115–151 These rates are probably underestimates, because of failures in almost every study either to screen a random sample of the populations studied, to achieve complete or nearly complete follow-up on all suspected cases to confirm diagnosis, to obtain cooperation from all individuals who presented for screening, to identify cases already successfully treated, or to use reliable screening tests. Furthermore, as noted by Flom and Bedell,152 the level of visual acuity selected to define amblyopia or to select screeners for referral has a major impact on estimates of prevalence.


TABLE 7. Prevalence Rates of Amblyopia Among Preschool Children


Source Year of Publication Country No. Examined Definition Prevalence (%)
da Cunha and Jenkins1151961United Kingdom301One line difference in VA, failure of cover test1.7
Kaivonen and Koskenoja1161963Finland1327VA < 0.51.3
Bacharach et al.1171970United States3021.6
Neumann et al.1181971Israel6400Constant unilateral strabismus0.4
Kostal1191972Czechoslovakia96464.3
Nawratzki et al.1201972Israel13,028Unilateral strabismus, behavior0.5
Köhler and Stigmar1211973Sweden2447VA ≤ 20/24 (5/6), strabismus, or defective stereoscopic vision; examination1.8
Friedman et al.1221980Israel38,000Constant unilateral strabismus0.5
   15,084Anisometropia without strabismus0.1
Simpson et al.1231984New Zealand988History of patching2.9
Bolger et al.1241991United Kingdom7105Orthoptists1.1
   2977Physicians0.5
Macpherson et al.1251991Canada12,5700.3
Yazawa et al.1261992Japan21,906VA < 20/40 (6/12), unspecified otherwise0.2
Lim et al.1462000Singapore450VA ≤6/9 or untestable VA, strabismus, or abnormal or untestable stereotest; examination1.8
Williams et al.1472001United Kingdom2029Reduced VA for age and others1.6

VA, visual acuity; —, not reported.


TABLE 8. Prevalence Rates of Amblyopia Among School Children


Source Year of Publication Country No. Examined Definition Used Prevalence (%)
McNeil1271955United KingdomVA ≤ 6/9, squint1.4
    VA ≤ 6/9, anisometropia1.3
Frandsen1281960Denmark10,537VA ≤ 20/30 (6/9), squint2.6
    VA ≤ 20/80 (6/24), squint1.4
    VA ≤ 20/200 (6/60), squint0.8
Flom and Neumaier1291966United States VA ≤ 20/40 (6/12), > 1 line difference in VA 
   1561Kindergartners1.0
   1201Elementary schoolers1.2
Vereecken et al.1301966Belgium1215VA < 0.8, diagnosis3.5
Gansner1311968Switzerland11,879VA < 0.7, squint2.7
Rantanen and Tommila1321971Finland2100VA < 0.61.8
    Strabismic1.3
    Anisometropic0.5
Köhler and Stigmar1331978Sweden648VA ≤ 0.9, examination0.8
Costa et al.1341979Brazil5691.2
Haase and Miihlig1351979Germany8304.6
Laatikainen and Erkkila1361980Finland411VA < 0.81.2
Mølgaard et al.1371984Denmark150Failure of stereotest, examination2.0
Jensen and Goldschmidt1381986Denmark8769VA ≤ 20/40 (6/12)1.1
Preslan and Novak1481996United States680VA < 10/15, examination4.0
Kalikivayi et al1491997India3669VA < 6/9, examination1.1
Vyas and Lee1502001United States2687VA ≤ 20/40 (6/12) with uncorrected refractive error, strabismus or anisometropia1.0
Ohlsson et al1512003Mexico1035VA < 20/20 (6/6), ≥ 2 lines difference in VA, or bilateral reduction in VA + a high refractive error4.8%
    Same as above but VA ≤ 20/40 (6/12)2.5%

VA, visual acuity; —, not reported.


TABLE 9. Prevalence Rates of Residual Amblyopia Among Military Recruits and Personnel


Source Year of Publication Country No. Examined Definition Used Prevalence (%)
Glover and Brewer1391944United States21,446VA ≤ 20/702.4
Theodore et al.1401944United States190,012VA < 20/404.0
    Strabismic1.4
    Refractive1.3
    Unexplained1.3
Downing1411945United States60,000VA < 20/403.4
Irvine1421948United States10,0001.0
Helveston1431965United States9000VA ≥ 20/40, examination1.0
Evens and Kuypers1441967Belgium56,085VA < 20/64 (6/20)1.6
Hopkisson et al.1451982United Kingdom4499*VA > 6/9 in better eye and 2-line difference4.8
   4071 4.0

*Examined in 1968
†Examined in 1976
VA, visual acuity; —, not reported.


The similarity of prevalence rates shown in Tables 7 and 8 suggests that amblyopia develops in the preschool-aged child. This conclusion is supported by a follow-up study of children who were screened at 4 years of age and screened again when they were 7 years old. Although 44 (1.8%) of 2391 4-year-olds had functional amblyopia, only one new case of amblyopia (0.07%) was found among the 1530 7-year-olds who completed both screenings.121,133 Furthermore, this conclusion agrees with findings from the Avon Longitudinal Study of Pregnancy and Childhood (ALSPAC) in which Williams et al.147 compared methods of following and testing children during the first 3 years of life who were selected randomly from a population birth cohort.

Most of the data summarized in Tables 7, 8, and 9 were derived from predominantly or totally white populations (European descent), although more recent studies have been conducted in other ethnic groups. Even in the United States, a country in which there are sizable populations of both blacks (African descent) and whites, there are few data that permit valid comparisons between the two races. In the study by Preslan and Novak,148 75% of the school children participants were black, and this may account for the high prevalence rate. However, more data from black preschool and school children are required before such a conclusion can be reached. No differences in prevalence rates between males and females have been reported.

DESCRIPTION AND NATURAL HISTORY.

Amblyopia is not a single homogeneous entity. Several distinct clinical syndromes exist, and each may have different etiology and prognosis. Different methods of classification have been proposed on the basis of presence of strabismus, refractive errors, accommodation, fixation, or other factors.98,142,153,154 They have in common incongruity of visual information received by the two eyes, decrease in visual input, or a combination of both factors.155

Strabismic amblyopia associated with late-onset esotropia is perhaps the most common form of amblyopia. It is characterized by onset of an inward deviation of one eye between the ages of 1 and 5 years, best corrected visual acuity worse than 20/50 (6/15) in the deviating eye, at least a two-line difference in acuity between the two eyes, and the absence of any other detectable ophthalmologic defect. The esotropia may appear suddenly after illness, trauma, or stress. The deviation may be constant or intermittent and marked or so slight as to be almost unnoticeable.

Various hypotheses have been proposed to explain why good vision is lost or fails to develop in the deviating eye. Most authorities agree with Von Noorden,156 saying that the strabismus develops first, perhaps as a result of some insult to the nervous system. The retinas of the fixating eye and the deviating eye transmit conflicting images to the visual center. To avoid confusion, the child suppresses the image received by the deviating eye. Eventually, this suppression becomes a permanent loss of visual function if not treated. The median age of presentation with strabismic amblyopia is before the fourth birthday.157

Congenital esotropic amblyopia is characterized by an inward deviation of one or both eyes associated with monolateral fixation and is observed during the first 6 months of life. These cases tend to be less amenable to treatment than those associated with late-onset esotropia.

Microstrabismic amblyopia is also known as microtropia and monofixation syndrome.152,158,159 Misalignment of the eyes is not obvious, but careful measurement reveals a small-angle esotropia and inability of the affected eye to hold fixation under binocular conditions. This form of amblyopia usually remains undetected until the child undergoes vision testing in school or has an ophthalmologic examination for some other condition.

Anisometropic amblyopia occurs even in the absence of strabismus. It is usually detected only during vision screening. There is no deviation, even upon careful ophthalmologic evaluation, but there is a difference in the refractive error of the two eyes (sphere or cylinder) of at least 1.5 diopters and a difference in corrected visual acuity. Age at presentation with anisometropic amblyopia is typically later than with strabismic amblyopia; Shaw et al.157 reported the median age at presentation to be after the sixth birthday.

Stimulus deprivation amblyopia (amblyopia ex anopsia) is found in children with a congenital opacity of the media, such as cataract, or ptosis that obstructs vision from birth.100 Decreased vision may persist in the deprived eye even after repair or resolution of the original problem. Stimulus deprivation amblyopia is the best-understood form of amblyopia, but it is a relatively rare clinical problem, accounting for no more than 3% of cases. Prognosis for true amblyopia ex anopsia is usually poor, unless the opacity is removed in timely fashion and aggressive therapy is pursued.

Other amblyopias are much less common. These forms include strabismic amblyopia other than the esotropic form, bilateral amblyopia, amblyopia associated with congenital neurologic defects, and amblyopia associated with late occlusion.100,160–162 Strabismic amblyopia and anisometropic amblyopia account for most of the cases.152 Evidence is accumulating that there are fundamental differences between strabismic and anisometropic amblyopia with respect to visual function and pathophysiology and that the better-seeing fellow eyes of amblyopes may also have abnormal visual function.

Without treatment, vision in an amblyopic eye may deteriorate to functional blindness. In a few cases, loss of the good eye has been reported to have induced recovery of vision in the amblyopic eye. However, the frequency of such recovery without treatment is unknown and is likely to be very small. It is commonly accepted that the younger the child when therapy is initiated, the greater the likelihood that full vision will be restored. Treatment after the age of 6 to 9 years, depending on the developmental status of the child's visual system, is anticipated by most ophthalmologists to be, at best, only partially successful. Ongoing randomized clinical trials of treatment of older children, noted in the next section, should provide useful data to confirm or refute this position.

EFFECTIVENESS AND AVAILABILITY OF CURRENT METHODS OF TREATMENT.

Numerous procedures have been used for treating amblyopia.100,163 However, information from well-designed, randomized, multicenter clinical trials was not available until recently, largely due to the efforts of the Pediatric Eye Disease Investigator Group (PEDIG).164 The first completed PEDIG trial enrolled 419 children who were between 3 and 7 years of age and had moderate amblyopia (visual acuity in the amblyopic eye between 20/40 and 20/100). In this initial PEDIG trial, daily atropine drops were compared with 6-hour daily patching.164 After 6 months of follow-up, the investigators concluded that children with moderate amblyopia can be treated equally well with either treatment, evidenced by the fact that 79% of children in the patching group, and 74% in the atropine group had visual acuity 20/30 or better in the amblyopic eye or had gained three or more lines of vision in that eye by 6 months of follow-up. In another PEDIG randomized trial, 189 children between 3 and 7 years of age enrolled.165 The investigators demonstrated that 2-hour per day patching was equally effective in treating moderate amblyopia (visual acuity 20/40 to 20/80 inclusive) as compared with 6-hour per day patching when combined with near vision activities for at least 1 hour a day. Sixty-two percent of patients in each treatment arm in this study had visual acuity 20/32 or better in the amblyopic eye at 4 months of follow-up or had gained three or more lines of vision in that eye. Although long-term comparison of outcomes from these studies were not provided by the PEDIG trials, the short-term data suggest that parents and physicians can choose whether part-time patching or atropine penalization is a more appropriate treatment option for individual children. The benefit of patching is that visual acuity recovery may be faster than with atropine penalization.165 However, atropine penalization results in better treatment compliance than patching. A clinical trial investigating daily use of atropine as compared with Saturday and Sunday use only is currently underway at (http://www.nei.nih.gov/neitrials/static/study94.htm, accessed on January 8, 2004).

The mainstay of treatment of severe amblyopia is patching of the healthy eye because the blurring effect of atropine may not be sufficient to switch fixation from the healthy eye to the amblyopic eye. However, there is evidence to support that 6 hours of daily patching is equally effective to full-time patching, in combination with one hour or more of near activities daily, to improve visual acuity in the severely affected amblyopic eyes of children.166

All the treatment regimens currently proposed for amblyopia require both parental and child cooperation. Parental understanding of the importance of early treatment is critical for a successful outcome.167

BETTER OUTCOME WITH EARLY TREATMENT.

To achieve a successful long-term outcome, it is generally believed that treatment must be initiated while the visual system is in the plastic stage of development. Another rationale for early treatment is that correction of amblyopia before beginning school ensures that the child does not start formal education with a handicap. If treatment fails, proper provisions for minimizing the psychologic and educational impact of the visual handicap can be made by the parents and teachers. Most investigators report achievement of better visual acuity in a larger proportion of patients when amblyopia therapy is initiated in the first few years of life.168–173 However, the PEDIG has recently reported successful outcomes in children up to 7 years of age and currently are conducting an amblyopia treatment trial in children aged 7 to 17 years of age (http://www.nei.nih.gov/neitrials/static/study93.htm; accessed on January 8, 2004). A Swedish team is investigating atropine treatment in previously untreated children when initiated at 6 to 10 years of age.174

EVALUATION OF AMBLYOPIA SCREENING METHODS.

Disappointing results of therapy in older children and adults strengthen the argument for early screening and detection. However, screening young children for amblyopia is a difficult and complex task. Visual function may not be easily tested in a child who does not yet read, is unable to verbalize well, and is uncoordinated. An additional problem is differentiation of immature development of the visual system from vision abnormalities.

A major difficulty in the design of preschool vision screening projects is the absence of a readily accessible population, as one has with school children.175 Ehrlich et al.176 estimated that only 21% of preschool children in the United States receive any form of vision screening. Young children are usually unaware of their visual problem because they have no basis for comparison. Unless defects are cosmetically severe, parents may fail to observe any ocular or visual problems.

Because of the implications of diagnosis and treatment at a young age, amblyopia screening should be conducted among preschool-age children. However, vision tests in current use in screening programs are not usually practical for evaluating children younger than 3 years old.177–182 Recent experiences with preferential looking tests and acuity cards for screening younger children and infants have been mixed.183–185

Friendly175 and Lippmann186 have written extensively about preschool vision screening. Screening programs designed for preschool-age children usually include visual acuity testing and observation by the examiner for overt, intermittent, or latent strabismus. Tests of stereoscopic or binocular vision may be included.187 Family history has been found to be useful when positive but unreliable when negative.188

Ingram,189 after many years devoted to preschool screening and evaluation of screening programs, adopted a pessimistic view of their rationale and effectiveness. However, Vinding et al.190 concluded that obligatory vision testing of 4-year-olds in Denmark and treatment of visual defects had reduced the prevalence of amblyopia from 3% to 1%. Kentucky is unique in the United States in requiring that all children entering preschool, Head Start, or public school for the first time have a diagnostic eye examination, not just vision screening, by an optometrist or ophthalmologist.191

Because reduced visual acuity is the most clinically obvious sign of amblyopia, visual acuity testing has been the mainstay of most screening programs for preschoolers and school children. Many methods of visual acuity testing in young children have been proposed and reported. More than 30 tests were reviewed by Fern and Manny.192 Tests for young children can be classified into the following types:

  1. Letter or number recognition (e.g., Snellen optotypes, singly or in rows)
  2. Directional (e.g., E test or Sjögren's hand193)
  3. Symbol matching (e.g., STYCAR test194 or Ffooks test195)
  4. Picture recognition (e.g., Allen test196 or Österberg pictures197)

None of these tests is totally satisfactory.

The letter or number recognition tests rely on the child's ability to recall the name of the symbol. Single letter (or number) presentation usually results in higher visual acuity scores than line or chart presentation and has been shown to be an insensitive method for detecting amblyopia because of the “crowding phenomenon” associated with this disorder.175,198

Directional tests, in which the child points a hand in the direction indicated by the position of the symbol (E or hand), overcome the recognition and naming problems of the letter and number charts. However, young children can discriminate between up and down better than between right and left so that errors in the horizontal position are more common than in the vertical direction.175

Symbol matching tests avoid some of the problems discussed earlier. The child has only to hold up or point to the replica of the symbol that matches the one shown. However, single optotype presentation, which is generally used in these tests, demonstrates the same insensitivity to amblyopia as recognition tests that use this method of presentation. The Electronic Visual Acuity Tester181 developed to facilitate and standardize testing of visual acuity in clinical trials in pediatric eye disease uses matching but incorporates crowding bars that frame the letter displayed and has been demonstrated to have good reliability in children.

Picture tests were developed as a means of maintaining the child's interest.195–197,199 The difficulty with these tests is that few objects are universally recognizable as silhouettes or outlines. Furthermore, even when the picture is recognized, the child may not be able to recall its name or may be reluctant to say it if not confident of its pronunciation.

Only modest attention has been given to determining the sensitivity and specificity of individual screening procedures, their predictive value in different populations, and the comparability among tests. Table 10 displays calculations of these quantities from some reports that have included sufficient data to compare methods. Aaberg201 compared the E test, monocular cover-uncover, Hirschberg corneal light reflex, and the Worth 4-dot test in a pilot screening project among 248 children. Children who failed screening and a 20% sample of those who passed were evaluated by an ophthalmologist the same day. The overall sensitivity of the screening was 78%, and the specificity was 95%. The Worth 4-dot test had the lowest sensitivity; however, it identified two cases in children who had passed all the other tests. The specificities of all tests were high.


TABLE 10. Estimated Sensitivity, Specificity, and Predictive Values Reported for Tests Used to Screen for Amblyopia


  Prevalence of Amblyopia in     Predictive Values (%)
Source Sample (%) Test Sensitivity (%) Specificity (%) Positive Negative
Aaberg2017.4History2195
  E test33986095
  Worth 4-dot1110010093
  Cover33975095
  Hirschberg39975895
  Overall78955698
Friendly17518.5E test76926994
 14.5STYCAR45894290
Frydman and Allen20237.2ACT72554977
 37.2AVT85605687
 49.2ACT + AVT95817896
Ellis et al.18334.3TAC68826683
Ohlsson et al.2002.8Lang II55963799
Williams et al.1471.6Cover test alone4210010097
  Vision test alone38985597
  Photorefraction alone56985498
  Cover + vision tests84987399
  Cover and photorefraction82976399

ACT, Atlantic City Test; AVT, Allen Vision Test; TAC, Teller Acuity Cards; —, not reported.


Friendly175 compared the E test and the letter-matching STYCAR test in 633 children. The letter-matching test was found to be superior from the standpoint of testability, instruction time, and performance time. However, the E test had better reliability and validity.

Frydman and Allen202 compared the Atlantic City Test168 with the Allen Vision Test203 and calculated individual and joint sensitivities and specificities. Both tests measure visual acuity, test for excessive hyperopia, and check on abnormal muscle balance.

Ellis et al.183 compared Teller Acuity Cards with the clinical judgment of a pediatric ophthalmologist in 108 strabismic children. When an interocular difference of one octave in visual acuity or larger was chosen as the screening cutoff point, sensitivity of 68% and specificity of 82% were obtained. However, children who could not be tested monocularly were eliminated. Thus, agreement of 80% may be an overestimate.

Borg and Sundmark204 compared three directional tests in 71 children and found the reliability of all three to be low. Hedin et al.205 compared a letter-matching test to the E chart and concluded that performance was better on the letter-matching test. Jonkers200 compared test results using letter and number recognition charts, a picture chart, Landolt's rings (a directional test), and E chart and calculated conversion formulas for comparing results from the different charts. However, amblyopic children were eliminated from his investigation and the results may not apply to them. Keith et al.206 compared seven tests of visual acuity in a group of 74 children that included those with amblyopia and strabismus. One of the picture tests (Beale Collins) gave good results, but the other was poorly performed. The results of the E test, STYCAR test, and Ffooks test were similar, but the STYCAR matching test was the easiest for the youngest children to grasp and perform.

Ohlsson et al.200 evaluated the Lang II stereo card in 1046 children 12 and 13 years of age. They concluded that the sensitivity and positive predictive value were too low for screening purposes. In addition, a number of children with normal eyes and vision misidentified one or more of the three images.

Williams et al.147 compared screening methods for strabismus and/or amblyopia. The findings given in Table 10 are based on test results in 876 children tested at 37 months of age. They found that specificity of photorefraction, although low in infancy, was better than 95% by 25 months of age and recommended combining it with cover testing or visual acuity testing to achieve acceptable sensitivity.

No clear consensus regarding the best visual acuity test for amblyopia screening can be derived from these comparative studies. Similarly, no recommendation can be made regarding supplemental tests to be added to the visual acuity testing to improve identification of amblyopic children. Kohler and Stigmar121 found that 97% of the eye defects found in children referred from screening had been detected by visual acuity testing; however, Hall et al.207 found that children with suspected strabismus formed the bulk at high risk of amblyopia among referrals for evaluation. Photorefraction to screen infants and young children has become increasingly more widely used. The findings of Williams et al.147 support adding it to vision testing for screening children 2 years of age and older.

In spite of the measurement and logistic problems, visual acuity testing has few rivals in screening programs for eye defects among children 3 years of age or older because of the desirability of using a single method to measure visual acuity at different ages and stages of development, and throughout screening, diagnosis, treatment, and follow-up. The Electronic Visual Acuity Tester developed for the PEDIG may become more widely used.180,181 Doran208 has encouraged adoption of Bailey-Lovie charts to standardize test interpretation across a wide age range.

Conclusions

The need for standard operational definitions required to describe the various clinical presentations of amblyopia, to define amblyopia screening criteria, and to evaluate treatment of amblyopia may be met by the PEDIG or other collaborative groups.163,164 Until standard definitions are used by all amblyopia researchers, comparison of results from screening projects and evaluation of testing methodology will remain difficult.

The incidence of amblyopia is high among children with strabismus, and the child with obvious strabismus is likely to come to medical attention earlier than the child with microstrabismus or amblyopia in the absence of strabismus.157,175,209 Better epidemiologic data concerning amblyopia are required to identify other high-risk groups who should receive special attention in screening programs.

Objective comparison and evaluation of screening methods for use in preschool-aged children must continue to establish which are best for the detection of different types of amblyopia and for children of different ages. Problems of cooperation and confounding developmental factors are not likely to be eliminated for any single “universal” screening procedure.

It has been stated that early vision screening is as important to the child as immunization.114 Combining vision screening with immunization visits to pediatricians and well-child clinics may be one way to ensure that the greatest possible numbers of young children are screened in the least disruptive fashion. The increasing number of preschool children in day-care centers suggests another venue for screening.210,211

Back to Top
REFERENCES

1. Last JM: A Dictionary of Epidemiology, 4th ed. New York: Oxford University Press, 2001

2. Commission on Chronic Illness: Chronic Illness in the United States, vol. I, Prevention of Chronic Illness. Cambridge, MA: Harvard University Press, 1957

3. Wilson JMG, Jugner G: Principles and Practice of Screening for Disease, vol. 34. Geneva: World Health Organization, 1968

4. Gordis L: Epidemiology. Philadelphia: WB Saunders, 1996

5. Sackett DL, Haynes RB, Guyah GH, Tugwell P: Clinical Epidemiology. A Basic Science for Clinical Medicine, 2nd ed. Boston: Little, Brown & Co., 1991

6. Cochrane AL, Holland WW: Validation of screening procedures. Br Med Bull 27(1):3–8, 1971

7. Frame PS, Carlson SJ: A critical review of periodic health screening using specific screening criteria.I: Selected diseases of respiratory, cardiovascular, and central nervous systems. J Earn Pract 2(29), 1975

8. Morrison AS: Screening in Chronic Disease. New York: Oxford University Press, 1985

9. Thorner RM: Screening and early detection of disease. In Clark DW, MacMahon B (eds): Preventive and Community Medicine, 2nd ed. Boston: Little, Brown & Co., 1981

10. Fletcher RH, Fletcher SW, Wagner EH: Clinical Epidemiology: The Essentials, 3rd ed. Baltimore: Williams & Wilkins, 1996

11. Frankenburg WK: Principles in selecting diseases for screening. In Frankenburg WK, Camp BW (eds): Pediatric Screening Tests. Springfield, IL: Charles C. Thomas, 1975

12. Mange EJ, Mange AP: Basic Human Genetics. Sunderland, MA: Sinauer Associates, 1994

13. Leske MC: The epidemiology of open-angle glaucoma: A review. Am J Epidemiol 118(2):166–191, 1983

14. Heilmann K, Richardson KT: Glaucoma, Conceptions of a Disease. Philadelphia: WB Saunders, 1978

15. Hollows FC, Graham PA: Intraocular pressure, glaucoma, and glaucoma suspects in a defined population. Br J Ophthalmol 50(10):570–586, 1966

16. Bengtsson B: The prevalence of glaucoma. Br J Ophthalmol 65(1): 46–49, 1981

17. Leibowitz HM, Krueger DE, Maunder LR, et al: The Framingham Eye Study monograph: An ophthalmological and epidemiological study of cataract, glaucoma, diabetic retinopathy, macular degeneration, and visual acuity in a general population of 2631 adults, 1973–1975. Surv Ophthalmol 24(suppl):335–610 1980

18. Klein BE, Klein R, Sponsel WE, et al: Prevalence of glaucoma. The Beaver Dam Eye Study. Ophthalmology 99(10):1499–1504, 1992

19. Tielsch JM, Sommer A, Katz J, et al: Racial variations in the prevalence of primary open-angle glaucoma. The Baltimore Eye Survey. JAMA 266(3):369–374, 1991

20. Mason RP, Kosoko O, Wilson MR, et al: National survey of the prevalence and risk factors of glaucoma in St. Lucia, West Indies. Part I. Prevalence findings. Ophthalmology 96(9):1363–1368, 1989

21. Leske MC, Connell AM, Schachat AP, Hyman L: The Barbados Eye Study. Prevalence of open angle glaucoma. Arch Ophthalmol 112(6):821–829, 1994

22. Shiose Y, Kitazawa Y, Tsukahara S, et al: Epidemiology of glaucoma in Japan: A nationwide glaucoma survey. Jpn J Ophthalmol 35(2):133–155, 1991

23. Wolfs RC, Borger PH, Ramrattan RS, et al: Changing views on open-angle glaucoma: Definitions and prevalences: The Rotterdam Study. Invest Ophthalmol Vis Sci 41(11):3309–3321, 2000

24. Mitchell P, Smith W, Attebo K, Healey PR: Prevalence of open-angle glaucoma in Australia. The Blue Mountains Eye Study. Ophthalmology 103(10):1661–1669, 1996

25. Cedrone C, Culasso F, Cesareo M, et al: Prevalence of glaucoma in Ponza, Italy: A comparison with other studies. Ophthalmic Epidemiol 4(2):59–72, 1997

26. Wensor MD, McCarty CA, Stanislavsky YL, et al: The prevalence of glaucoma in the Melbourne Visual Impairment Project. Ophthalmology 105(4):733–739, 1998

27. Quigley H, West SK, Rodriguez J, et al: The prevalence of glaucoma in a population-based study of Hispanic subjects: Proyecto VER. Arch Ophthalmol 119(12):1819–1826, 2001

28. Ramakrishnan R, Nirmalan PK, Krishnadas R, et al: Glaucoma in a rural population of southern India: The Aravind Comprehensive Eye Survey. Ophthalmology 110(8):1484–1490, 2003

29. Buhrmann RR, Quigley HA, Barron Y, et al: Prevalence of glaucoma in a rural East African population. Invest Ophthalmol Vis Sci 41(1):40–48, 2000

30. Chandler PA, Grant WM: Ocular hypertension vs open-angle glaucoma. Arch Ophthalmol 95(4):585–586, 1977

31. Harbin TS, Becker B: What is ocular hypertension and should it be treated? In Brockhurst RJ (ed): Controversy in Ophthalmology. Philadelphia: WB Saunders, 1977

32. Cochrane AL, Graham PA, Wallace J: Glaucoma. In McKeown T (ed): Screening in Medical Care. London: Oxford University Press, 1968

33. Leske MC, Rosenthal J: Epidemiologic aspects of open-angle glaucoma. Am J Epidemiol 109(3):250–272, 1979

34. Worthen DM: Economic aspects of the management of ocular hypertension. Surv Ophthalmol 25(3):206–214, 1980

35. Eddy DM, Sanders LE, Eddy JF: The value of screening for glaucoma with tonometry. Surv Ophthalmol 28(3):194–205, 1983

36. Power EJ, Wagner JL, Duffy BM: Screening for open-angle glaucoma in the elderly: A staff paper. Office of Technology Assessment. Washington DC, 1988

37. Sommer A: Glaucoma screening: Too little, too late? J Gen Intern Med 5(5 suppl):S33–S37, 1990

38. Canadian Task Force: Periodic Health Examination, 1995 Update: 3. Screening for Visual Problems Among Elderly Patients, vol. 2002, 1995

39. U.S. Preventive Task Force: Screening: Glaucoma, 2nd ed, vol 2002, 1996

40. Hiller R, Kahn HA: Blindness from glaucoma. Am J Ophthalmol 80(1):62–69, 1975

41. Eye Disease Prevalence Group: The prevalence of open-angle glaucoma in the United States. Arch Ophthalmol 2004 (in press)

42. Thylefors B, Negrel AD, Pararajasegaram R, Dadzie KY: Global data on blindness. Bull WHO 73(1):115–121, 1995

43. Sommer A, Tielsch JM, Katz J, et al: Racial differences in the cause-specific prevalence of blindness in east Baltimore. N Engl J Med 325(20):1412–1417, 1991

44. Hyman L, Wu SY, Connell AM, et al: Prevalence and causes of visual impairment in the Barbados Eye Study. Ophthalmology 108(10):1751–1756, 2001

45. Eye Disease Prevalence Group: Causes and estimated prevalence of visual impairment in the United States. Arch Ophthalmol 2004 (in press)

46. Parrish RK, Gedde SJ, Scott IU, et al: Visual function and quality of life among patients with glaucoma. Arch Ophthalmol 115:1447–1455, 1997

47. Sherwood MB, Garcia-Siekavizza A, Meltzer MI, et al: Glaucoma's impact on quality of life and its relation to clinical indicators. A pilot study. Ophthalmology 105(3):561–566, 1998

48. Gutierrez P, Wilson MR, Johnson C, et al: Influence of glaucomatous visual field loss on health-related quality of life. Arch Ophthalmol 115:777–784, 1997

49. Janz NK, Wren PA, Lichter PR, et al: Quality of life in newly diagnosed glaucoma patients: The Collaborative Initial Glaucoma Treatment Study. Ophthalmology 108(5):887–898, 2001

50. Iester M, Zingirian M: Quality of life in patients with early, moderate and advanced glaucoma. Eye 16(1):44–49, 2002

51. Grodum K, Heijl A, Bengtsson B: A comparison of glaucoma patients identified through mass screening and in routine clinical practice. Acta Ophthalmol Scand 80(6):627–631, 2002

52. Tielsch J, Katz J, Quigley HA, et al: Diabetes, intraocular pressure, and primary open-angle glaucoma in the Baltimore Eye Survey. Ophthalmology 102(1):48–53, 1995

53. Wu SY, Leske MC: Associations with intraocular pressure in the Barbados Eye Study. Arch Ophthalmol 115(12):1572–1576, 1997

54. Leske MC, Wu SY, Nemesure B, Hennis A: Incident open-angle glaucoma and blood pressure. Arch Ophthalmol 120(7):954–959, 2002

55. Bengtsson B: Glaucoma case detection. Acta Ophthalmol (Copenh) 69(3):288–292, 1991

56. Leske MC, Connell AM, Wu SY, et al: Incidence of open-angle glaucoma: The Barbados Eye Studies. The Barbados Eye Studies Group. Arch Ophthalmol 119(1):89–95, 2001

57. Kass MA, Heuer DK, Higginbotham EJ, et al: The Ocular Hypertension Treatment Study: A randomized trial determines that topical ocular hypotensive medication delays or prevents the onset of primary open-angle glaucoma. Arch Ophthalmol 120(6):701–713, 2002

58. Anderson DR: Collaborative Normal Tension Glaucoma Study. Curr Opin Ophthalmol 14(2):8–90, 2003

59. Heijl A, Leske MC, Bengtsson B, Hussein M: Group E: Reduction of intraocular pressure and glaucoma progression: Results from the Early Manifest Glaucoma Trial. Arch Ophthalmol 120:1268–1279, 2002

60. Leske MC, Heijl A, Hussein M, et al: Factors for glaucoma progression and the effect of treatment. Arch Ophthalmol 121(1):48–56, 2003

61. Rossetti L, Marchetti I, Orzalesi N, et al: Randomized clinical trials on medical treatment of glaucoma: Are they appropriate to guide clinical practice? Arch Ophthalmol 111:96, 1993

62. Shiose Y: Intraocular pressure: New perspectives. Surv Ophthalmol 34(6):413–435, 1990

63. Wolfs RC, Klaver CC, Vingerling JR, et al: Distribution of central corneal thickness and its association with intraocular pressure: The Rotterdam Study. Am J Ophthalmol 123(6):767–772, 1997

64. Alsbirk PH: Corneal thickness. II. Environmental and genetic factors. Acta Ophthalmol (Copenh) 56(1):105–113, 1978

65. Leske MC, Podgor M, Ederer F: An evaluation of glaucoma screening methods. Invest Ophthalmol Vis Sci 22(suppl):128, 1982

66. Tielsch J, Katz J, Singh K, et al: A population-based evaluation of glaucoma screening: The Baltimore Eye Survey. Am J Epidemiol 134(10):1102–1110, 1991

67. Leske MC, Connell AM, Wu SY, et al: Distribution of intraocular pressure. The Barbados Eye Study. Arch Ophthalmol 115(8):1051–1057, 1997

68. Hollows FC, Graham PA: A critical review of methods of detecting glaucoma. In Hung LB (ed): Glaucoma. London: E & S Livingstone, 1966

69. Bankes JL, Perkins ES, Tsolakis S, Wright JE: Bedford glaucoma survey. Br Med J 1(595):791–796, 1968

70. Harper R, Reeves B: The sensitivity and specificity of direct ophthalmoscopic optic disc assessment in screening for glaucoma: A multivariate analysis. Graefes Arch Clin Exp Ophthalmol 238(12):949–955, 2000

71. Tuulonen A, Airaksinen PJ, Montagna A, Nieminen H: Screening for glaucoma with a non-mydriatic fundus camera. Acta Ophthalmol (Copenh) 68(4):445–449, 1990

72. Azuara-Blanco A, Katz LJ, Spaeth GL, et al: Clinical agreement among glaucoma experts in the detection of glaucomatous changes of the optic disk using simultaneous stereoscopic photographs. Am J Ophthalmol 136(5):949–950, 2003

73. Niessen AG, Langerhorst CT, Geijssen HC, Greve EL: Design of low cost glaucoma screening. Documenta ophthalmologica. Advances in ophthalmology 93(4):293–315, 1997

74. Wang F, Quigley HA, Tielsch JM: Screening for glaucoma in a medical clinic with photographs of the nerve fiber layer. Arch Ophthalmol 112(6):796–800, 1994

75. Komulainen R, Tuulonen A, Airaksinen PJ: The follow-up of patients screened for glaucoma with non-mydriatic fundus photography. Int Ophthalmol 16(6):465–469, 1992

76. Niessen AG, van den Berg TJ, Langerhorst CT, Bossuyt PM: Grading of retinal nerve fiber layer with a photographic reference set. Am J Ophthalmol 120(5):577–586, 1995

77. Greenfield DS: Optic nerve and retinal nerve fiber layer analyzers in glaucoma. Curr Opin Ophthalmol 13(2):68–76, 2002

78. Correnti AJ, Wollstein G, Price LL, Schuman JS: Comparison of optic nerve head assessment with a digital stereoscopic camera (discam), scanning laser ophthalmoscopy, and stereophotography. Ophthalmology 110(8):1499–1505, 2003

79. Ford BA, Artes PH, McCormick TA, et al: Comparison of data analysis tools for detection of glaucoma with the Heidelberg Retina Tomograph. Ophthalmology 110(6):1145–1150, 2003

80. Katz J, Sommer A: Screening for glaucomatous visual field loss. The effect of patient reliability. Ophthalmology 97(8):1032–1037, 1990

81. Delgado MF, Nguyen NT, Cox TA, et al: Automated perimetry: A report by the American Academy of Ophthalmology. Ophthalmology 109(12):2362–2374, 2002

82. Heijl A, Lindgren G, Olsson J: A package for the statistical analysis of visual fields. Doc Ophthalmol Proc Ser 49:153, 1987

83. Heijl A, Lindgren G, Olsson J, Asman P: Visual field interpretation with empiric probability maps. Surv Ophthalmol (33 suppl):403–404, 1989

84. Katz J, Sommer A, Gaasterland DE, Anderson DR: Comparison of analytic algorithms for detecting glaucomatous visual field loss. Arch Ophthalmol 109(12):1684–1689, 1991

85. Bengtsson B, Olsson J, Heijl A, Rootzen H: A new generation of algorithms for computerized threshold perimetry, SITA. Acta Ophthalmol Scand 75(4):368–375, 1997

86. Bengtsson B, Heijl A: SITA Fast, a new rapid perimetric threshold test. Description of methods and evaluation in patients with manifest and suspect glaucoma. Acta Ophthalmol Scand 76(4):431–437, 1998

87. Anderson AJ, Johnson CA: Frequency-doubling technology perimetry. Ophthalmol Clin N Am 16(2):213–225, 2003

88. Iwasaki A, Sugita M: Glaucoma Screening Project (GSP) Study Group: Performance of glaucoma mass screening with only a visual field test using frequency-doubling technology perimetry. Am J Ophthalmol 134(4):529–537, 2002

89. Tuulonen A, Airaksinen PJ, Erola E, et al: The Finnish evidence-based guideline for open-angle glaucoma. Acta Ophthalmol Scand 81(1):3–18, 2003

90. Mundorf TK, Zimmerman TJ, Nardin GF, Kendall KS: Automated perimetry, tonometry, and questionnaire in glaucoma screening. Am J Ophthalmol 108(5):505–508, 1989

91. Vernon SA, Henry DJ, Cater L, Jones SJ: Screening for glaucoma in the community by non-ophthalmologically trained staff using semi automated equipment. Eye 4(Pt 1):89–97, 1990

92. Ivers RQ, Optom B, Macaskill P, et al: Sensitivity and specificity of tests to detect eye disease in an older population. Ophthalmology 108(5):968–975, 2001

93. Crick RP: Early detection of glaucoma. Br Med J (Clin Res Ed) 285(6348):1063–1064, 1982

94. Skorin LJ, Multack RF, Holtzman JN: Health fair glaucoma screening: Follow-up evaluation. J Am Osteopath Assoc 91(7):671–674, 1991

95. Tuck MW, Crick RP: Efficiency of referral for suspected glaucoma. Br Med J 302(6783):998–1000, 1991

96. Hitchings RA: Screening for glaucoma. Br Med J (Clin Res Ed) 292(6519):505–506, 1986

97. Vernon SA: Screening siblings for glaucoma in the UK. J R Soc Med 84(9):545–546, 1991

98. Linksz A (ed): Report on the Deliberations of Working Group I (Terminology, Standardization of the Language of Communication). New York: S Karger, 1968:267–283

99. Duke-Elder S, Wybar K: System of Ophthalmology, vol VI, Ocular Motility and Strabismus. St. Louis: CV Mosby, 1973:282–317

100. von Noorden G: Burian-von Noorden's Binocular Vision and Ocular Motility: Theory and Management of Strabismus, 2nd ed. St. Louis: CV Mosby 1980:219–284, 436–447

101. Burian H: Pathophysiologic basis of amblyopia and of its treatment. Am J Ophthalmol 67:1–12, 1969

102. Lyle T: Summing up. Br J Ophthalmol 58:319–331, 1974

103. Belloc N, Fowler D, Simmons W: Causes of blindness in California. Sight Sav Rev 27:98–111, 1957

104. Hatfield E: Why are we blind? Sight Sav Rev 45:3–22, 1975

105. U.S. Department of Health Education and Welfare. Statistics on blindness in the model reporting area 1969–1970. DHEW publication No. NIH 73-427. Washington, DC: U.S. Government Printing Office, 1973

106. Danielson R: The relationship of fields of vision to safety in driving, with a report of 680 drivers examined by various screening methods. Am J Ophthalmol 44:657–680, 1957

107. Feman S, Podgorski S, MK P: Blindness from presumed ocular histoplasmosis in Tennessee. Ophthalmology 89:1295–1298, 1982

108. Grey R, Burns-Cox C, Hughes A: Blind and partial sight registration in Avon. Br J Ophthalmol 73:88–94, 1989

109. Tabbara K, Ross-Degnan D: Blindness in Saudi Arabia. JAMA 255:3378–3384, 1986

110. Tommila V, Tarkkanen A: Incidence of loss of vision in the healthy eye in amblyopia. Br J Ophthalmol 65:575–577, 1981

111. Rahi J, Logan S, Timms C, et al: Risk, causes, and outcomes of visual impairment after loss of vision in the non-amblyopic eye: A population-based study. Lancet 360:597–602, 2002

112. Jakobsson P, Kvarnström G, Abrahamsson M, et al: The frequency of amblyopia among visually impaired persons. Acta Ophthalmol Scand 80:44–46, 2002

113. Stewart-Brown S, Haslum M, Butler N: Educational attainment of 10-year-old children with treated and untreated visual defects. Dev Med Child Neurol 27:504–513, 1985

114. Simons K, Reinecke R: Amblyopia screening and stereopsis. In Helveston E (ed): Symposium on Strabismus: Transactions of the New Orleans Academy of Ophthalmology. St. Louis: CV Mosby, 1978;15–33

115. da Cunha D, Jenkins E: Amblyopia in three-year-olds. Med Officer 106:146–148, 1961

116. Kaivonen M, Koskenoja M: Visual screening for children aged four years and preliminary experience from its application in practice: A preliminary report. Acta Ophthalmol 41:785–786, 1963

117. Bacharach J, Miller G, Gustafson V, et al: Vision testing by parents of 3.5-year-old children. Pub Health Rep 85:426–432, 1970

118. Neumann N, Eibschitz N, Hyams S, et al: Ophthalmic screening in child welfare clinics in Israel with particular reference to strabismus and amblyopia. J Pediatr Ophthalmol 8:257–260, 1971

119. Kostal J: Examination of pre-school age children. Cesk Oftalmol 28:46–54, 1972

120. Nawratzki I, Oliver M, Neumann E: Screening for amblyopia in children under three years of age in Israel. Isr J Med Sci 8:1469–1471, 1972

121. Köhler L, Stigmar G: Vision screening of four-year-old children. Acta Paediatr Scand 62:17–27, 1973

122. Friedman Z, Neumann E, Hyams S, Peleg B: Ophthalmic screening of 38,000 children, age 1 to 2. years, in child welfare clinics.5J Pediatr Ophthalmol Strabismus 17:261–267, 1980

123. Simpson A, Kirkland C, Silva P: Vision and eye problems in seven year olds: A report from the Dunedin Multi-Disciplinary Health and Development Research Unit. N Z Med J 97:445–449, 1984

124. Bolger P, Stewart-Brown S, Newcombe E, Starbuck A: Vision screening in preschool children: Comparison of orthoptists and clinical medical officers as primary screeners. Br Med J 303:1291–1294, 1991

125. Macpherson H, Braunstein J, La Roche G: Utilizing basic screening principles in the design and evaluation of vision screening programs. Am Orthopt J 41:110–121, 1991

126. Yazawa K, Suga J, Wakita S, et al: Tokyo Metropolitan Home Vision Screening Program for amblyopia in 3-year-old children. Am J Ophthalmol 114:416–419, 1992

127. McNeil N: Patterns of visual defects in children. Br J Ophthalmol 39:688–701, 1955

128. Frandsen A: Occurence of squint: A clinical-statistical study on the prevalence of squint and associated signs in different groups and ages of the Danish population. Acta Ophthalmol Suppl 62:1–158, 1960

129. Flom M, Neumaier R: Prevalence of amblyopia. Pub Health Rep 81:329–341, 1966

130. Vereecken E, Feron A, Evans L: Importance de la detection précoce du strabisme et de l'amblyopie (The importance of early detection of strabismus and amblyopia). Bull Soc Belge Ophthalmol 142:729–739, 1966

131. Gansner J: Zur Haufigkeit der Schielamblyopie: Statistische Erhebungen an vorschulpflichtigen Kindern einer stadtischen Bevolkerung (On the incidence of squint amblyopia: Statistical investigations of the afflicted preschool children in an urban population). Ophthalmologica 155:234–244, 1968

132. Rantanen A, Tommila V: Prevalence of strabismus in Finland. Acta Ophthalmol 49:506–507, 1971

133. Köhler L, Stigmar G: Visual disorders in 7-year-old children with and without previous vision screening. Acta Paediatr Scand 67:373–377, 1978

134. Costa M, José N, Filho M, et al: Estudo da incidencia de ambliopia, estrabismo e anisometropia em pré-es-colares. Arq Bras Oftalmol 42:249–252, 1979

135. Haase W, HP M: Schielhaufigkeit bei Hamburger Schulanfangern. Klin Monatsbl Augenheilkd 174:232–235, 1979

136. Laatikainen L, Erkkilä H: Refractive errors and other ocular findings in school children. Acta Ophthalmol 58:129–136, 1980

137. Mølgaard I-L, Biering-Søensen K, Michelsen N, et al: Amblyopia screening in kindergartners with TNO stereotest. Acta Ophthalmol 62:156–162, 1984

138. Jensen H, Goldschmidt E: Visual acuity in Danish school children. Acta Ophthalmol 64:187–191, 1986

139. Glover L, Brewer W: An ophthalmologic review of more than twenty thousand men at the Altoona Induction Center. Am J Ophthalmol 27:346–348, 1944

140. Theodore F, Johnson R, Miles N, et al: Causes of impaired vision in recently inducted soldiers. Arch Ophthalmol 31:399–402, 1944

141. Downing A: Ocular defects in sixty thousand selectees. Arch Ophthalmol 33:137–143, 1945

142. Irvine S: Amblyopia ex anopsia: Observations on retinal inhibition, scotoma, projection, light difference discrimination and visual acuity. Trans Am Ophthalmol Soc 46:527–575, 1948

143. Helveston E: The incidence of amblyopia ex anopsia in young adult males in Minnesota in 1962–63. Am J Ophthalmol 60:75–77, 1965

144. Evens M, Kuypers C: Fréquence de 1'Amblyopie fonctionnelle en Belgique (Frequency of functional amblyopia in Belgium). Bull Soc Belge Ophthalmol 147:445–449, 1967

145. Hopkisson B, Clarke J, Oelman B: Residual amblyopia in recruits to the British Army. Br Med J 285(940, 1244):1244, 1982

146. Lim H, Quah B, Balakrishnan V, et al: Vision screening of 4-year-old children in Singapore. Singapore Med J 41(6):271–278, 2000

147. Williams C, Harrad R, Sparrow J: The ALSPAC Study Team. Screening for amblyopia in preschool children: Results of a population-based, randomized controlled trial. Ophthalmic Epidemiol 8(5):279–295, 2001

148. Preslan M, Novak A: Baltimore Vision Screening Project. Ophthalmology 103:105–109, 1996

149. Kalikivayi V, Naduvilath T, Bansal A, Dandona L: Visual impairment in school children in southern India. Indian J Ophthalmol 45:129–134, 1997

150. Vyas D, Lee D: Eye conditions among 5- to 7-year-old Asian-Pacific Islander school children in Southern California. Optometry 72:426–434, 2001

151. Ohlsson J, Villarreal G, Sjöström A, et al: Visual acuity, amblyopia, and ocular pathology in 12- to 13-year-old children in Northern Mexico. J AAPOS 7:47–53, 2003

152. Flom M, Bedell H: Identifying amblyopia using associated conditions, acuity, and nonacuity features. Am J Optom Physiol Opt 62:153–160, 1985

153. von Noorden G: Classification of amblyopia. In Arruga A (ed): International Strabismus Symposium, 20th Congress of Ophthalmology. New York: S Karger, 1968

154. von Noorden G: Classification of amblyopia. Am J Ophthalmol 63:238–244, 1967

155. von Noorden G: Amblyopia: A multidisciplinary approach. Invest Ophthalmol Vis Sci 26:1704–1716, 1985

156. von Noorden G: Factors involved in the production of amblyopia. Br J Ophthalmol 58:158–164, 1974

157. Shaw D, Fielder A, Minshull C, Rosenthal A: Amblyopia: Factors influencing age of presentation. Lancet 332:207–209, 1988

158. Lang J: Management of microtropia. Br J Ophthalmol 58:281–292, 1974

159. Parks M: The monofixation syndrome. Trans Am Ophthalmol Soc 67:609–657, 1969

160. Seniakina A: Congenital disturbances of the abducens nerve and external rectus muscle and their therapy. Oftalmol Zh 27:578–583, 1972

161. Shorb S: Bilateral ametropic amblyopia resulting from bilateral cornea plana. Am J Ophthalmol 73:663–664, 1972

162. von Noorden G: New clinical aspects of stimulus deprivation amblyopia. Am J Ophthalmol 92:416–421, 1981

163. Cibis L: History of amblyopia and its treatment. Am Orthopt J 25:54–61, 1975

164. The Pediatric Eye Disease Investigator Group. A randomized trial of atropine vs patching for treatment of moderate amblyopia in children. Arch Ophthalmol 120:268–278, 2002

165. The Pediatric Eye Disease Investigator Group. A randomized trial of patching regimens for treatment of moderate amblyopia in children. Arch Ophthalmol 121:603–611, 2003

166. The Pediatric Eye Disease Investigator Group. A randomized trial of prescribed patching regimens for treatment of severe amblyopia in children. Ophthalmology 110:2075–2087, 2003

167. Newsham D: Parental non-concordance with occlusion therapy. Br J Ophthalmol 84:957–962, 2000

168. Brown M, Edelman P: Conventional occlusion in the older amblyope. Am Orthopt J 26:34–36, 1976

169. Fletcher M, Abbott W, Girard L, et al: Results of biostatistical study of the management of suppression amblyopia by intensive pleoptics versus conventional patching. Am Orthopt J 19:8–30, 1969

170. Eibschitz N, Friedman Z, Neumann E: Comparative results of amblyopia treatment. Metab Ophthalmol 2:111–112, 1978

171. Limpaecher E: Amblyopia therapy: Methods and results. Am Orthopt J 19:97–105, 1969

172. Oliver M, Nawratzki I: Screening of pre-school children for ocular anomalies: II. Amblyopia. Prevalence and therapeutic results at different ages. Br J Ophthalmol 55:467–471, 1971

173. Neumann E, Friedman Z, Abel-Peleg B: Prevention of strabismic amblyopia with early onset with reference to the optimal age for screening. J Pediatr Ophthalmol Strabismus 24:106–110, 1987

174. Iranipour B, Lithander J: Amblyopia in older children: When does the sensitive age end in humans? The XXXV Nordic Congress of Ophthalmology. Scientific Abstracts 2002:441

175. Friendly D: Preschool visual acuity screening tests. Trans Am Ophthalmol Soc 76:383–480, 1978

176. Ehrlich M, Reinecke R, Simons K: Preschool vision screening for amblyopia and strabismus: Programs, methods, guidelines. Surv Ophthalmol 28:145–163, 1983

177. Atkinson J, Braddick O: Assessment of visual acuity in infancy and early childhood. Acta Ophthalmol Suppl 157:18–26, 1983

178. Ciner E, Schanel-Klitsch E, Scheiman M: Stereoacuity development in young children. Optom Vis Sci 68:533–536, 1991

179. Dobson V, Carpenter N, Bonvalot K, Bossler J: The acuity card procedure: Interobserver agreement in infants with perinatal complications. Clin Vision Sci 6:39–48, 1990

180. Holmes J, Beck R, Repka M, et al: The Amblyopia Treatment Study visual acuity testing protocol. Arch Ophthalmol 119:1345–1353, 2001

181. Moke P, Turpin A, Beck R, et al: Computerized method of visual acuity testing: Adaptation of the Amblyopia Treatment Study visual acuity protocol. Am J Ophthalmol 132:903–909, 2001

182. Cleary M: Efficacy of occlusion for strabismic amblyopia: Can an optimal duration be identified? Br J Ophthalmol 84:572–578, 2000

183. Ellis G, Hartmann E, Love A, et al: Teller acuity cards versus clinical judgment in the diagnosis of amblyopia with strabismus. Ophthalmology 95:788–791, 1988

184. Sireteanu R, Fronius M, Katz B: A perspective on psychophysical testing in children. Eye 4:794–801, 1990

185. Friendly D, Jaafar M, Morillo D: A comparative study of grating and recognition visual acuity testing in children with anisometropic amblyopia without strabismus. Am J Ophthalmol 110:293–299, 1990

186. Lippmann O: Vision of young children. Arch Ophthalmol 81:763–775, 1969

187. Simons K: A comparison of Frisby, Random-Dot E, TNO, and Randot circles stereotests in screening and office use. Arch Ophthalmol 99:446–452, 1981

188. Kornder L, Nursey J, Pratt-Johnson J, et al: Detection of manifest strabismus in young children: I. A prospective study. Am J Ophthalmol 77:207–210, 1974

189. Ingram I: Amblyopia. Neither screening nor treatment is satisfactory (Editorial). Br Med J 298:204, 1989

190. Vinding T, Gregersen E, Jensen A, Rindziunski E: Prevalence of amblyopia in old people without previous screening and treatment: An evaluation of the present prophylactic procedures among children in Denmark. Acta Ophthalmol 69:796–798, 1991

191. Kemper A, Fant K, Badgett J: Preschool vision screening in primary care after a legislative mandate for diagnostic eye examinations. South Med J 96(9):859–862, 2003

192. Fern K, Manny R: Visual acuity of the preschool child: A review. Am J Optom Physiol Opt 63:319–345, 1986

193. Sjögren H: A new series of test-cards for determining visual acuity in children. Acta Ophthalmol 17:67–68, 1939

194. Pugmire G, Sheridan M: The visual acuity of five-year-old children. Med Officer 103:177–178, 1960

195. Ffooks O: Vision test for children: Use of symbols. Br J Ophthalmol 49:312–314, 1965

196. Allen H: A new picture series for preschool vision testing. Am J Ophthalmol 44:38–41, 1957

197. Østerberg G: A sight-test chart for children. Acta Ophthalmol 14:397–405, 1936

198. Youngson R: Anomaly in visual acuity testing in children. Br J Ophthalmol 59:168–170, 1975

199. Jonkers G: The examination of the visual acuity of children. Ophthalmologica 136:140–144, 1958

200. Ohlsson J, Villarreal G, Sjöström A, et al: Screening for amblyopia and strabismus with the Lang II stereo card. Acta Ophthalmol Scand 80:163–166, 2002

201. Aaberg T: A protocol for preschool vision testing programs. J Pediatr Ophthalmol 5:105–109, 1968

202. Frydman J, Allen P: A new and improved vision screener. J Pediatr Ophthalmol 5:96–104, 1968

203. Diskan S: A new visual screening test for school children: A preliminary test of 799 school children. Am J Ophthalmol 39:369–374, 1955

204. Borg G, Sundmark E: A comparative study of visual acuity tests for children. Acta Ophthalmol 45:105–113, 1967

205. Hedin A, Nyman K, Derouet B: A modified letter matching chart for testing young children's visual acuity. J Pediatr Ophthalmol Strabismus 17:114–118, 1980

206. Keith C, Diamond Z, Stansfield A: Visual acuity testing in young children. Br J Ophthalmol 56:827–832, 1972

207. Hall S, Pugh A, Hall D: Vision screening in the under-5s. Br Med J 4:1096–1098, 1982

208. Doran R: Assessment of vision in amblyopia. Trans Am Ophthalmol Soc U K 105:699–704, 1986

209. Campbell L, Charney E: Factors associated with delay in diagnosis of childhood amblyopia. Pediatrics 87:178–185, 1991

210. Rustia J, Barr L: Feasibility of screening young children in day care centers: A preliminary investigation. Pub Health Rep 101:191–201, 1986

211. Schmidt P: Effectiveness of vision-screening in preschool populations with preferential-looking cards used for assessment of visual acuity. Optom Vis Sci 68:210–219, 1991

Back to Top