Chapter 69
Health Economics for the Busy Ophthalmologist
ANDREW F. SMITH
Main Menu   Table Of Contents

Search

EFFICIENCY, EQUITY, AND UTILITY
ANALYTIC TECHNIQUES OF HEALTH ECONOMIC EVALUATION
FURTHER NOTES ON THE DERIVATION OF HEALTHCARE COSTS
CRITICS OF COST DETERMINATION
OPHTHALMOLOGIC EVIDENCE
REFERENCES

How should eyecare treatment and blindness prevention programs be organized? How much money should be spent on specific eyecare interventions and which are the most beneficial of these interventions? How does one measure the cost and effectiveness of various ophthalmic interventions? Which diagnostic eye tests are more useful to perform than others? How does one balance the efficacy of an ophthalmic intervention with its cost? As a practicing ophthalmologist, what is one's role in the economic aspects of the delivery of eyecare and the prevention of blindness and vision loss? These are but a few of the myriad of difficult questions faced daily by those involved in the delivery of eyecare services, chief among them the ophthalmologist. Not surprisingly, there are, of course, a range of possible answers to such questions, most of which might seem rational and appropriate. More often than not, however, the answers, which are actually implemented, are made without having all the facts at one's disposal. The decision-making process is further complicated by a seeming lack of knowledge as to what pieces of information are most helpful to the economic decision-making process. The goal of this chapter, therefore, is to provide a brief description of some of the main ideas and techniques used by professional health economists to enhance the decision-making process pursued by both health policymakers in general and the busy clinician ophthalmologist in particular. This said, one should be wary of the fact that although the dictates of economic science may appear to be generally applicable in certain situations, their rigid application to healthcare is not without potential problems.
Back to Top
EFFICIENCY, EQUITY, AND UTILITY
To begin, it is necessary to provide a grasp of the main economic concepts used to situate the reader in the “health economist's mindset.” It is useful to provide a working definition of economics. Essentially, economics is concerned with the distribution and allocation of scarce resources throughout society. Fundamental to this process is the concept of resource scarcity, meaning that the ability to satisfy one's wants and desires is not unlimited; even given all the money in the world, constraints always exist, whether we like them or not. As such, economists have defined the “real cost” of performing a given activity relative to other potential opportunities in which an individual might have been engaged. The concept of “opportunity cost” is of vital importance to economic thinking, since it forces one to think of the next best available use for a given set of resources. From a policy perspective, for example, should resources be spent on treatment x versus treatment y. Such a set of events imposes that a necessary “trade-off” be made between x and y. The goal of economics here is to evaluate both programs (x and y) in terms of efficiency, that is, how to get the most out of each program given a backdrop of limited or scarce resources, which are either directly viewed as healthcare inputs, inputs to sectors that have healthcare benefits (e.g., education or health insurance schemes), or inputs to society's general well-being as a whole.

There are three main principles of efficiency:

  1. Do not waste scarce resources.
  2. Produce each output at the lowest possible cost.
  3. Produce those goods and services that people value the most.

When some portion of those resources can be used to produce other goods and services, then the system is deemed to be operating at “technical efficiency.” When one has to increase the resources, one has to commit to a given venture, then one is said to be technically inefficient. “Allocative efficiency,” by contrast involves taking into account the concept of cost-effectiveness (CE), in which the decision taken is essentially an economically sound one. As such, allocative efficiency hinges on making appropriate value judgments about how to allocate resources. To assist us, the famous late-nineteenth century economist, Vilfredo Pareto, proposed that allocative efficiency is “attained when it is not possible to change the allocation of resources to make any one person better off without making at least one other person worse off.” Furthermore, one can identify two factors that modify or influence efficiency, namely (1) individual welfare, in which the individual decides which goods and services to consume, and (2) the available level and distribution of income in the economy. Hence, the Pareto criterion may be restated to read “that there is no unique allocation of resources such that there is only one allocatively efficient solution. Instead, there are a range of efficient allocations, one for each different combination of wealth and income.” Overall, the concept of the Pareto criterion is more theoretical than practical, since most changes in resource allocation have negative consequences and do, in fact, make certain segments of society worse off; that is, for any health policy change, there are both winners and losers.

Essentially, health economics is concerned with discovering the best or most efficient means of allocating scarce healthcare resources to yield a given healthcare policy objective, such as reducing infant mortality, and so forth. The concept of equity or fairness significantly affects the decision to pursue various healthcare strategies or interventions and often is at odds with the concept of allocative efficiency. At this point, it is worth introducing the concept of “distributive equity,” since it forces decision makers to be concerned with where the final healthcare resources end up rather than how the resources are apportioned. In this respect, it is further useful to consider the twin concepts of horizontal and vertical equity in our dissection of the concept of distributive equity.

Horizontal equity relates to the manner in which the scholars of the day believed that it was important to distribute an equal amount of goods and services to individuals who have similar economic circumstances. Under this view, the aim of efficiency is to achieve an equal distribution of healthcare resources to ensure that individuals with similar healthcare needs and costs obtain a similar amount on a per-capita basis. Vertical equity, by contrast, relates to the desire to distribute unequal amounts of healthcare resources among differently situated individuals in relation to the degree to which they are experiencing different healthcare situations. Thus, under this view, those segments of society with greater healthcare needs would receive a greater share of the total healthcare budget. The goal of health economics is to attempt to quantify the potential end users of such healthcare resources and so determine what sort of strategy is to be pursued, be it striving toward either horizontal or vertical equity.

Traditionally, health economists have been guided in their attempts to allocate scarce resources efficiently to maximize an individual's human capital. However, the human capital approach, as it is known, is not without its detractors, since it fails to take into account a number of important factors. Sick and mentally or physically disabled persons are always undervalued in terms of economic productivity to the economy. In addition, the human capital approach fails to take into account such factors as the wage gap, especially between the genders and different ethnic groups. As a consequence, some economists have argued that days of healthy life gained through the introduction of a particular healthcare intervention or technique need to be weighted according to the, age, sex, and ethnic group wage rate for those persons who are affected.1

An equally fundamental principle of economics is the concept of “utility maximization,” in which each individual consumer seeks to derive as much satisfaction or happiness from the consumption of goods and services as possible. However, eventually, each consumer reaches a point at which he or she no longer derives the same degree of utility or satisfaction from the consumption of a given bundle of goods and services. The point beyond which individuals cease to derive increasing utility is called the law of diminishing marginal utility (Table 1 and Fig. 1). For example, consider the case of little Johnny eating an ice cream cone. After the first or second cone, Johnny's utility probably is still quite high; however, by the ninth or tenth ice cream cone, Johnny probably is feeling quite sick. Alas the law of diminishing marginal utility has a real-life example.
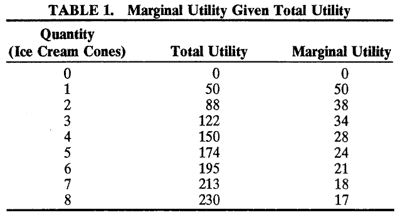
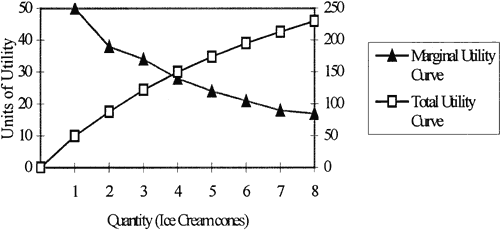


Fig. 1. Total and marginal utility.

Back to Top
ANALYTIC TECHNIQUES OF HEALTH ECONOMIC EVALUATION
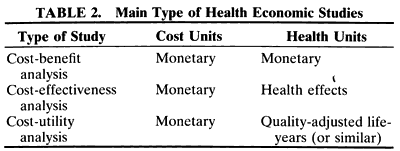
Any comprehensive economic evaluation of a healthcare intervention or proposed strategy requires two essential ingredients: (1) being able to precisely measure and (2) precisely value the cost and outcomes of the competing healthcare alternatives. Often, one is simply interested in comparing the existing technique with a proposed intervention or new technique. Overall, there are essentially three types of economic evaluation techniques: (1) cost-benefit analysis, (2) CE analysis (CEA), and (3) cost utility analysis (CUA) (Table 2).


COST-BENEFIT ANALYSIS

Cost-benefit analysis (CBA) is used to evaluate the overall allocative efficiency of a healthcare intervention or program. Using this form of analysis, the goal is to determine whether it is appropriate to expend society's resources on a given healthcare intervention or technique versus either the existing method or no available alternative. By examining each individual healthcare program or proposed intervention, the aim of CBA is to determine whether the benefits outweigh the opportunity costs associated with the healthcare intervention or strategy. To answer such a question, it is necessary to ensure that cost-benefit calculations are reported in the right units, namely, monetary units over monetary units. The challenge in using CBA is to be able to convert health benefits into monetary units.

Traditionally, the valuation of health benefits into monetary units was approximated using the human capital approach, in which the individual was solely measured for his or her economic productivity and all that mattered was how much income he or she was able to generate with a given health benefit. In this sense, productivity is normally measured in terms of labor costs, in this case, one's future stream of economic earnings. Not surprisingly, with the human capital approach, rigidly applied, there is great difficulty in adequately gauging the economic “worth” or productivity of retirees, homemakers, and unemployed persons.

An alternative to the human capital approach is to ask patients themselves how much they would be willing to pay for improvements in their health status. This approach uses the “contingent valuation” approach to gauge the relative market price in circumstances for which there is no established price value as such. Although there is a certain amount of controversy surrounding the use of willingness-to-pay (WTP) methodologies, it is nevertheless one of the few means of directly translating health benefits into monetary terms. WTP is not, however, without its critics.

First, WTP is highly sensitive to income levels. Wealthier people have more ability to pay and, as such, may be more likely to pay for medical treatment. Second, under those healthcare systems that are government financed through the collection of taxes, the end user, or patient, of healthcare resources does not have to pay out of his or her pocket for the healthcare treatment that is received. This set of events is likely to influence the valuations for healthcare placed by persons living within such public healthcare systems. Furthermore, it often is exceedingly difficult for patients to translate the healthcare intervention they are receiving into corresponding increases in personal utility values and, hence, into monetary units. Despite the above-mentioned measurement problems inherent with the WTP methodology, WTP studies as a whole are becoming increasingly more refined and useful in assisting health economists and others in making informed healthcare allocation decisions. By calculating the costs and benefits associated with a variety of healthcare programs, it is possible to determine the various “tradeoffs” that would result from their possible implementation. Calculations of this type are especially useful against the backdrop of allocating scarce healthcare resources.

COST-EFFECTIVENESS ANALYSIS

Of the three main forms of economics analysis that are regularly used, CEA is perhaps the most often used. First, unlike CBA, CEA does not require healthcare benefits to be converted into monetary units. Overall, CEA deals with the technical efficiency of the healthcare intervention and questions relating to the best way to reach a certain defined healthcare goal or objective. Implicitly, therefore, CEA always involves a comparison between at least two options that have the same healthcare goal or objective in mind. Analytically, it is possible to compare competing healthcare objectives simply on the basis of examining the difference in the cost of attaining a fixed gain or increment in health benefit. The difficulty here arises from the fact that it may be very difficult to ensure that all of the competing healthcare interventions or strategies or both actually yield the same fixed gain in health benefit.

The alternative to the above method of interpreting CEA is to compare a range of CE ratios that have been produced for a range of competing healthcare interventions. The goal here is to select the CE ratio that yields the lowest overall cost per unit of healthcare benefit, or health effect gained. Typically, health effects are measured in relation to some final health outcome, such as life-years saved, or life-years gain, or death averted. Thus, given the constraints imposed by the imposition of a given healthcare budget, the CE ratio provides a measure of which healthcare intervention or strategy would yield the greatest improvement in health benefits for a given population as a whole. One of the main drawbacks of using CEA is that it only allows for comparisons to be made between health-care interventions with similar health outcomes. Care, therefore, needs to be taken when selecting what type of healthcare outcomes are going to be used in the analysis. One can well imagine the practical difficulties arising from having to translate sight-years saved, for example, into life-years gained, and so forth. It is for this precise reason that CEA cannot be used to compare healthcare interventions or strategies with different end goals or objectives.

COST-UTILITY ANALYSIS

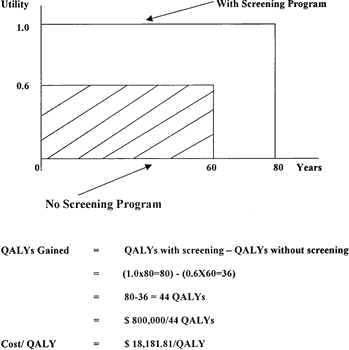
The advantage of CUA over either CBA or CEA is that it can be used to measure both technical and allocative efficiency, provided that it is measuring allocative efficiency solely within the healthcare sector. The main outcome measure is “healthy years,” which is derived by converting years of life in states of less than “full or normal health,” that is, in diseased states. This is accomplished by converting years of life spent in various health states to quality-adjusted life-years (QALYs) and achieved by combining life-years gained as a result of a given health-care intervention, or strategy with a determination of the quality of these life-years. Thus, assuming that health-related quality of life can be valued on a continuous scale from 0 to 1, 0 represents death and 1 represents perfect health. Under this framework, 5 years of life with a health state of 0.2is equivalent to 1 full year in perfect health (5 × 0.2 = 1). For example, suppose a healthcare agency is evaluating whether to implement a screening program for diabetic retinopathy and has determined that without the screening program, the number of QALYs earned by the population is 36 (i.e., 0.6 × 60). However, if a screening program is implemented, the number of QALYs increases to 80(1.0 × 80). Thus, there was a gain of 44 QALYs (i.e., 80 - 36 = 44). Assuming that the entire screening program cost $800,000, then the cost per QALY would be 800,000/44, or $18,181.81 (Fig. 2). There are other utility scales, including the handicap-adjusted life-years and the disability-adjusted life-years scales, both of which have been used in ophthalmology.2 Overall, CUA enables comparisons to be made among competing healthcare programs, provided that these programs are restricted to the healthcare sector. Thus, QALYs cannot be used to measure allocative efficiency if both healthcare and nonhealthcare sectors are being compared.

Fig. 2. Quality-adjusted life-years.

Back to Top
FURTHER NOTES ON THE DERIVATION OF HEALTHCARE COSTS
As is to be expected, all of the former varieties of health economic analyses rely on the calculation of both the costs and the healthcare benefits or health effects of the healthcare intervention under investigation. In essence, there are three stages to deriving the cost components of a health economic study: (1) identification, (2) measurement, and (3) valuation of cost data.

COST IDENTIFICATION

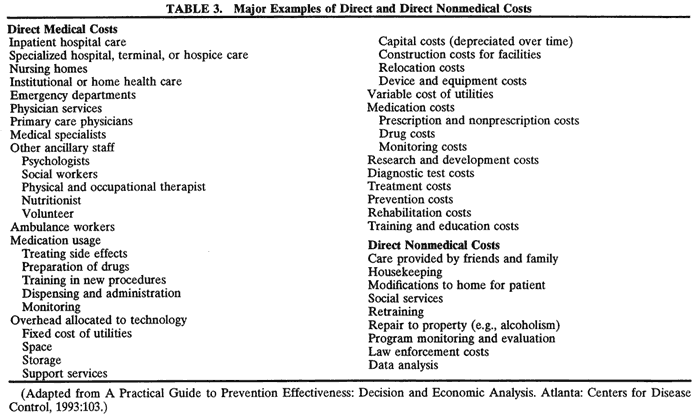
With respect to the first stage, the identification of costs may be further divided into three categories: (1) health system costs, (2) patient-based costs, and (3) external and intangible costs.3 Health system costs are those associated with the “organization and operating costs within the healthcare sector.”4 Health system costs also may be thought of as direct costs, since these are relatively easily measured in comparison to patient-based costs (Table 3).


Direct costs account for such items as hospitalizations, drugs costs, physician's fees, laboratory costs, rehabilitation, and long-term care costs. Direct costs come in the form of charges, and the true medical costs may be obscured or difficult to measure, since they do not empirically measure the forgone opportunity cost of using these resources for other purposes. Direct costs can either be fixed (e.g., land or capital) or variable costs (e.g., labor). Costs such as hospital buildings, for example, are assumed to be inflexible in the short run and, thus, are fixed. Variable costs are more flexible in the short term, that is, they can be increased or reduced with much greater ease, as in the case of hospital staffing needs.

Patient-based costs are derived from “costs borne by patients and their families, (and include) out-of-pocket expenses, patient and family input into treatment, time lost from work, and “psychic costs” attributable to pain and suffering.”3 Nonmedical costs such as transportation and support for ancillary workers, homecare workers, and other out-of-pocket expenses may be included to gain an overall picture of the costs of a given healthcare intervention from the patient's perspective (Table 4). The next step is to measure the costs of the healthcare interventions or program being pursued.


COST MEASUREMENT

Measuring healthcare costs is a demanding process and rests on ensuring that the cost inputs selected for analysis are “measured in appropriate physical and natural units.”3 Adding up all the cost components may yield overlapping areas of similar resource use, such as two variously busy clinics (one a very busy clinic and the other a not-so-busy clinic). In this case, it becomes difficult to separate the actual amount of overhead expenses (e.g., electricity, heat, rent of hospital space), which is being consumed separately. The goal here is to make a reasonable estimate of the various amounts involved, including such matters as the number of employees, the size or area of clinic space used, and the number and volume of patients seen.

The calculation of specific measures of health outcomes allows comparisons to be made with other healthcare interventions. The final cost category is bound up in the appropriate valuation of costs, namely attempting to measure as precisely as possible the cost of all healthcare inputs, whether these are incurred in the present or the future.

COST VALUATION

Healthcare valuation of costs is achieved using local currency and local prices for goods and services and is normally approximated by healthcare charges and parameters set by healthcare authorities or private insurers through negotiations between the providers of healthcare and government or private agencies. Generally speaking, both current and future healthcare costs are valued in constant monetary terms to remove the potentially confounding effects of inflation. The concept of constant dollars, for example, is related to inflation, time preference, and consumption. Thus, if inflation is running at 5%, a dollar today is worth more than what it will be in a year's time. To correct for this, economists adjust the price accounts with price indexes. Because we would prefer to value goods today and pay later, the time patterns of costs and benefits are important, as costs and benefits are made equivalent in time by the use of discounting. Thus, to reduce the value of future paths of costs and benefits derived from goods and services, we discount. Thus, $5000 today is worth more than $5000 in 3 years because of our time preference. Under such circumstances, a discount rate is used to convert future costs and benefits into equivalent present values. Typically, 5% to 6% rates per annum are used for costs and similar rates per annum are used for benefits. Often a zero discount rate, or a rate lower than that used, is adopted during subsequent sensitivity analysis. Moreover, a lower discount rate is advocated by some health economists to not penalize governments from initiating preventive programs and because empiric evidence would suggest its use.

In summary, the four main approaches to the valuation of costs include (1) using market prices, be they actual or proxies from some reference point; (2) computing the time lost by patients as some measure of indirect costs; (3) using disability and rehabilitation payments to estimate lost productivity; and (4) reviewing policymaker's overall perceptions of costs, whenever possible. It must be remembered that proxy costs are never 100% of the actual costs. Moreover, it is difficult to be certain that these costs always represent the actual opportunity costs per se. One must be aware of these limitations when attempting to use the concept of opportunity costs in any analysis.

SENSITIVITY ANALYSIS

Given the potential for actual or accidental uncertainties contained in the information used to conduct cost-effective analyses, the data used to derive the information often are subjected to the rigors of a sensitivity analysis, in which a range of plausible numeric values are run through the economic model to simulate real-world imprecision, both in the quality of the data and in that of the economic model itself. Typically, sensitivity analyses are performed to highlight a range of possible economic outcomes that might arise from the analysis per se. Sensitivity analyses are particularly useful in determining the robustness of the overall CEA. Finally, it is important that CE analyses should be situated within an overall study perspective and timeframe.

Study Perspective

A pivotal feature to take into account when conducting a cost analysis is the perspective from which the costs are measured, be it a national, regional, or municipal government perspective; that of an employer; an insurance company; a health maintenance organization; or the individual's perspective such as that of a physician or a patient. The perspective adopted in most forms of health economic analyses is the societal or governmental perspective since this allows healthcare resources to be allocated to maximize social welfare.5,6 Equally, it is important to indicate the time over which the costs of any healthcare intervention or program are distributed.

Timeframe

The timeframe over which a healthcare program is to be implemented can affect the costs of any intervention. Consequently, it is necessary to determine the so-called analytic horizon (i.e., the time over which the costs and effects of a given health-care intervention or program are derived). Costs, forexample, may begin before the healthcare intervention, such as those incurred in the construction of new clinics and medical facilities to see patients, while other costs may be ongoing in the form of salaries for medical staff and equipment. In general, the analytic horizon of a given economic analysis should last long enough to capture that portion of time during which individuals are affected by the healthcare intervention or program and any benefits that such interventions continue to yield in the form of positive health outcomes for those individuals enrolled in the healthcare intervention or program. Despite the best attempts at conducting as precise a CEA as possible, several criticisms with this approach to the calculation of costs exist.

Back to Top
CRITICS OF COST DETERMINATION
Calculation of the loss of potential income often is problematic to the degree that persons with lower expected lifetime income levels have lower economic values for their lives than those persons with higher expected income levels. Equally, if patients believe that they are at an increased risk of a particularly poor health state, they may be more willing to pay for care than those who do not have the same valuation of their current, or future, health status.

Although the issues surrounding the use of indirect costs are complex, it is important to acknowledge the potential impact that productivity losses due to “morbidity costs” and “mortality costs” may have on the calculation of the overall indirect costs of a disease.7 Morbidity costs are the costs associated with lost or reduced ability to function as a “normal” healthy person, both on the job and during one's leisure time. Mortality costs are the costs attributed to lost productivity because of early death.

Morbidity costs typically arise as a consequence of lost productivity due to time spent recuperating or convalescing. Typically, too, in the case of a disabled person, there is the cost of time spent by family members or others caring for the affected individual, a cost that is rarely captured in formal economic analyses.8

Mortality costs arise from changes in overall life expectancy as a result of the presence or absence of a given healthcare intervention or program. There is, understandably, some debate as to which productivity costs are capable of being easily measured.9,10 The measurement of lost productivity is dependent on the manner in which the information is collected, such as whether certain items are included or excluded in a questionnaire, because this can significantly influence the reporting of the overall magnitude of productivity losses.

Back to Top
OPHTHALMOLOGIC EVIDENCE
It is useful to consider the main health economic findings in ophthalmology over the past decade. As shall be seen, little has been done in this area, and much has not followed rigorous health economic guidelines. Table 5 summarizes the main health economic studies, principally CE studies, in ophthalmology conducted over the past decade or so. As can be seen, vitamin A supplementation,11 cataract surgery,12–15 and trichiasis surgery for trachoma16 are among the most cost-effective of all evaluated ophthalmic interventions. The figures for the CE of cataract surgery were derived from a detailed examination of the cost of attaining a given outcome, namely the successful removal of the cataract lens. The next most cost-effective ophthalmic interventions are those that involve screening for diabetic retinopathy,17 followed closely by screening strategies for glaucoma18 and treating threshold retinopathy of prematurity.19 Those studies designed to measure the CE of screening for diabetic retinopathy generally have used existing epidemiologic data on the incidence, prevalence, and overall progression of diabetic retinopathy in the absence of any screening examination and compared the results with the outcome achieved by complying with various diabetic eyecare screening guidelines. It is interesting too to note that studies presented include the main causes of blindness and vision loss, namely cataract, trachoma, glaucoma, and diabetic retinopathy. Moreover, it should be pointed out that Laupacis and colleagues20 have shown that health interventions less than $20,000 per QALY are worthy of implementation by society. Using this guideline of CE, it is immediately apparent that all of the eyecare interventions highlighted in Table 5 should be regarded as highly cost-effective. This is especially important if one considers that most of the world's cataract blindness and trachoma blindness occur in developing countries, where it would be wise to adopt those eye healthcare interventions that are highly cost-effective.

It is hoped that this brief introduction to health economics and the results of past economic studies in ophthalmology filter their way into the hands of those attempting to reduce the burden, both social and economic, associated with vision loss and blindness in both developed and developing countries. As new information becomes available on the costs and benefits of new ophthalmic interventions, such information will result in more informed health economic decisions in the fight against all forms of vision loss and blindness.

Back to Top
REFERENCES

1. Barnum H: Evaluating healthy days of life gained from Health projects. Soc Sci Med 24:833–841, 1987

2. Busbee BG, Brown MM: Incremental cost-effectiveness of initial cataract surgery. AAO Final Program 2000:107

3. Drummond MF, Stoddart GL, Torrance GW: Methods for the economic evaluation of the Economic Evaluation of Health Care Programmes. Oxford: Oxford University Press, 1996

4. Russell LB, Siegel JE, Daniels N et al: Cost-effectiveness analysis as a guide to resource allocation in health: Roles and limitation. In Gold MR, Siegel JA, Russell LB, Weinstein MC (eds): Cost-Effectiveness in Health and Medicine. New York: Oxford University Press, 1996:3–24

5. Eisenberg JM: Clinical economics: A guide to the economic analysis of clinical practices. JAMA 262:2879–2886, 1989

6. Detsky A, Naglie IG: A clinician's guide to cost-effectiveness analysis. Ann Intern Med 113:147–154, 1990

7. Luce BR, Manning WG, Siegel JE et al: Estimating costs in cost-effectiveness analysis. In Gold MR, Siegel JA, Russell LB, Weinstein MC (eds): Cost-Effectiveness in Health and Medicine. New York: Oxford University Press, 1996:176–213

8. Garber AM, Weinstein MC, Torrance GW et al: Theoretical foundations of cost-effectiveness analysis. In Gold MR, Siegel JA, Russell LB, Weinstein MC (eds): Cost-Effectiveness in Health and Medicine. New York: Oxford University Press, 1996:25–50

9. Weinstein MC, Siegel JA, Garber AB et al: Productivity costs, time costs health-related quality of life: A response to the Eramus Group. Health Econ 6:505–510, 1997

10. Brouwer WBF, Koopmanschap M, Rutten FFH: Productivity costs in cost-effectiveness analysis: A further discussion. Health Econ 6:511–514, 1997

11. Bobadilla J-L, Cowley P, Musgrove P et al: Design, content and financing of essential national package of health services. In Murray CJL, Lopez AD (eds): Global Comparative Assessments in the Health Sector: Disease Burden, Expenditures and Intervention Packages. Geneva: World Health Organization, 1994:171–180

12. Asimakis P, Coster DJ, Lewis DJ: Cost effectiveness of cataract surgery. A comparison of conventional extracapsular surgery and phacoemulsification at Flinders Medical Centre.Aust NZ J Ophthalmol 24:319–325, 1996

13. Creswell PA, Allen ED, Tomkinson J et al: Cost-effectiveness of a single-function treatment center for cataract surgery. J Cataract Refract Surg 22:940–946, 1996

14. Marseille E: Cost-effectiveness of cataract surgery in a public health eye care programme in Nepal. Bull WHO 74:319–324, 1996

15. Murthy GV, Sharma P: Cost analysis of eye camps and camp-based cataract surgery. Nat Med J India 7:111–114, 1994

16. Evans TG, Ranson MK, Kyaw TA et al: Cost-effectiveness of and cost-utility of preventing trachomatous visual impairment: Lessons from 30 years of trachoma control in Burma. Br J Ophthalmol 80:880–889, 1996

17. Javitt JC, Aiello LP: Cost-effectiveness of detecting and treating diabetic retinopathy. Ann Intern Med 124:164–169, 1996

18. Boivin JF, McGregor M, Archer C: Cost-effectiveness of screening for primary open angle glaucoma. J Med Screening 3:154–163, 1996

19. Brown GC, Brown MM, Sharma S et al: 1999 Cost-effectiveness of treatment for threshold retinopathy of prematurity. Pediatrics (online) 104:1–14, 1999 (http://www.pediatrics.org/cgi/content/full/104/e47)

20. Laupacis A, Feeny D, Detsky AS et al: How attractive does a new technology have to be to warrant adoption and utilization? Tentative guidelines for using clinical and economic evaluations.Can Med Assoc J 146:473–481, 1992

Back to Top