|
|
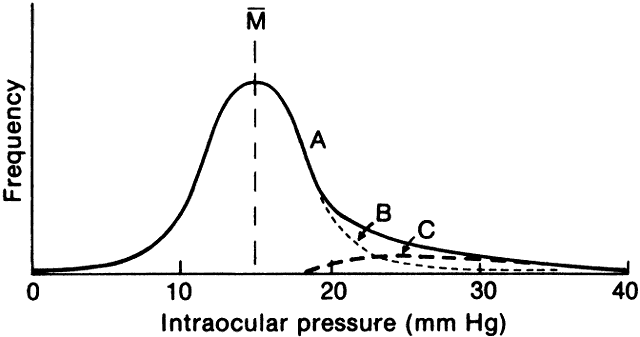
| Fig. 3. Distribution of intraocular pressure in population. Line A indicates the frequency distribution of intraocular pressures in the population. Notice that the distribution is skewed (tailed) to the right. Theoretically, the tail could be made up of two subpopulations. Dotted line B represents the “normal” population completing a gaussian distribution. Line C represents the abnormal population, which added to the normal population produces the tail. |