
|
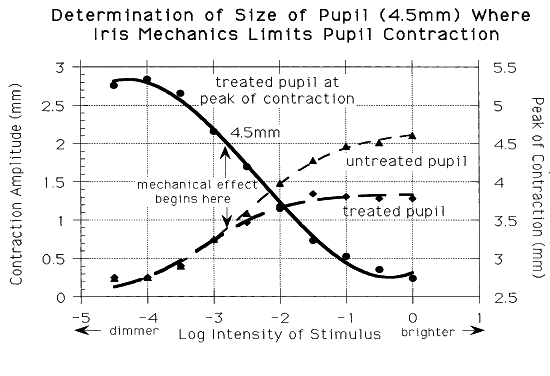
| Fig. 4. The contraction amplitudes of the treated and untreated pupils from the pupillograms in Figure 3 are plotted as a function of stimulus light intensity. The treated pupil starts to contract less as its excursion begins to enter the mechanical nonlinear range, causing the response curves of the two pupils to come apart. The third line that decreases with stimulus intensity is the size of the smaller pupil at the peak of contraction (see Y2 axis at right). From this line, it can be seen that the two response curves of the right and left pupil start to diverge at a pupil size of 4.5 mm, where iris mechanics start to play a role in this particular subject. |