
|
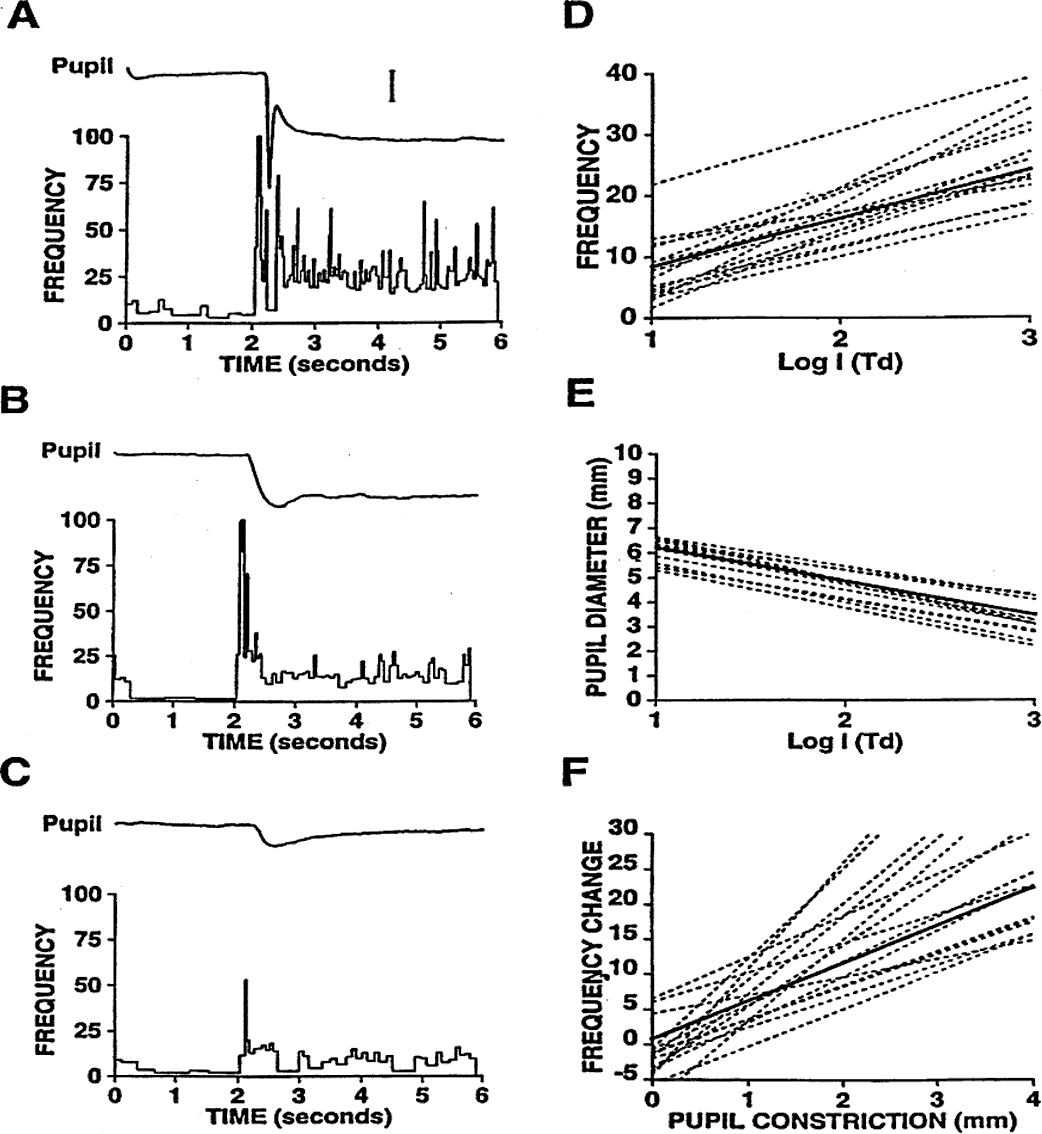
| Fig. 14. A to C. Response of a pretectal luminance neuron to stimuli of 1000 trolands, 100 trolands, and 10 trolands, respectively. Note that in A, a blink occurs during the dynamic phase of pupilloconstriction. D. The change in neuronal firing rate for 16 individual pretectal luminance neurons is plotted against the logarithm of retinal illuminance. The responses of the neurons were essentially linear over this range, and linear regression analyses yielded correlation coefficients ranging from r = 0.81 to r = 0.99, with a mean correlation coefficient of r = 0.92. The solid line in D is a regression line fitted to the data from all 16 neurons. In E, pupil diameter is plotted against the logarithm of retinal illuminance. The data were obtained while recording the luminance responses of each of the 16 cells shown in D. The solid line in E is a regression line fitted to the pooled data. For the 16 luminance neurons, F shows the mean change in neuronal firing rate as a function of pupilloconstriction. The response of the neurons was essentially linear over this range, and linear regression analyses yielded correlation coefficients from r = 0.8 to r = 0.98, with a mean correlation coefficient of r = 0.9. The solid line in F is a regression line fitted to the data from all 16 neurons. Scale bar, 1-mm pupilloconstriction (Gamlin PDR, Zhang H, Clarke RJ: Luminance neurons in the pretectal olivary nucleus mediate the pupillary light reflex in the Rhesus monkey. Exp Brain Res 106:177, 1995) |