|
|
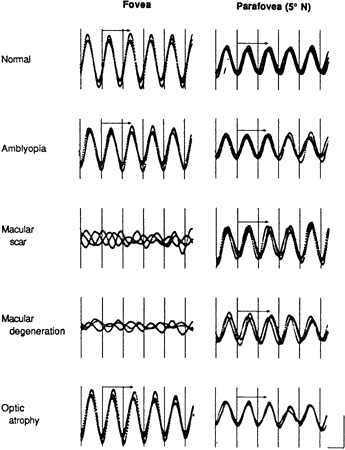
| Fig. 8. Foveal and parafoveal cone electroretinograms from a normal subject and four patients with visual acuity of 20/200. Two or three consecutive computer summations (n = 128) are shown. Vertical lines denote stimulus onset; arrows denote b-wave implicit time to corresponding response peak. Calibration symbol in lower right corner denotes 20 msec horizontally and 0.25 μV vertically. (Jacobson SG, Sandberg MA, Effron MH, Berson EL: Foveal cone electroretinograms in strabismic amblyopia. Trans Ophthalmol Soc UK 99:353–356, 1980) |