
|
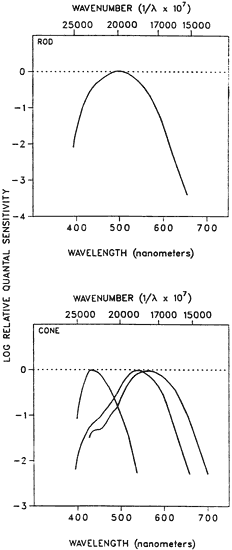
| Fig. 2. Estimated absorption spectra of the rod (top) and the three cone photopigments. These curves are derived from human psychophysical experiments. All curves are normalized to their own maxima. (Based on data from Smith VC, Pokorny J: Spectral sensitivity of the foveal cone photopigments between 400 and 500 nm. Vision Res 15:161, 1975; presented in Hood DC, Finkelstein MC: Sensitivity to light. In Boff KR, Kaufman I, Thomas JP [eds]: Handbook of Perception and Human Performance, pp 1–5, 66. New York: Wiley, 1986.) |