
|
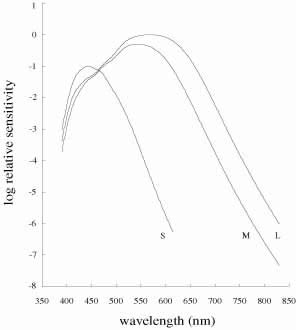
| Fig. 4 Estimates of human cone fundamentals underlying normal color vision. The heights of the curves reflect the relative numbers of S, M, and L cones. Data are based on normal trichromatic color matching data, and on data from dichromats and blue cone monochromats. The optical density of cone pigments and the lens and macular pigment absorptions have all been taken into consideration in generating these fundamentals. Data are energy-based. From the tabulated data of Stockman and Sharpe (http://cvrl.ioo.ucl.ac.uk/). (Stockman A, Sharpe LT, Fach CC. The spectral sensitivity of the human short-wavelength cones. Vision Res 39, 2901–2927, 1999; Stockman A, Sharpe LT. Spectral sensitivities of the middle- and long-wavelength sensitive cones derived from measurements in observers of known genotype. Vision Res 40, 1711-1737, 2000.) |