
|
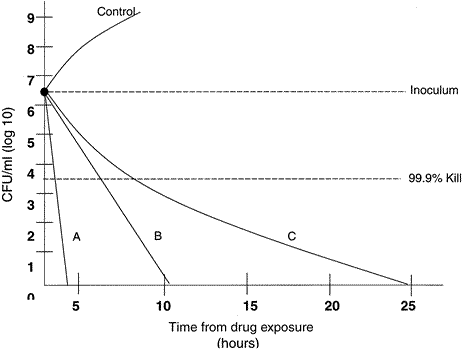
| Fig. 3. Time-Kill Curve. Broth cultures inoculated with 5 × 10⁶ CFU/mL are incubated and then exposed to different antibiotics or to a control solution. The graph above illustrates different time-kill curves for antibiotics A, B, and C. These antibioticsC could also represent different concentrations of the same antibiotic. The end point is the time to a bactericidal effect, which is considered a 3-log reduction or 99.9% kill. |