|
|
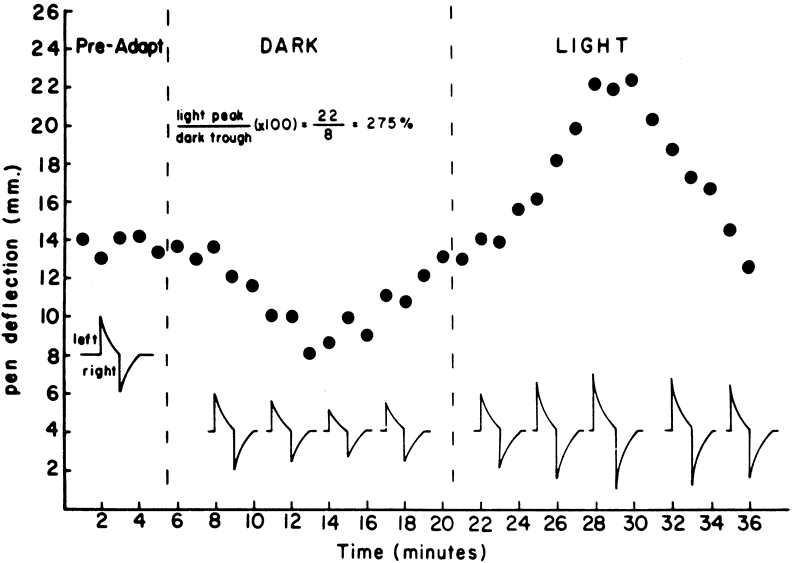
| Fig. 2. Graphic representation of the electro-oculogram (EOG) at various periods of adaptation. The black circles represent the average pen swing amplitude of several saccades taken at that period of time. Insert shows how an individual saccade might appear at certain time periods with a decrease in darkness and increase in light. The greatest EOG amplitude achieved in light (light peak) is divided by the lowest amplitude in the dark (dark trough) and the calculated ratio is expressed as a percent. (Carr RE, Siegel IM: Visual Electrodiagnostic Testing. Baltimore: Williams & Wilkins, 1982) |