
|
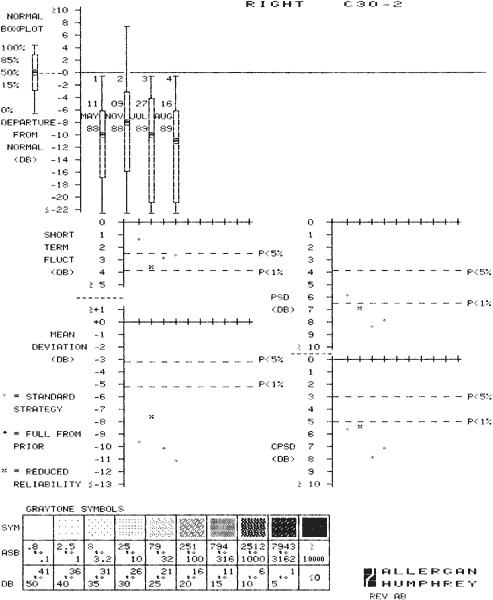
| Fig. 18. This change analysis printout provides an analytic summary of changes in the visual field over time. Deviations of threshold (mean and range) are presented in the form of a box plot analysis (top). This box plot is a modified histogram that gives the 100th, 85th, 15th, and zero percentile as well as median differences of threshold sensitivities at all points tested. A normal box plot is provided for comparison. Each of the four global indices for each of the four fields being analyzed is plotted over time (lower four graphs) using symbols that identify the strategy employed in testing and whether the reliability of the test was adequate. To aid in interpretation, P < 5% and P < 1% limits are offered. |