Chapter 34
Biology of the Eye as an Optical System *
KARLA ZADNIK and DONALD O. MUTTI
Main Menu   Table Of Contents

Search

AXIAL LENGTH AS THE DETERMINANT OF REFRACTION
REFRACTIVE ERROR DISTRIBUTIONS
OPTICAL COMPONENTS OF REFRACTION
REFRACTION AND ITS COMPONENTS DURING THE GROWTH OF THE EYE
HEREDITY
REFERENCES

Theoretically, ametropia might result from an anomalous dioptric apparatus or from an abnormal axial length of the globe. A dioptric apparatus that brings parallel rays of light to focus either in front of or behind the retina produces myopia or hyperopia, respectively. Obviously, the concept of too strong or too weak a refracting system is relative to a fixed axial length, but ametropia could equally well arise from a fixed dioptric power of an eye and a variable axial length. It is also obvious that refractive errors might arise from a mismatch between these two factors, and there is evidence to support each of these three views. In fact, ametropia is sometimes classified as being refractive, axial, or combination in type.

Back to Top
AXIAL LENGTH AS THE DETERMINANT OF REFRACTION
These theoretic possibilities have considerable practical implications. For almost the past 100 years, it has been widely accepted that refractive error is generally the result of anomalies in axial length.1–4 For all practical purposes, the hyperopic eye is a short eye, and the myopic eye is a long eye, although a mismatch between an eye's axial length and its dioptric power also results in ametropia.2 These assumptions have led to an enormous amount of work aimed at disclosing the mechanism whereby the axial length of the eye remains short in some cases and grows abnormally long in others, with most attention having been given to the latter question.5

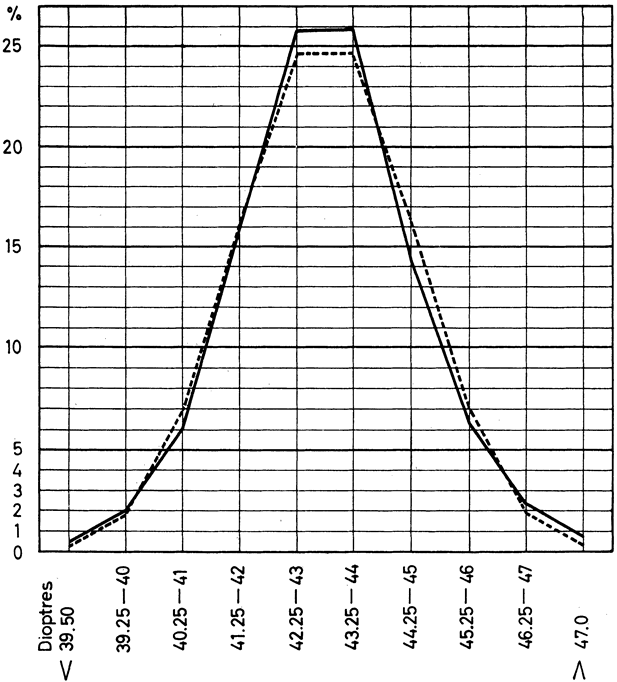
Steiger6 broke with the older views on the nature of emmetropia and refractive error. No longer regarding average values as constants, he postulated instead a wide range of refractive errors on the basis of distribution actually observed in the corneas of 5000 eyes, that is, a distribution conforming to a normal (or binomial) curve (Fig. 1). His measurements, which showed corneal values extending from 39 to 48 diopters (D) and a lack of any fixed corneal value for emmetropia, enabled Steiger to calculate the axial length in emmetropia as theoretically extending from 21.5 to 25.5 mm.

Fig. 1. The normal (binomial) distribution of power of cornea in 5000 eyes in boys. (Steiger A: Die Entstehung der sphärischen Refraktionen des menschlichen Auges. Berlin, Karger, 1913.)

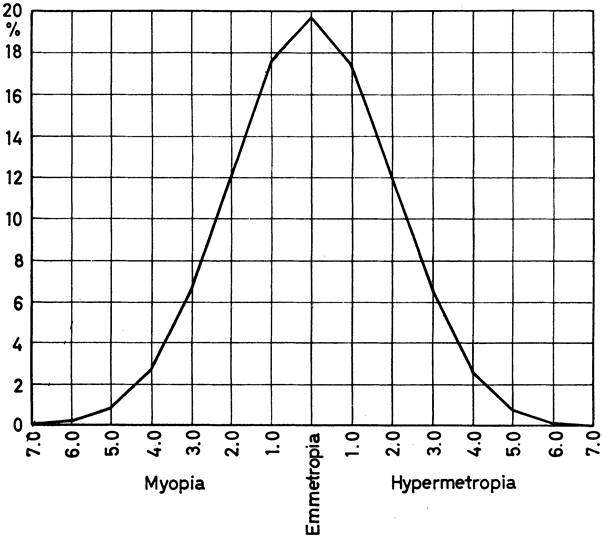
The rather simple scheme postulated by Steiger is no longer tenable, as it led to a theoretically normal distribution of refractive error (Fig. 2), but his seminal work is the starting point of current ideas about the ocular components and refractive error. Current views are based on knowledge of the distribution of the refractive error in the general population and on the measurement of the various individual components of refraction (corneal power, anterior chamber, crystalline lens anterior and posterior surface curvature and thickness, vitreous chamber depth, and axial length).

Fig. 2. Theoretic curve of range and distribution of ocular refraction on the assumption of free association of corneal power and axial lengths, both normally distributed. (Steiger A: Die Entstehung der sphärischen Refraktionen des menschlichen Auges. Berlin, Karger, 1913.)

Back to Top
REFRACTIVE ERROR DISTRIBUTIONS
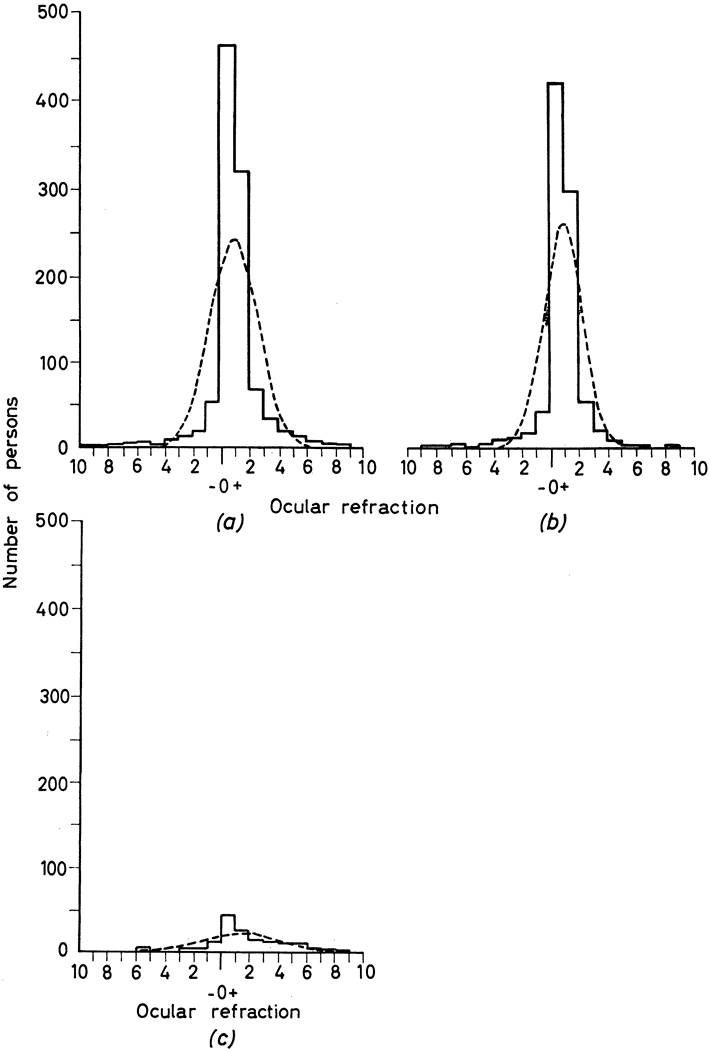
A number of curves giving the distribution of the different refractions in various sample populations are available. Some of these curves are derived from clinic-based patients and are, therefore, potentially biased. Others deal with specialized populations, such as children or specific ethnic groups. Curves substantially free from selection bias are few. The distribution of refractive error in British national service recruits is depicted in Figure 3 (1033 men).7 No comparable curves are available for women.

Fig. 3. Curves of distribution of refractive error in 1033 national service recruits in England in 1957. All refractive error in the better eye is shown as the solid line. The broken line represents the underlying normal distribution with the same mean ocular refraction. a. All refractions. b. Spherical refractions (with astigmatism of from 0 to 0.5 D). c. Astigmatic errors (astigmatism of 0.6 D or more with or without a spherical error). (Sorsby A, Sheridan M, Leary GA: Vision, visual acuity and ocular refraction of young men. Br Med J 1:1394, 1960.)

There are significant deviations from a normal distribution in Figure 3. The peak of the distribution is at approximately +1.00 D of hyperopia and represents a disproportionate number of people with low hyperopia (leptokurtosis). Moderate myopia and hyperopia are underrepresented in the actual data relative to the theoretic normal distribution, and high myopia and hyperopia are overrepresented. In this general population (as shown in Fig. 3), a high proportion has no refractive error by any practical definition. Seventy-five percent of the sample of national service recruits had refractive error between 0.00 and +1.90 D.

The considerable excess of emmetropic and nearly emmetropic refractions in Figure 3 and in other samples excludes the possibility that such refractions are the result of a random combination of components of refraction, whereas the probable excess of high myopes and high hyperopes suggests that these fall outside the mechanism that produces coordinated emmetropic and nearly emmetropic eyes.

Back to Top
OPTICAL COMPONENTS OF REFRACTION

NORMAL DISTRIBUTION AND AGE/GENDER EFFECTS IN CHILDHOOD

Figure 4 from Sorsby's original work2 shows that although refractive error was not normally distributed but followed the pattern seen in Figure 3, all the individual components were normally distributed. The data in Figure 4 depict the distribution of the components in adults; axial length was calculated from the other variables.

Fig. 4. Curves of distribution of refraction and its components in 194 eyes. Solid line, actual distribution; broken line, normal curve. (Sorsby A, Benjamin B, Davey JB, et al: Emmetropia and Its Aberrations. London, Her Majesty's Stationery Office, 1957.)

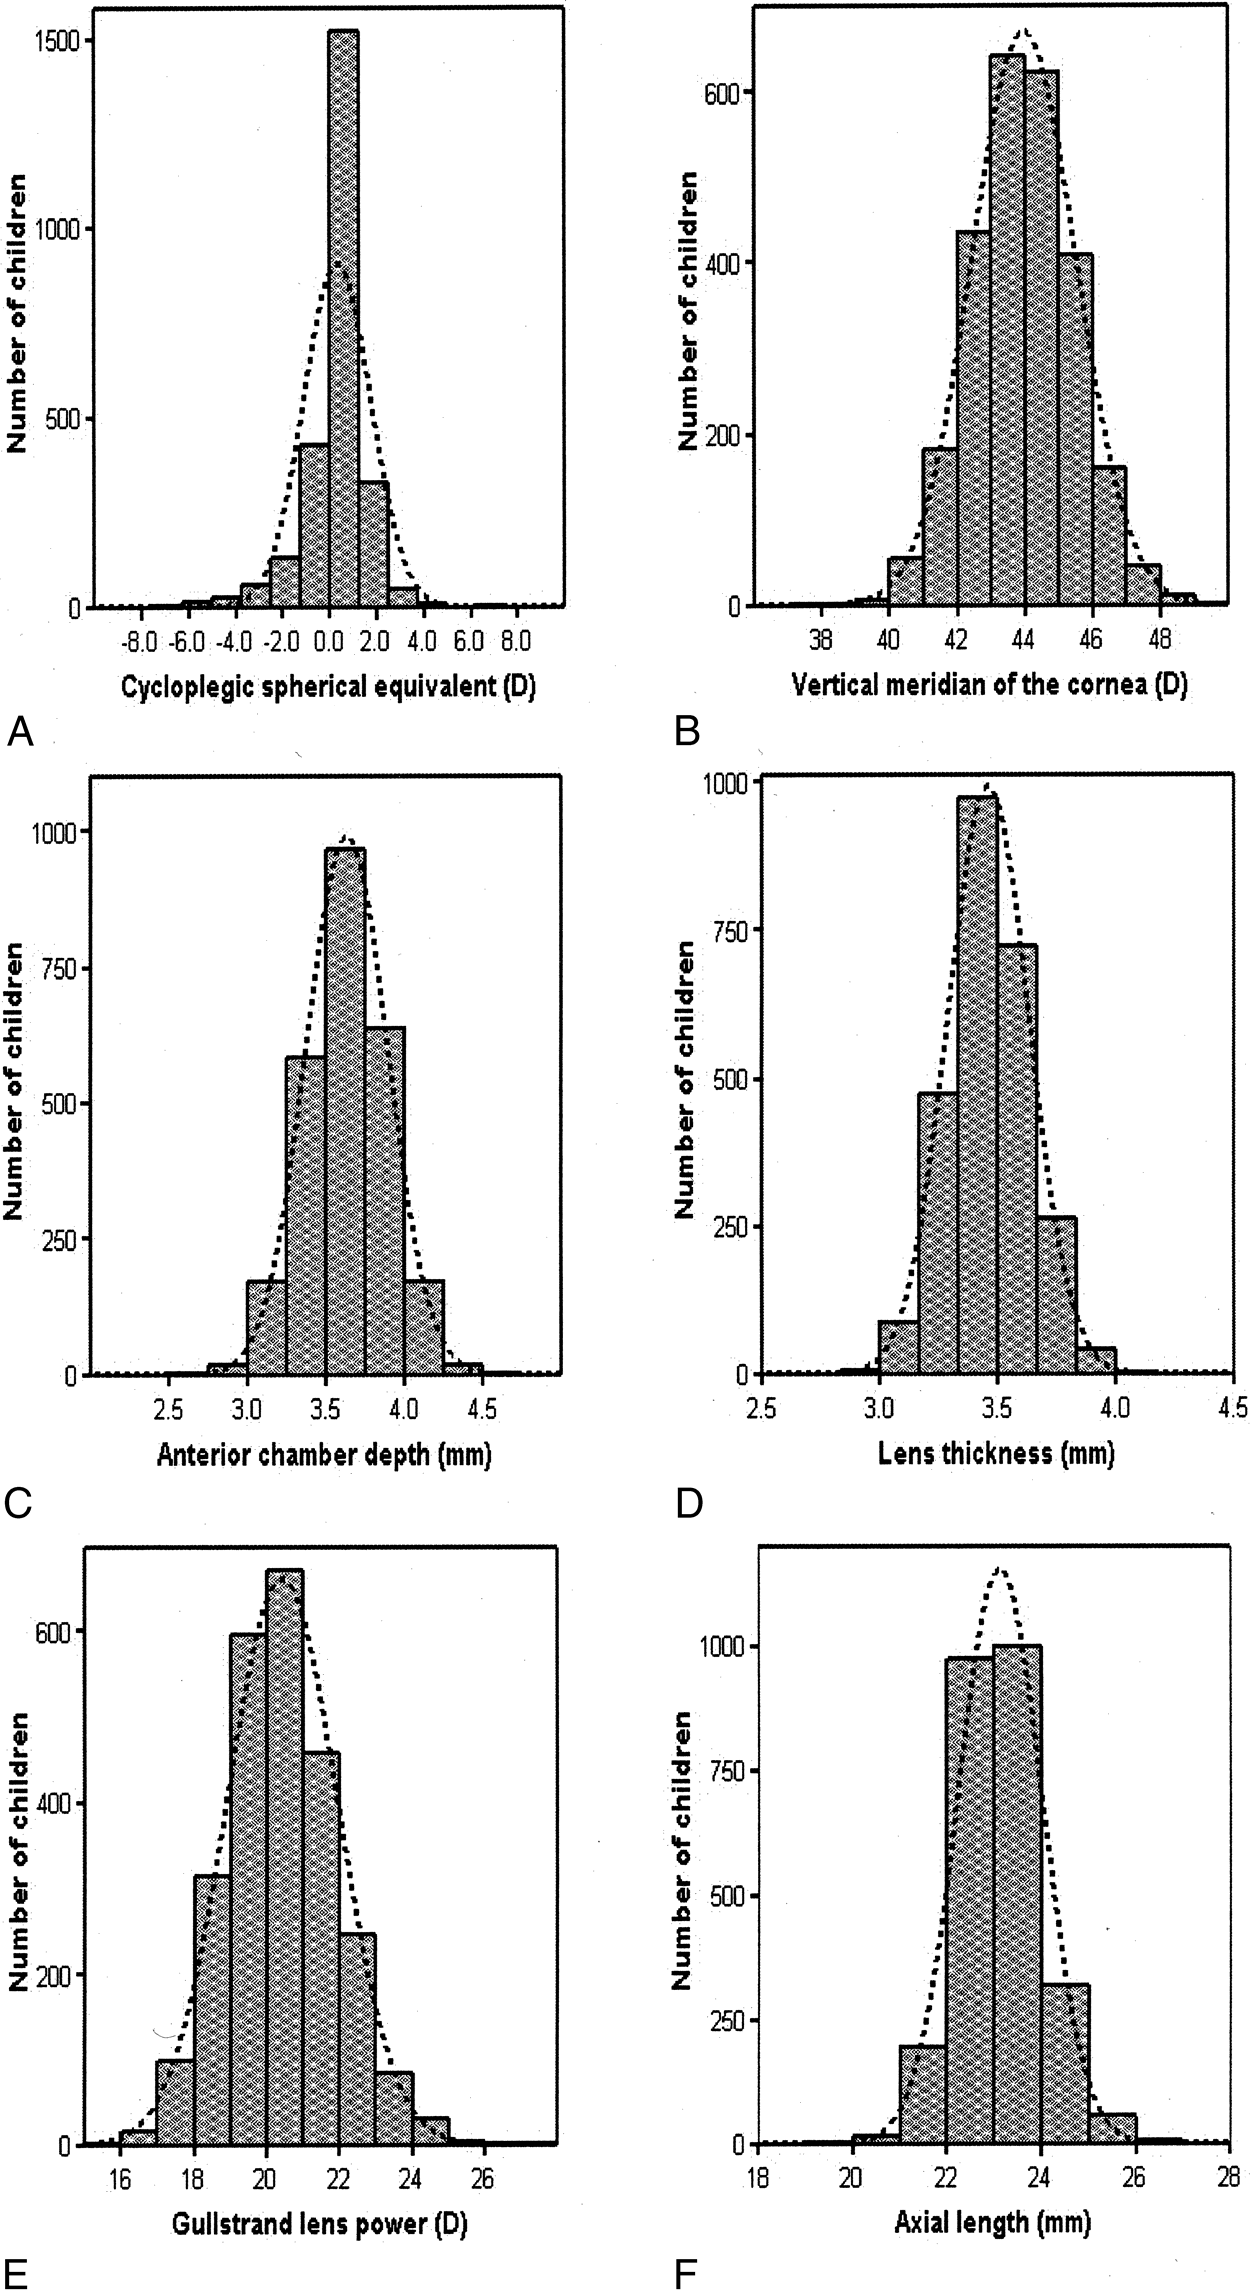
The Orinda Longitudinal Study of Myopia,8 now continuing as the Collaborative Longitudinal Evaluation of Ethnicity and Refractive Error (CLEERE) Study,9 is the first study to measure all the ocular components in school-aged children. Figure 5 depicts the distribution of the ocular components, and Table 1 describes these data as a function of age and gender.


Table 1. Ocular Components in Children Enrolled at Baseline (1997–98 Academic Year) in the Collaborative Longitudinal Evaluation of Ethnicity and Refractive Error (CLEERE) Study, as a Function of Age and Gender


Component Gender Age at Last Birthday (years)*
6 7 8 9 10 11 12 13 14+
Refractive error (spherical equivalent in diopters) Girls
+0.88 ± 0.86
+0.78 ± 1.01
+0.64 ± 1.26
+0.18 ± 1.64
0.00 ± 1.42
+0.03 ± 1.72
-0.16 ± 1.55
-0.15 ± 1.38
-0.46 ± 2.18
  Boys
+0.81 ± 0.87
+0.72 ± 0.95
+0.53 ± 1.11
+0.37 ± 1.14
+0.34 ± 1.25
+0.18 ± 1.57
+0.32 ± 1.50
-0.12 ± 1.58
-0.11 ± 2.78
Corneal power (vertical meridian in diopters) Girls
44.57 ± 1.48
44.32 ± 1.54
44.49 ± 1.45
44.27 ± 1.39
44.46 ± 1.64
44.19 ± 1.45
44.39 ± 1.60
44.16 ± 1.58
44.14 ± 1.56
  Boys
43.55 ± 1.50
43.66 ± 1.42
43.75 ± 1.55
43.51 ± 1.37
43.65 ± 1.62
43.58 ± 1.46
43.68 ± 1.40
43.46 ± 1.37
43.47 ± 1.46
Corneal power (horizontal meridian in diopters) Girls
43.71 ± 1.48
43.52 ± 1.56
43.67 ± 1.46
43.55 ± 1.45
43.65 ± 1.62
43.36 ± 1.49
43.61 ± 1.50
43.37 ± 1.55
43.14 ± 1.22
  Boys
42.82 ± 1.49
42.91 ± 1.45
43.01 ± 1.44
42.86 ± 1.32
43.05 ± 1.70
42.90 ± 1.43
42.99 ± 1.36
42.75 ± 1.43
42.75 ± 1.40
Anterior chamber depth (mm) Girls
3.51 ± 0.26
3.49 ± 0.25
3.57 ± 0.24
3.61 ± 0.23
3.61 ± 0.27
3.61 ± 0.24
3.69 ± 0.23
3.66 ± 0.26
3.64 ± 0.25
  Boys
3.57 ± 0.25
3.61 ± 0.24
3.65 ± 0.26
3.68 ± 0.25
3.70 ± 0.25
3.72 ± 0.24
3.73 ± 0.25
3.76 ± 0.25
3.69 ± 0.34
Lens thickness (mm) Girls
3.54 ± 0.15
3.52 ± 0.16
3.47 ± 0.15
3.44 ± 0.17
3.41 ± 0.17
3.45 ± 0.17
3.41 ± 0.16
3.45 ± 0.18
3.43 ± 0.20
  Boys
3.53 ± 0.17
3.52 ± 0.15
3.46 ± 0.16
3.44 ± 0.17
3.43 ± 0.18
3.43 ± 0.17
3.39 ± 0.17
3.44 ± 0.18
3.52 ± 0.22
Gullstrand lens power (D) Girls
21.23 ± 1.38
21.30 ± 1.49
20.85 ± 1.53
20.28 ± 1.33
20.22 ± 1.57
20.37 ± 1.31
19.95 ± 1.31
20.21 ± 1.58
20.38 ± 1.64
  Boys
21.11 ± 1.42
20.89 ± 1.45
20.50 ± 1.40
20.31 ± 1.57
20.07 ± 1.38
20.01 ± 1.36
19.48 ± 1.43
19.78 ± 1.57
19.97 ± 1.45
Calculated lens power (D) Girls
24.67 ± 2.22
23.92 ± 2.32
23.50 ± 2.37
22.71 ± 2.05
22.56 ± 2.40
22.71 ± 2.16
22.02 ± 2.18
22.04 ± 2.27
22.61 ± 2.03
  Boys
23.79 ± 2.11
23.13 ± 2.20
22.71 ± 2.17
21.93 ± 2.06
21.66 ± 2.21
21.82 ± 2.28
21.13 ± 2.36
21.50 ± 2.15
22.16 ± 2.15
Vitreous chamber depth (mm) Girls
15.28 ± 0.66
15.48 ± 0.73
15.61 ± 11.80
15.97 ± 0.84
16.05 ± 0.81
16.06 ± 0.87
16.18 ± 0.86
16.22 ± 0.91
16.41 ± 1.04
  Boys
15.72 ± 0.57
15.81 ± 0.64
16.03 ± 0.79
16.28 ± 0.69
16.30 ± 0.78
16.39 ± 0.83
16.44 ± 0.85
16.56 ± 0.82
16.48 ± 1.14
Axial length (mm) Girls
22.33 ± 0.66
22.49 ± 0.76
22.65 ± 0.84
23.02 ± 0.85
23.07 ± 0.85
23.13 ± 0.86
23.27 ± 0.87
23.34 ± 0.91
23.48 ± 1.05
  Boys
22.82 ± 0.56
22.94 ± 0.63
23.14 ± 0.81
23.40 ± 0.70
23.43 ± 0.80
23.54 ± 0.84
23.55 ± 0.86
23.76 ± 0.84
23.69 ± 1.17

*Each cell contain the mean = standard deviation for the component age, and gender indicated.
Reprinted from Zadnik K, Manny RE, Yu JA, et al for the CLEERE Study Group: Ocular component data in schoolchildren as a function of age and gender. Optom Vis Sci 80:226, 2003, with permission.


Fig. 5. Distribution of the major ocular components from children enrolled in the Collaborative Longitudinal Evaluation of Ethnicity and Refractive Error (CLEERE) Study in the 1997–98 school year. (Zadnik K, Manny RE, Yu JA, et al for the CLEERE Study Group: Ocular component data in schoolchildren as a function of age and gender. Optom Vis Sci 80:226, 2003.)

As would be expected with the continued ocular growth of children, there was a significant effect of age on refractive error (spherical equivalent [p < .0001]). Children 6 or 7 years old were more hyperopic than children 9, 10, 11, 12, 13, or 14 years old. Similarly, children 8 years old were more hyperopic than those aged 10 to 14 years, and the mean spherical equivalent for 9-year-olds was greater than for 14-year-olds. Using our a priori criterion for significance (p < .005), there was no difference in the spherical equivalent values obtained from girls and boys (p = .0118).

For corneal power in both the vertical and horizontal meridians, there was a significant effect of gender. Girls, on average, had corneas 0.74 D steeper in the vertical meridian (p < .0001) and corneas 0.63 D steeper in the horizontal meridian (p < .0001) compared with boys. There was no effect of age on corneal power in either meridian (p = .16).

Both age and gender were significantly associated with anterior chamber depth (p < .0001 for both). Children 6 and 7 years old had significantly shallower anterior chambers than did children 9 to 14 years of age. In addition, children aged 8 years had significantly shallower anterior chambers compared with children aged 12 or 13 years. Girls had anterior chambers that were, on average, 0.08 mm shallower than the anterior chambers of boys.

Although the crystalline lens showed a significant thinning effect with age (p < .0001), there was no difference in lens thickness between girls and boys (p = .66). The mean lens thickness was significantly greater for children aged 6 and 7 years compared with children aged 8 through 13 years. There was also a significant difference between the mean at age 8 years and the mean at age 12 years.

Both Gullstrand lens power and calculated lens power showed significant effects of age and gender. Girls, on average, had Gullstrand lens powers that were 0.28 D stronger and calculated lens powers that were 0.80 D stronger than those of boys (p < .0001 for both). As with the other components discussed above, mean differences in both lens power variables were observed as a function of age. The mean Gullstrand lens power was significantly stronger in children aged 6 and 7 years compared with children aged 8 to 14 years, in children aged 8 years compared with children aged 10 to 13 years, and in children aged 9 years compared with those aged 12 years. Calculated lens power differences were observed for children aged 6 compared with those aged 7 to 14 years, children aged 7 years compared with those aged 9 to 14 years, children aged 8 years compared with those aged 9 to 13 years, and children aged 9 years compared with those aged 12 years.

Similar results were also obtained when comparing the average vitreous chamber depth between the genders (p <.0001) and among the age groups (p < .0001). The mean vitreous chamber depth for children aged 6 years was significantly shorter than for children aged 8 to 14 years. Children aged 7 and 8 years had significantly shorter vitreous chambers than those aged 9 to 14 years, and the mean for 9-year-olds was significantly different from the mean for 13-year-olds. As with anterior chamber depth, girls had vitreous chambers that were shorter (by an average of 0.32 mm).

Axial length also showed significant effects of age and gender (p < .0001 for both). Girls had eyes which were, on average, 0.40 mm shorter when compared with the boys. Eyes of children aged 6 years were significantly shorter than eyes of children aged 8 to 14 years. Children aged 7 and 8 years had significantly shorter eyes compared with children aged 9 to 14 years. There was also a significant difference between the mean axial length when children aged 9 years were compared with those aged 13 or 14 years and when the 10-year-olds were compared with the 13-year-olds.

Back to Top
REFRACTION AND ITS COMPONENTS DURING THE GROWTH OF THE EYE
Ocular growth presents a fascinating picture in the context of the development of refractive error. The eye is approximately 17 mm long at birth. From birth to age 6 years, the eye grows by approximately 5 mm, loses 4 D of corneal power, and loses 20 D of lens power. Through the process of emmetropization, this growth occurs so that the distribution of refractive error becomes narrow, there is a preponderance of emmetropes, and the prevalence of myopia is only 2% by age 6 years. The interesting future of ocular development is that during the next 8 years, when the average eye will grow only an additional 1 mm, the prevalence of myopia will increase more than sevenfold, to 15% by age 15 years.5

RAPID INFANTILE PHASE OF OCULAR GROWTH

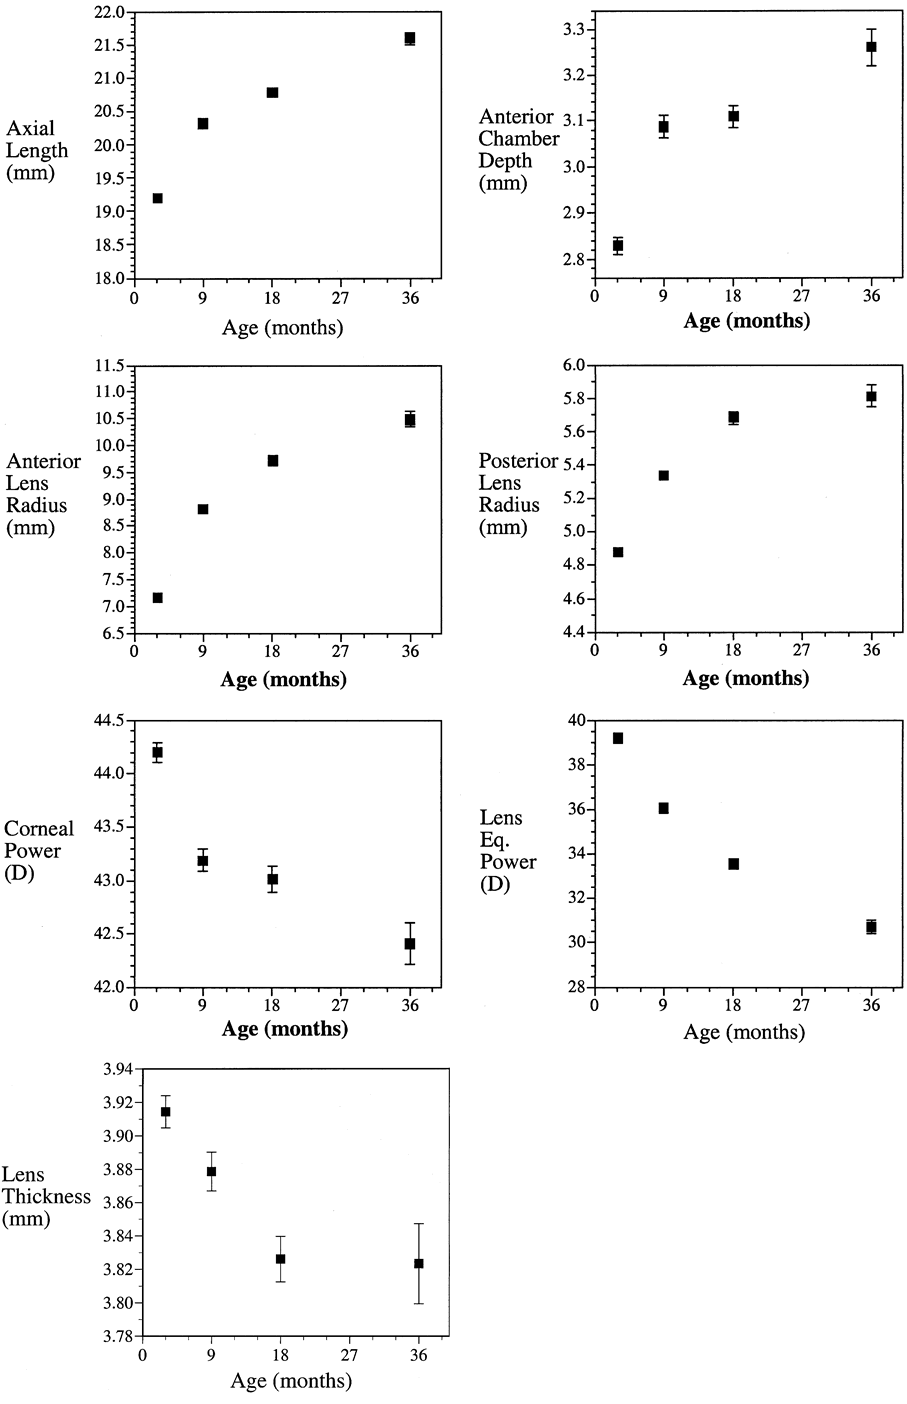
The optical and structural components of the eye undergo their most rapid development in infancy. The average newborn eye on ultrasonography is about 17 mm in length10–16 (Table 2) with a corneal power of about 49 D.17–20 As seen in Figure 6, these dimensions change rapidly over the next 9 to 18 months of age. The general pattern of change is that the anterior and vitreous chambers and overall axial length of the eye increase, the radius of curvature of the anterior and posterior lens surfaces flatten, the cornea and lens decrease in equivalent power, and the crystalline lens thins. Rates of change then slow as the eye approaches its juvenile ocular dimensions.


Table 2. A Summary of Previous Literature on the Axial Dimensions of the Infant Eye


AuthornAgeACD (mm)LT (mm)AL (mm)
Gernet (1964)1136(70 eyes)1–5 days2.93.417.1
Luyçkx (1966)1552 (104 eyes)4–7 days2.63.717.6
Larsen (1971)12–1480 (160 eyes)1–5 days2.44.016.6
Blomdahl (1979)16281–4 days2.63.616.6
Fledelius (1992)102537–43 weeks (gestational age)2.63.817.3

ACD, anterior chamber depth; LT, lens thickness; AL, axial length.
Reprinted from Wood ICJ, Mutti DO, Zadnik K: Crystalline lens parameters in infancy, Ophthalmic Vis Sci 16: 310, 1996; with permission from Elsevier Science Ltd. The Boulevard, Langford Lane, Kidlington. OX5 1GB, UK.


Fig. 6. Ocular dimensions as a function of age. Error bars indicate ± standard error of the mean (may occasionally be smaller than the data point). Data were gathered as part of the Berkeley Infant Biometry Study (Franc SL, Sholtz RI, Lin WK, Mutti DO: Ocular components before and after acquired, nonaccommodative esotropia. Optom Vis Sci 77:633, 2000).

SLOW JUVENILE PHASE OF OCULAR GROWTH

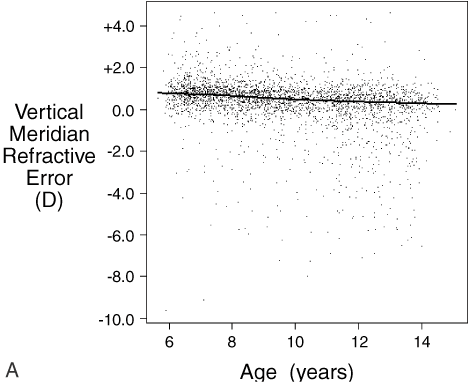
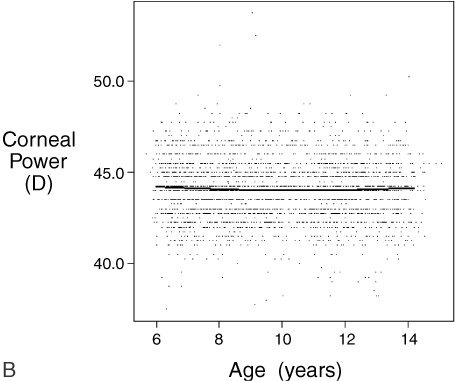
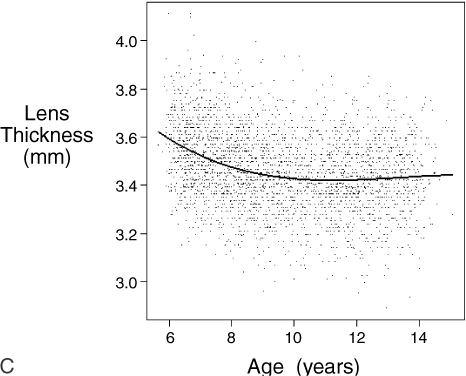
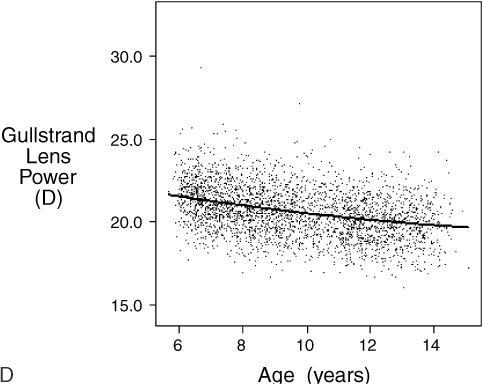
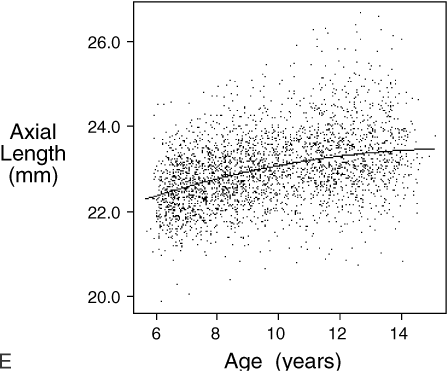
Figure 7 shows ocular component data collected from children enrolled in the Orinda Longitudinal Study of Myopia between 1989 and 1993 as a function of age. Refractive error in the vertical meridian declines, on average, from low hyperopia toward emmetropia with increasing age (Fig. 7A), with the typical distribution, leptokurtic for near emmetropia and more myopes than hyperopes, evident. The summary curve for central corneal curvature in the vertical meridian shows no effect with age (Fig. 7B). The previously reported thinning of the crystalline lens between the ages of 6 and 9 years21 is evident in Figure 7C. Figure 7D shows the typical decrease in crystalline lens power occurring during school ages, presumably to compensate for the axial length increases that occur concurrently (Figure 7E). It is when the thinning and flattening of the crystalline lens are outpaced by excessive or anomalous axial elongation during this slow phase of ocular growth that myopia occurs.


Fig. 7. Ocular component data from children enrolled in the Orinda Longitudinal Study of Myopia between 1989 and 1993. (Reprinted from Zadnik K: The Glenn A. Fry Award Lecture (1995). Myopia development in childhood. Optom Vis Sci 74:603, 1997, with permission.)

Back to Top
HEREDITY
Although much of the experimental side of myopia research has examined the responsiveness of the growth of the eye to the visual environment, a considerable body of clinical evidence suggests that the majority of the variance in refractive error can be explained by genetic factors. Many studies have shown that myopia can be induced by depriving the eyes of form vision in neonates of several species: the tree shrew,22 marmoset,23 monkey,24 and chick.25 Analogous situations to form deprivation may occur in humans that explain the induction of myopia in various clinical situations, for example, cataract, vitreous hemorrhage, corneal scarring, and ptosis.26 Form-deprivation myopia probably explains very little about human refractive error because it is unidirectional (only producing myopia) and only occurs with pathology present. The more important experimental procedure supporting a role for environment in refractive error is nearly constant exposure of an infant animal eye to lenses that simulate refractive error.27 Applying lenses with more plus power than the animal's refractive error simulates myopia, whereas using minus lenses simulates hyperopia. The eyes of young animals compensate for these simulated refractive errors by changing their rate of axial growth, speeding up to produce a compensatory myopia in response to minus lenses or slowing down to become hyperopic in response to plus lenses. Yet despite this consistent experimental finding across species, the relevance to human refractive error is still unclear. Because the relevance of animal lens experiments can only be as large as the role for environment, this question can be answered partly by examining the evidence for the relative influence of heredity and environment in the etiology of human refractive error.

Hereditary influences are suggested by family studies of refractive error. A parental history of myopia appears to be a risk factor for myopia in children. The prevalence of myopia in children with two myopic parents is 30% to 40%, whereas it is only 20% to 25% in children with one myopic parent and less than 10% in children without a myopic parent.28 Quantification of this association would be useful.

The primary measure of hereditary influence is heritability, or h2, defined as the proportion of total phenotypic variance in a trait that can be explained by genetic factors. Heritability can be estimated from family studies. Table 3 presents data from several family studies of refractive error. Heritabilities are calculated by doubling either the slope or correlation between refractive errors as a function of family relationship.29 This doubling factor is used because siblings, parents, and children each share half of the other's genetic variance. The heritability presented is the average across studies weighted by the number of subjects in a study. Heritability ranges from 0.36 to 0.86, depending on family relationship. It is 0.36 between parents and children, increasing to 0.59 between siblings.


Table 3. Estimates of Heritability as a Function of Family Relationship Compiled From the Literature


Family RelationshipStudies, nSubjects, nHeritability
Parent-child1043970.36
Sibling-sibling723420.59
Dizygotic twin790740.74
Monozygotic twin748920.80
Doubling the difference between
monozygotic and dizygotic slopes
N/AN/A0.86


The higher heritability between siblings compared with that between parents and children may be explained by two effects. One is that the environment between siblings is more similar than that between parents and their children. If environment helps to shape refractive error, a more similar environment would increase the correlation and inflate estimates of heritability. A second possibility is that the effect is due to age. Because the prevalence of myopia increases with age, siblings are more similar in refractive error because they are more similar in age than parents and children.

Heritability may also be estimated from studies of twins. Twin studies have the dual advantage of using subjects matched in age who are also very similar in their environments. Although environmental similarity may inflate estimates of heritability for monozygotic and dizygotic twins, the analytic technique of doubling the difference in the correlation between monozygotic and dizygotic twins is reported to essentially cancel the effects of their shared, assumed equal environment. Twin studies were examined in a similar manner to family studies and are reported in Table 3. Heritability for monozygotic twins is calculated directly from the slope or correlation for refractive error of each twin. Doubling is not needed because monozygotic twins share all genes. There are two features worth noting. One is the high values for heritability from twin data: 0.74 for dizygotic twins and 0.80 for monozygotic twins. The second feature is how little these estimates differ from 0.86 when estimated by doubling the difference between monozygotic and dizygotic twins. The small impact on heritability of removing the effects of environment by this technique suggests a limited role for environmental contributions to the association between the refractive error of twins and siblings.

We evaluated whether eye size and shape are different in premyopic elementary schoolchildren based on their parental history of myopia and the extent to which familial patterns of eye size and shape are associated with environmental factors by adjusting for parent-reported near work. Table 4 presents the average refractive error and average ocular component values for a sample of 662 nonmyopic children between the ages of 6 and 14 years enrolled in the Orinda Longitudinal Study of Myopia. With prevalent cases of myopia excluded and grade in school and near work controlled for, children with two myopic parents had longer eyes and less hyperopic refractive error (analysis of covariance, p .01) than children with only one or no myopic parent.


Table 4. Means of Refractive Error and Ocular Components by Parental Refractive Error History Category With Prevalent Myopic Children Excluded (at least -0.75 D of myopia in each meridian), Controlling for Both Grade in School and Near Work (n = 662).*


Myopic Parent CategoryChildren, nRefractive Error (D)Corneal Power (D)Lens Thickness (mm)Anterior Chamber Depth (mm)Vitreous Chamber Depth (mm)Crystalline Lens Power (D)
Both1580.5144.053.473.70  15.7620.50
Either2900.6243.913.483.68  15.7120.66
Neither2140.7244.033.493.62  15.5720.85
p value**  0.01   0.61 0.560.002   0.01   0.06

*Least-square means are estimated from analysis of covariance models.
**The significance probability is associated with the F test of the hypothesis of equality of the means.
Reprinted from Zadnik K, Satariano WA, Mutt DO, et al: The effect of parental history of myopia on children's eye size. JAMA 271:1323, 1994.


The impact of environment may also be estimated in clinical studies through assessments of near work. It is particularly useful to assess the impact of parental history of refractive error and near work in the same subjects in order to gauge the relative impact of a parental history of myopia and near work. This approach has been used in studies in both the United States and Asia. In our sample of 366 eighth-grade children enrolled in the Orinda Longitudinal Study of Myopia,30 the odds of being a myope increased by 6.40 times when a child had two myopic parents compared with children without a myopic parent (Table 5). In contrast, the odds of being a myope only increased by about 2% per diopter-hour (D-hr)31 per week of near work. One D-hr = (3 × [hours spent studying + hours spent reading for pleasure]) + (2 × hours spent playing video games or working on the computer at home) + (1 × hours spent watching television). This study also estimated the relative impact of both parental history of myopia and near work. The total range of near work performed by children can be approximated by four standard deviations for D-hrs, or roughly 100 D-hrs. A child would have had to increase the time spent in near work by over half the total range of time in near work (61.3 D-hrs) to equal the effect of one myopic parent on the risk of myopia. Nearly the entire range of near work (94.7 D-hrs) equaled the effect of two myopic parents on the risk of myopia.


Table 5. Univariate and Multivariate Odds Ratios (95% Cls) for the Association Between Children's Myopia and the Number of Myopic Parents, Near Work, Sports Activities, and Local lowa Test of Basic Skills (ITBS) Reading Scores.


Risk FactorUnivariate
Odds Ratios*
Multivariate
Odds Ratios*
Values (multivariate)
One myopic parent3.31 (1.32, 8.30)3.32 (1.18, 9.37)0.023  
Two myopic parents7.29 (2.84, 18.7)6.40 (2.17, 18.87)0.0008
Diopter-hours per week1.018 (1.008, 1.027)1.020 (1.008, 1.032)0.0013
Sports (hrs/wk)0.936 (0.892, 0.983)0.917 (0.864, 0.974)0.0045
Local ITBS reading percentile score1.013 (1.003, 1.024)1.014 (1.002, 1.027)0.0276
Local ITBS total language percentile score1.014 (1.004, 1.025)Not in multivariate modelNot significant

*The multivariate model adjusts for all other factors listed.
Reprinted from Mutti DO, Mitchell GL, Moeschberger ML, et al: Parental myopia, near work, school achievement, and children's refractive error. Invest Ophthalmol Vis Sci 43:3633, 2002, with permission.


Results from Asia appear to be similar. In a sample of Singaporean conscripts with a highly myopic average refractive error of –6.10 D, Saw and colleagues32 found that parental myopia was significantly related to myopia but not to past or current near work. Parental myopia became nonsignificant when adjusted not for near work but for educational level and placement in a gifted track in school. In a sample of Chinese schoolchildren in Singapore, odds ratios for parental myopia were higher (3.44 for two compared with no myopic parents) than for near work (1.43 for reading more than two books compared with fewer than two books per week).33

Despite a long history of association with myopia, near work describes very little of the variance in refractive error compared with heredity. Models of refractive error that include a near work variable generally have R2 values between 2% and 12%.34–37 This compares poorly with the heritability of 0.86 from the twin studies in Table 3. These three types of clinical measures—heritabilities from family and twin studies, odds ratios for parental refractive error and near work, and R2 values for near work alone—all suggest that refractive error is predominantly genetic in etiology, with smaller contributions from the environment.

Are heritability estimates for refractive error inflated? At least theoretically, environment may masquerade as heredity by either the inheritance of near work habits or by the inheritance of a susceptibility to the effects of environment. In the former case, the tendency for myopia to run in families might be due to a shared, intense near work environment within a family rather than because of shared genes. In the latter situation, a child could perform intense near work but would not develop myopia if he or she did not possess the susceptibility genes, whereas another child with the genetic susceptibility to near work who performed the same level of near work would have a higher risk of myopia. Both of these possibilities were evaluated in our Orinda Longitudinal Study of Myopia database, with little evidence for either. Adjustment for near work had almost no effect on the univariate odds ratio for parental myopia because near work was not associated with the number of myopic parents (Table 5), arguing against an inherited environment. Likewise, there was no significant change in the odds ratio for near work as a function of the number of myopic parents (Table 6), arguing against inherited susceptibility. Both findings suggest that there should be genes for refractive error underlying its high heritability.


Table 6. Odds Ratios (95% Cls) for Myopia Associated With Performing 50 Diopter Hours (D-hrs) of Near Work Compared With < 50 D-hrs Per Week.


Myopic Parents, nOdds Ratio for $ 50 D-hrs
02.09 (0.364, 12.0)
12.22 (0.941, 5.25)
21.57 (0.60, 4.09)

Odds ratios are reported separately for subjects with none, one, and two myopic parents. (Reprinted from Multi DO, Mitchell GL, Moeschberger ML, et al. Parental myopia, near work, school achievement, and children's refractive error. Invest Ophthalmol Vis Sci 43:3633, 2002, with permission).


The search for such genes has borne fruit for pathologic forms of myopia, myopia in excess of –6.00 D. Bornholm disease, an X-linked form of myopia characterized by myopia of more than –6.00 D, deuteranopia, and moderate optic nerve hypoplasia, has been linked to the distal part of the X chromosome at Xq28.38 Knobloch syndrome, which includes severe myopia and encephalocele has been mapped to 21q2239 and shown to be caused by defects in the collagen XVIII gene.40 Other recent molecular genetic studies of families with two or more individuals with –6.00 D or more of myopia have found significant linkage with regions on chromosome 18p11.31,41 12q21-23,42 and 7q36.43 Perhaps not surprisingly, a complex-trait myopia may be characterized by heterogeneity. Loci identified by Young and coworkers in highly myopic families were not associated with high myopia in another study.43 To date, no loci have been associated with juvenile, less myopic refractive errors. Again, loci identified by Young and coworkers were not associated with juvenile myopia.44 Identification of such loci is clearly one test that a genetic hypothesis for refractive error must meet.

Back to Top
REFERENCES

1. Stenstrom S: Investigation of the variation and the correlation of the optical elements of human eyes. Am J Optom Arch Am Acad Optom 25:218, 1948

2. Sorsby A, Benjamin B, Davey JB, et al: Emmetropia and Its Aberrations. London, Her Majesty's Stationery Office, 1957

3. Sorsby A, Benjamin B, Sheridan M: Refraction and Its Components During the Growth of the Eye From the Age of Three. London, Her Majesty's Stationery Office, 1961

4. Sorsby A, Leary GA: A Longitudinal Study of Refraction and Its Components During Growth. London, Her Majesty's Stationery Office, 1970

5. Mutti DO, Zadnik K, Adams AJ: Myopia. The nature versus nurture debate goes on. Invest Ophthalmol Vis Sci 37:952, 1996

6. Steiger A: Die Entstehung der sphärischen Refraktionen des menschlichen Auges. Berlin, Karger, 1913

7. Sorsby A, Sheridan M, Leary GA: Vision, visual acuity and ocular refraction of young men. Br Med J 1:1394, 1960

8. Zadnik K, Mutti DO, Friedman NE, Adams AJ: Initial cross-sectional results from the Orinda Longitudinal Study of Myopia. Optom Vis Sci 70:750, 1993

9. Zadnik K, Manny RE, Yu JA, et al for the CLEERE Study Group: Ocular component data in schoolchildren as a function of age and gender. Optom Vis Sci 80:226, 2003

10. Fledelius HC: Pre-term delivery and the growth of the eye. An oculometric study of eye size around term-time. Acta Ophthalmol 204(Suppl):10, 1992

11. Gernet H: Achsenlänge und refraktion lebender augen von neugeborenen. Albrecht von Graefes Arch Ophthalmol 166:530, 1964

12. Larsen JS: The sagittal growth of the eye. I. Ultrasound measurement of the depth of the anterior chamber from birth to puberty. Acta Ophthalmol 49:239, 1971

13. Larsen JS: The sagittal growth of the eye. II. Ultrasonic measurement of the axial diameter of the lens and the anterior segment from birth to puberty. Acta Ophthalmol 49:427, 1971

14. Larsen JS: The sagittal growth of the eye. IV. Ultrasonic measurement of the axial length of the eye from birth to puberty. Acta Ophthalmol 49:873, 1971

15. Luyçkx J: Mesure des composantes optiques de l'oeil du nouveau-né par échographie ultrasonique. Arch Ophthalmol (Paris) 26:159, 1966

16. Blomdahl S: Ultrasonic measurements of the eye of the newborn infant. Arch Ophthalmol 57:1048, 1979

17. Inagaki Y: The raid change of corneal curvature in the neonatal period and infancy. Arch Ophthalmol 104:1026, 1986

18. Insler MS, Cooper HD, May SE, Donzis PB: Analysis of corneal thickness and corneal curvature in infants. CLAO J 13:182, 1987

19. Mandell RB: Corneal contour of the human infant. Arch Ophthalmol 77:345, 1967

20. York MA, Mandell RB: A new calibration system for photokeratoscopy. Part II—corneal curvature measurements. Am J Optom Arch Am Acad Optom 46:818, 1969

21. Zadnik K, Mutti DO, Fusaro RE, Adams AJ: Longitudinal evidence of crystalline lens thinning in children. Invest Ophthalmol Vis Sci 36:1581, 1995

22. Norton TT: Experimental Myopia in Tree Shrews, pp 178–199. Chichester, UK, John Wiley and Sons, 1990

23. Troilo D, Nickla DL, Wildsoet CF: Form deprivation myopia in mature common marmosets (Callithrix jacchus). Invest Ophthalmol Vis Sci 41:2043, 2000

24. Smith EL, Hung L-F: The role of optical defocus in regulating refractive development in infant monkeys. Vision Res 39:1415, 1999

25. Wallman J, Adams JI: Developmental aspects of experimental myopia in chicks: susceptibility, recovery and relation to emmetropization. Vision Res 27:1139, 1987

26. Rabin J, Van Sluyters RC, Malach R: Emmetropization: a vision-dependent phenomenon?Invest Ophthalmol Vis Sci 20:561, 1981

27. Schaeffel F, Glasser A, Howland HC: Accommodation, refractive error, and eye growth in chickens. Vision Res 28:639, 1988

28. Gwiazda J, Thorn F, Bauer J, Held R: Emmetropization and the progression of manifest refraction in children followed from infancy to puberty. Clin Vis Sci 1993; 8:337–344.

29. Plomin R, DeFries JC, McClearn GE: Behavioral Genetics, pp 256–259, 315–325. New York, WH Freeman and Company, 1990

30. Mutti DO, Mitchell GL, Moeschberger ML, et al: Parental myopia, near work, school achievement, and children's refractive error. Invest Ophthalmol Vis Sci 43:3633, 2002

31. Zadnik K, Satariano WA, Mutti DO, et al: The effect of parental history of myopia on children's eye size. JAMA 271:1323, 1994

32. Saw SM, Wu HM, Seet B, et al: Academic achievement, close up work parameters, and myopia in Singapore military conscripts. Br J Ophthalmol 85:855, 2001

33. Saw SM, Zhang M, Hong R, et al: Near-work activity, night-lights, and myopia in the Singapore-China study. Arch Ophthalmol 120:620, 2002

34. Angle J, Wissmann DA: Age, reading, and myopia. Am J Optom Physiol Opt 55:302, 1978

35. Angle J, Wissmann DA: The epidemiology of myopia. Am J Epidemiol 111:220, 1980

36. Richler A, Bear JC: Refraction, nearwork and education. A population study in Newfoundland. Acta Ophthalmol 58:468, 1980

37. Zadnik K, Mutti DO, Adams AJ, et al: Parental history and myopia: taking the long view [letter to the editor—in reply]. JAMA. 272:1256, 1994

38. Schwartz M, Haim M, Skarsholm D: X-linked myopia: Bornholm eye disease. Linkage to DNA markers on the distal part of Xq. Clin Genet 38:281, 1990

39. Sertie AL, Quimby M, Moreira ES, et al: A gene which causes severe ocular alternations and occipital encephalocele (Knobloch syndrome) is mapped to 21q22.3. Hum Mol Genet 5:843, 1996

40. Sertie AL, Soss V, Camargo AA, et al: Collagen XVIII, containing an endogenous inhibitor of angiogenesis and tumor growth, plays a critical role in the maintenance of retinal structure and in neural tube closure (Knobloch syndrome). Hum Mol Genet 9:2051, 2000

41. Young TL, Ronan SM, Drahozal LA, et al: Evidence that a locus for familial high myopia maps to chromosome 18p. Am J Hum Genet 63:109, 1998

42. Young TL, Ronan SM, Alvear AB, et al: A second locus for familial high myopia maps to chromosome 12q. Am J Hum Genet 63:1419, 1998

43. Naiglin L, Gazagne C, Dallongeville F, et al: A genome wide scan for familial high myopia suggests a novel locus on chromosome 7q36. J Med Genet 39:118, 2002

44. Mutti DO, Semina E, Marazita M, et al: Genetic loci for pathological myopia are not associated with juvenile myopia. Am J Hum Genet 112:355, 2002

Back to Top


* The authors and editors wish to acknowledge the contributions of the late Arnold Sorsby, MD, author of the previous chapter. Some of his material has been used in this edition.