Chapter 46
Tonometry, Tonography, and Aqueous Fluorophotometry
DAVID DUEKER
Main Menu   Table Of Contents

Search

TONOMETRY
TONOGRAPHY
REFERENCES

TONOMETRY
Determination of the intraocular pressure (IOP) is a central feature in the diagnosis and management of the glaucomas. A true measurement of IOP requires a direct fluid connection to the anterior chamber. Cannulation of the anterior chamber for measurement of IOP is used frequently in the laboratory and occasionally during surgery. This approach entails too many hazards for the routine clinical management of glaucoma, however. Therefore, we generally use indirect measurements of IOP—tonometry.

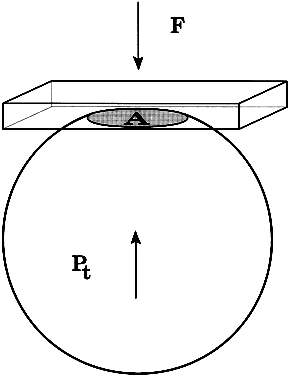
The pressure inside a flexible sphere can be estimated by using fixed forces to create measurable deformations of the wall or, conversely, by using variable forces to produce predetermined deformations of the sphere wall. Both approaches have been used in tonometry of the eye. The methods used are based on the Imbert-Fick principle, which states that if a plane surface is applied to a spherical membrane to cause a flattening of surface area, the pressure inside the spherical membrane will be equal to the applied force divided by the area of contact (Fig. 1).1,2 It must be emphasized that the Imbert-Fick principle is considered valid when the sphere is perfectly round, dry, elastic, and infinitely thin. Because the wall of the eye is none of these, application of the Imbert-Fick principle to tonometry requires careful attention to variations caused by the fundamental nature of the ocular tissues and to careful calibration of all tonometers in the laboratory.

Fig. 1. The Imbert-Fick principle. When a plane surface is applied to a flexible sphere with a force (F) causing an area (A) to be flattened, the pressure inside the sphere, Pt = F/A.

During the years 1905 to 1926, Hjalmar August Schiøtz, a Norwegian ophthalmologist, produced and refined a mechanical indentation tonometer that is still in common use.3 This tonometer uses a weighted plunger that rides freely in the center of a hollow cylinder (Fig. 2). The outer cylinder has a footplate with a concave radius of 15-mm curvature, which rests on the cornea during measurement. The weighted plunger indents the cornea centrally, and the amount of indentation is transferred to a scale at the top of the instrument by a lever mechanism, which converts 0.05 mm of plunger movement into 1-mm units on the read-out scale. It is clear that a soft eye allows more plunger indentation than does a hard eye; the Schiøtz scale displays large amounts of indentation as high scale readings and small amounts of indentation as low scale readings.

Fig. 2. Schiøtz tonometry. A hollow footplate (gray) rests on the cornea, while a freely moving weighted cylinder (black) indents the cornea. The softer the eye, the greater the amount of indentation. The amount of indentation is multiplied by a lever mechanism and displayed as a “Scale Reading” at the top of the instrument. Standardized tables, based on these scale readings and considering the weight on the central cylinder, provide an estimate of IOP.

When the Schiøtz tonometer is placed on the eye, a considerable force is applied to the cornea. This force is a combination of plunger weight plus the weight of the footplate cylinder and the accompanying scale. With the smallest plunger weight (5.5 g), the total weight of the instrument on the eye is 16.5 g. Resting this much weight on the eye raises IOP during the measurement. The pressure of clinical interest is the pressure of the eye in its natural state—that is, before the weight of the tonometer was applied. It is therefore necessary to use calibration tables to translate the readings made during tonometry into an estimate of the pressure that existed in the eye before the application of the tonometer. IOP during tonometry is called Pt, whereas IOP in the resting state before application of the tonometer is known as “P naught” or P0. One of the major contributions of Dr. Jonas Friedenwald was the calibration of the Schiøtz tonometer, which included a careful scientific study of the relation between Pt and P0.4,5

The indentation of the cornea caused by the Schiøtz tonometer displaces a small volume of fluid into the eye. This displaced fluid is accommodated by stretching or expansion of the ocular coats. Dr. Friedenwald found that the volume of fluid displaced was related to the logarithm of Pt by a factor that he called scleral rigidity. The tables that are commonly used to estimate IOP based on a Schiøtz scale reading assume an eye with normal scleral rigidity. It is important to remember that the tables give inaccurate estimates of IOP in eyes that do not have normal scleral rigidity. Perhaps the most common example is the patient with high myopia, a condition commonly associated with low scleral rigidity. In such a case, the eyeball is unusually elastic and allows the weighted plunger to indent the cornea more than an eye of normal scleral rigidity with the same pressure. This gives a falsely high scale reading on the tonometer and a correspondingly falsely low estimate of IOP. Such false low pressures can be hazardous; important elevations of IOP have been missed in myopes and other eyes with low scleral rigidity that were tested by indentation tonometry. This mistake can be avoided by using the applanation type of tonometer or by taking Schiøtz readings with different weights on the plunger and using these values in conjunction with a Friedenwald nomogram to calculate the P0 for that eye.

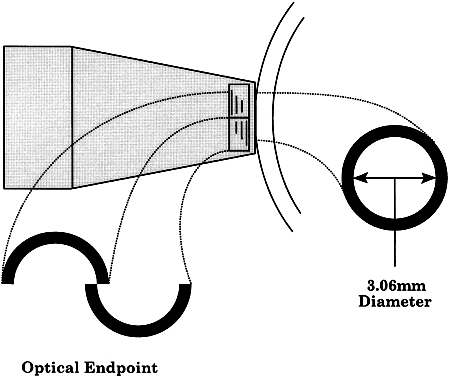
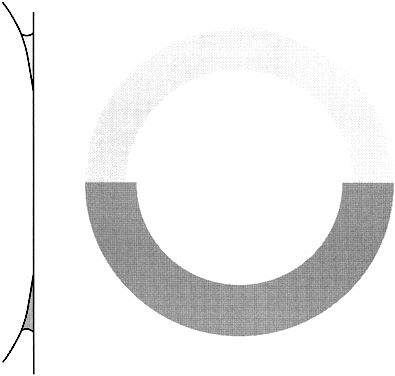
Using an applanation technique in which the cornea is flattened—not indented—eliminates many of the uncertainties of indentation tonometry. In the classic method developed by Goldmann, a circular area of the central cornea is flattened by pushing a plastic tonometer tip against the eye. The circle of applanation is delineated by a fluorescein-stained tear film (Figs. 3 and 4). The force required to flatten a circle of 3.06 mm is in grams a tenth of IOP in mmHg. Therefore, a force of 1.6 g is required to flatten this circular area when IOP is 16 mmHg. The 3.06-mm diameter circle of applanation was chosen because of this simple 10:1 relation between IOP and grams of force; this area is within the range in which the natural bending force of the cornea is canceled by the capillary attraction created by the tear film between the tonometer head and the cornea.6,7 Flattening so small an area of the cornea creates little fluid displacement within the eye. Therefore, scleral rigidity is not a factor in Goldmann applanation tonometry.

Fig. 3. Goldmann applanation tonometry. When the cone tip is pressed against the anesthetized cornea, a small circular area is flattened. The applanated area appears as a dark circle surrounded by a narrow ring of fluorescent tear film. Opposing prisms in the tip of the cone split the image, so that the viewer sees two dark half circles, each with a narrow fluorescent outer border. The force on the cone is adjusted until the inner corners of the fluorescent half rings just touch; at this optical end point, the applanated area is correct: a circle with diameter = 3.06 mm.

Fig. 4. Effect of fluorescein concentration on Goldmann applanation tonometry. The circle of applanation is outlined by a meniscus of fluorescein-stained tear film. If the tear film has too low a concentration of dye (upper half of diagram), it is difficult to define the thin inner edge of the meniscus and the examiner may perceive an enlarged circle—thus underestimating IOP. (Moses RA: Fluorescein in applanation tonometry. Am J Ophthalmol 49:1149, 1960.) The optimal fluorescein concentrations have been determined,25 and the most reliable way to obtain accurate readings is through use of a pre-mixed anesthetic/fluorescein drop. (Grant WM: Fluorescein for applanation tonometry. More convenient and uniform application. Am J Ophthalmol 55:1252, 1963; Quickert MH: A fluorescein-anesthetic solution for applanation tonometry. Arch Ophthalmol 77:734, 1967.) Though a “ring of contact” may be seen with anesthetic alone, measurements made without fluorescein underestimate IOP. (Hoffer KJ: Applanation tonometry without fluorescein. Correspondence. Am J Ophthalmol 88:798, 1979; Roper DL: Applanation tonometry with and without fluorescein. Am J Ophthalmol 90:668, 1980.)

Although the Goldmann tonometer is generally used at the slit lamp, the principle is not exclusive to that arrangement. Portable tonometers based on this principle (e.g., the Perkins tonometer8 and Draeger tonometer9) allow the increased accuracy of the Goldmann technique to be brought to the bedside, operating room, and glaucoma-screening setting. These portable applanation tonometers are especially useful in young children who may be frightened and restless at the slit lamp.

Other tonometric instruments are available. It is a credit to the design and precision of the Goldmann instrument that virtually all new tonometers are evaluated in comparison with it. The air-puff tonometer (American Optical) works on an applanation principle in which the force required to flatten a portion of the cornea is delivered in a carefully calibrated bolus of air rather than through mechanical contact.10 The moment of flattening is recorded optoelectronically and converted into an estimate of IOP by a computer in the machine. This instrument is especially useful when many patients need to be screened or it is desirable or necessary to avoid topical anesthesia.

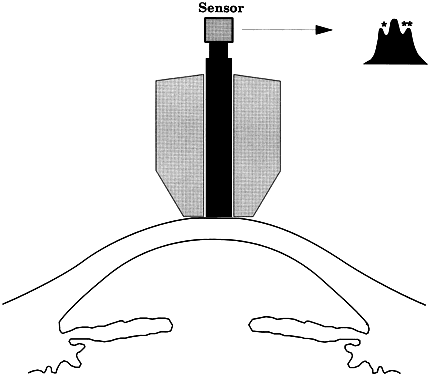
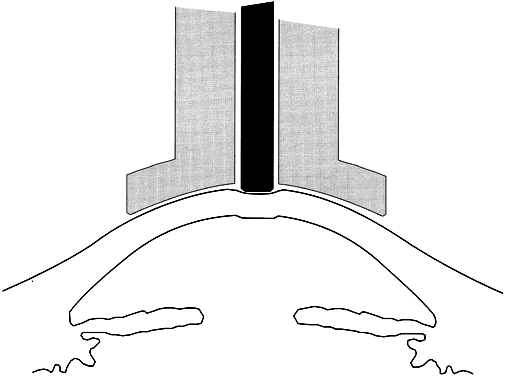
When the cornea is scarred, irregular, or edematous, it is useful to have a tonometer available that does not depend on an optical end point for its measurement. Two instruments are useful in this instance: the Mackay-Marg tonometer11,12 and the Pneumotonometer.13 The Mackay-Marg tonometer has a central piston, with provision to sense force surrounded by a passive annulus (Fig. 5). This instrument is brought up to the cornea by hand and the force necessary to applanate the cornea to the diameter of the central piston is determined by an electronic display.14 In the Pneumatonometer, a plunger is also brought up to the cornea by hand but the actual force of application is supplied by compressed gas. A valving mechanism at the tip of the plunger determines the end point for the measurement; the gas pressure necessary to achieve the end point is sensed and displayed electronically.15 Laboratory and clinical studies have shown that the Pneumatonometer causes some degree of indentation.16,17

Fig. 5. McKay-Marg applanation tonometry. In this method, the applanation force is sensed electronically through a sensor attached to the central cylinder (black). As the instrument is applied to the eye, force on the central cylinder increases (small graph) until the full area of the cylinder face is flattened against the cornea. Just beyond this point, some of the force is transferred to the surrounding inert portion of the instrument (gray), which produces a small dip in the force recording from the central cylinder (*). At this point, a fixed area has been applanated and the force required has been determined (marked by the dip in the recording). A second end point is similarly recorded (**) as the instrument is withdrawn from the eye. This test method has been rendered both convenient and portable in a small handheld unit—the Tonopen. One tonometry/manometry comparison study found an inadequate level of accuracy with this instrument, however. (Eisenberg DL, Sherman BG, McKeown CA et al: Tonometry in adults and children. A manometric evaluation of pneumatonometry, applanation, and Tonopen in vitro and in vivo. Ophthalmol 105:1173, 1998.)

An alternative method of applanation tonometry involves the application of fixed forces, with subsequent measurement of the area applanated. This can be done simply with small weights that have a flat surface. The area flattened by a particular weight can be determined either from staining patterns on the face of the weight (Maklakoff instrument); if the applanating surface is transparent, it can be determined from direct visual observation of the flattened area (Halberg instrument).18

NORMAL PRESSURE

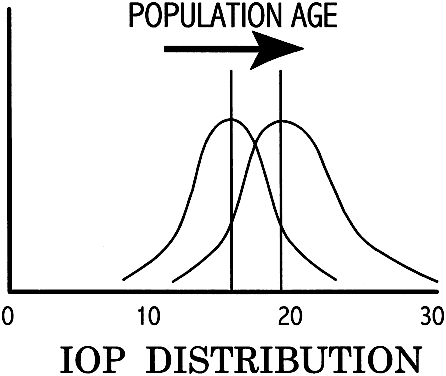
In the normal young adult population, the mean of IOP readings lies between 15 and 16 mmHg, with a distribution that is bell-shaped and symmetric (Fig. 6).19 With increasing age, most studies indicate a tendency toward increased IOP, with skewing of the distribution toward higher pressures.20 Conversely, IOP in normal infants and children tends to run lower than that of the young adult population.21

Fig. 6. IOP and age. In the normal young adult population, the mean IOP is 15 to 16 mmHg and the distribution approximates a normal bell-shaped curve. In the aging normal population, the mean IOP is higher and the distribution is skewed to the right. This presumably reflects both a true trend to higher IOP with age and a certain porportion of new undiagnosed glaucoma cases in development.

CIRCADIAN VARIATION IN INTRAOCULAR PRESSURE

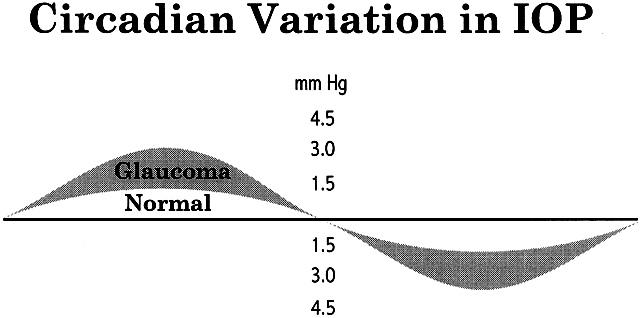
Intraocular pressure shows a natural cycle, with a phase of relative elevation followed by a phase of relative depression occurring over a 24-hour period—a circadian rhythm.22 The mechanism for this variation almost certainly involves variations in aqueous humor production, although other factors contribute also. The magnitude of the variation is greater in glaucoma patients—in some studies, three or four times greater than in the normal population (Fig. 7). The larger pressure swing in glaucoma patients is logically related to poor outflow facility but because outflow facility and diurnal variation of IOP are not highly correlated, other factors also must play a role.

Fig. 7. Variation of IOP. Like many physiologic parameters, IOP fluctuates on a daily cycle. The fluctuation in normal patients is low but it is more pronounced in glaucoma patients. Study of this pattern in glaucoma patients has shown that peak pressures often occur outside normal office hours.

The most common daily cycle shows a tendency for higher pressures in the morning hours and falling pressures in the evening. This pattern is not universal, however, because peak pressures occur at any time of the day. Careful studies of IOP using home tonometry23 to track patients' normal daily patterns have shown that about 50% of peak pressures fall outside normal office hours.24 The practical consequences of circadian variation in IOP are several.

First, no single reading of IOP can be considered to be representative. Likewise, no change in pressure should be labeled a therapeutic success or failure unless diurnal variation has been carefully considered. There are several practical approaches to this problem (Table 1).


TABLE 1. Neutralizing the Effect of Circadian IOP Variation

  Record the time of all pressure readings
  When changing therapy, schedule the next appointment at the same time of day
  When not changing therapy, vary the time of appointments to help reveal the circadian pattern
  If a consistent “peak time” is found, most appointments should be scheduled at or near this time
  When a patient seems to be losing ground despite “good IOPs,” schedule a series of pressure readings throughout the longest practical period
  If practical, instruct a family member in home tonometry


IOP = intraocular pressure.


POTENTIAL ERRORS IN TONOMETRY

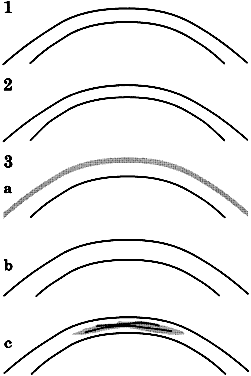
As noted, the eye does not meet the ideal criteria of the Imbert-Fick principle. This is particularly crucial at the cornea-tonometer interface, where variations in corneal thickness, flexibility, or composition can introduce substantial errors (Fig. 8). Abnormal thickness produces false high readings,25,26 whereas corneas that are thinner than normal—either naturally27 or as the result of laser refractive surgery28,29—produce false low readings. Numerous other factors have potential to produce important errors; many are listed in Table 2 and an extensive review is available. Some errors of tonometry can only be detected reliably by in vivo comparison of tonometric measurements with simultaneous manometry (see Table 2).16,30

Fig. 8. Corneal abnormalities and tonometry. Tonometry gives the most accurate estimate of IOP when the cornea is normal. Goldmann's instrument was designed assuming a corneal thickness of 520 μm. (1) If the cornea is thinner than this, the readings are artificially low in proportion to the degree of thinning. (2) When the cornea is thicker than normal, the readings are low if the thickening is due to epithelial edema. (3a) If the cornea is thickened because of an increase in normal stroma, or (3b) if the stroma is scarred—with or without thickening—(3c), the readings are artificially high.


TABLE 2. Sources of Error in Tonometry

  Ocular/Periocular Anomalies

  • Lid, muscle, orbit malformation, infiltration, or congestion
  • Corneal anomalies: thickness, scarring, edema (see Fig. 8)
  • Absence of “aqueous free space” behind cornea48
  • Abnormal scleral rigidity (indentation tonometry)

  Patient-induced
  • Lid squeezing
  • Breathholding, constrictive clothing
  • Eye/head movement
  • Unsuspected/unreported drug effects (usually → lower IOP) (e.g., recent ethanol ingestion, marijuana, systemic beta blockers)
  • Recent exercise (usually → lower IOP,49 may → higher IOP in pigmentary glaucoma)
  • Extraneous forces: hair, 50 moustache51

  Instrument Error
  • Poor maintenance, cleaning
  • Out of calibration

  Operation Error
  • Failure to consider/observe any of the above
  • Applying pressure to the lids
  • Using inappropriate fluorescein concentration
  • Failure to establish steady state through patient observation, repeat measurement
  • Failure to record time of day


IOP = intraocular pressure.


STERILIZATION OF TONOMETERS

Because tears may contain pathogens capable of causing both serious ocular disease and potentially fatal systemic disease, it is essential to disinfect all tonometers between patients. The MacKay-Marg and Tonopen require a protective cover. If this is changed between patients, no further sterilization is necessary. Although protective covers are available for other types of tonometers, chemical cleaning is used more often. Soaking the tonometer tip in a special container holding dilute (1:10) household bleach, hydrogen peroxide in a 3% solution, or 70% isopropyl alcohol is highly effective but great care must be taken to remove these toxic substances before contacting the eye. For practical purposes, many centers accept careful wiping with an alcohol sponge for tonometer disinfection.31
Back to Top
TONOGRAPHY
Generally, applanation techniques (particularly Goldmann's) have supplanted the indentation technique represented by the Schiøtz type of instrument. The primary reason is that the Goldmann reading can be taken with little disturbance to the eye. Goldmann applanation tonometry displaces a small quantity of fluid and therefore raises IOP only slightly during the actual reading. In contrast, the heavy weight and the corneal indentation associated with the Schiøtz tonometer causes a marked increase in the pressure of the eye during measurement, introducing several factors—primarily scleral rigidity—that are not sources of error with the Goldmann technique. There is, however, one aspect of the raised IOP during Schiøtz tonometry that is advantageous: the ability to make an estimate of aqueous outflow by a test called tonography.

Tonography is a clinical test of aqueous humor dynamics that was introduced by W. Morton Grant in 1950.32 Grant showed that analysis of a continuous recording from an electronic Schiøtz tonometer yielded estimates of aqueous outflow and rate of aqueous flow. The principle of the test may be traced to the massage effect, whereby pressure on the eye leads to a softening of the globe due to an increased outflow of aqueous humor induced by the higher pressure.33 Grant recorded the output of an electronic tonometer on a strip-chart recorder and showed that this data combined with the tonometer calibration of Friedenwald could be used to provide a quantitative expression relating the outflow of aqueous humor to the driving pressure. Grant called this value “the coefficient of aqueous outflow facility”(C).

The coefficient of aqueous outflow facility is calculated from Grant's formula:


Δ VT (Ptav - P0)

In this equation, C is equal to the change in ocular volume (ΔV) occurring over the time interval T as a result of the difference between the average pressure during tonography (Ptav) and the resting pressure in the eye before application of the tonometer (P0). The units for the outflow facility are given as μL/minute/mmHg. C can also be considered as the reciprocal of the expression for resistance to flow, which is written as a change in pressure over a change in flow rate. Linner34 found that episcleral venous pressure rises an average of 1.25 mmHg during Schiøtz tonometry; therefore, the formula is usually corrected by adding 1.25 to P0.

Because all the parameters of the formula except time derive from the calibration data for the Schiøtz tonometer, the accuracy of the facility calculation absolutely depends on the accuracy of the calibration data. In addition to the uncertainties inherent in the calibration of the Schiøtz tonometer,35 there are other potential sources for error in the calculation of facility. For example, the calculation assumes that the pressure change that results from placing the tonometer on the eye does not induce a change in the rate of production of aqueous humor or in the resistance of the outflow channels. There is evidence, however, that increased IOP results in some decrease in aqueous formation. In standard tonography, this effect is indistinguishable from true outflow facility and has therefore been called “pseudofacility.”36 Furthermore, there is laboratory evidence that increased IOP causes some increase in the resistance to aqueous outflow.37 In this way, by raising the pressure, tonography alters the parameter it seeks to measure.

Although the theoretic foundations of the test deserve careful consideration, the practical question is not whether the various assumptions are correct but whether the errors they may introduce are large enough to affect the validity and clinical use of the test. The test has proved to be of clinical and research value, yielding results that are internally consistent,38 reproducible, and in good agreement with determinations of aqueous flow and outflow resistance made by other methods.39,40 Tonography has contributed greatly to our knowledge of the mechanism of glaucoma and its treatment and remains the most simple and practical approach for clinical measurement of aqueous outflow facility—an important determinant of IOP.

Accurate Schiøtz tonometry requires a relaxed and cooperative patient and a skilled and dexterous operator. By prolonging the measurement of Schiøtz pressure to 4 minutes, tonography demands more of both patient and operator. It is important to maintain an atmosphere of quiet and calm. The test must be performed in a room without ringing telephones and interruptions from other patients and personnel. In addition, the mechanical part of the instrument requires careful cleaning and the electronics require regular calibration.

The output of the electronic tonometer is traced on a strip chart. A good test shows a gentle downward trend in the scale reading, with fine oscillations of the ocular pulse superimposed on the tracing (Fig. 9). Scale readings at 0 and 4 minutes are read from a smooth pencil line, which is drawn through the tracing to make a good visual approximation of the average slope. When the tracing is a good one, this average slope is easy to recognize and draw. If the tracing is of poor quality, the approximation is difficult to draw and should be a signal to the examiner that the record is probably not reliable.

Fig. 9. Tonography example. A tonogram from a patient with glaucoma. The initial scale reading of 4.5 with a 7.5-g weight means that the P0 (the resting pressure in the eye before applying the tonometer) was 28. The Pt (the increased pressure in the eye induced by Schiøtz tonometry) was initially 44.4 and fell gradually to 39.5 over 4 minutes, yielding an average pressure during tonograghy (Ptav) of 41.9. The increased flow induced by this extra pressure is the sum of the increased corneal indentation volume occurring during this period (Vcc) plus the decreased scleral distention volume (Vs) occurring simultaneously: in this instance, 2.6 (Vcc) + 2.4 μL (Vs) = 5 μL total volume change. Grant's Equation for C, the Facility of Aqueous OutflowWhere ΔV is the volume change in μL and T is time in minutes—usually 4. Substituting, for this case, As here, 1.25 is usually added to F0 to compensate for the small increase in episcleral venous pressure induced by tonography. The P0/C ratio for this eye is 28/0.10, or 280. Stated another way, under the influence of an average increased IOP of 12.65 mmHg (induced by applying a Schiøtz tonometer with a 7.5-g weight), an extra 5 μL of aqueous humor was forced through the outflow channels during a 4-minute period. This reflects a low aqueous outflow.
Having determined the values for the initial and the 4-minute readings, the value for C can be determined either by using Grant's tables and Friedenwald's calibration data in Grant's equation or by determining the value from composite tables that have been created for this purpose. The most complete source for such tables is the appendix of Becker and Shaffer's41 textbook on glaucoma.

Tonography is primarily used in settings where research is ongoing into the mechanisms of glaucoma and its treatment. It is not a test that is frequently conducted in an individual practitioner's office, although many find the test useful in the management of individual cases. The value of tonography may be considered in the framework of past contributions, present uses, and future potential.42 When the test was first introduced, there was general uncertainty regarding the derangement of aqueous dynamics that produced glaucoma—simply stated, that increased IOP could result from a hypersecretion of aqueous humor, increased resistance to its egress, or a combination of both factors. With a sensitive method of determining fluorescein turnover in the anterior chamber, Goldmann showed that glaucoma patients were not different from normal patients in the rate of aqueous flow. He concluded that open-angle glaucoma resulted from increased resistance to aqueous outflow. This important information was derived from relatively complex methods—methods that were not practical for general clinical use.

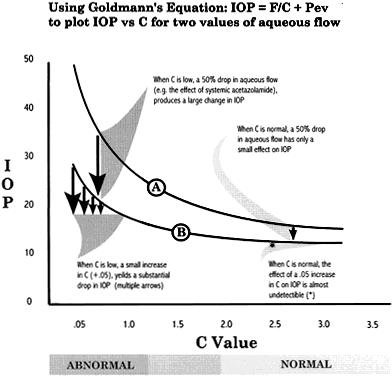
A year after introducing tonography, Grant published a large study of his findings in more than 1000 tonographic tests.32 Like Goldmann, Grant found little evidence that excess aqueous production was significant in any form of glaucoma that he studied. Increased resistance, quantitatively determined by tonography, was present and sufficient to fully explain the increased pressure in virtually every case. In addition, Grant found the test useful in studying the mechanisms of action of antiglaucoma medicines.43 For instance, he found that pilocarpine increased outflow facility, as did successful filtering surgery. Although tonography proved to be of great value in determining and understanding the mechanisms of glaucoma and its treatment (Fig. 10), it was not as useful as a predictive test for glaucoma. Diminished outflow facility was highly associated with the fully developed disease. Tonography was less helpful in identifying patients who would develop glaucoma, however. Undoubtedly, this is because of the well-recognized variability in the susceptibility of the nerve head to damage. Therefore, no test of aqueous dynamics—no matter how accurate—is infallible in predicting visual loss in glaucoma.

Fig. 10. Relation of IOP and aqueous outflow. For aqueous flow rates of 2 μL/minute (A) and 1 μL/minute (B), large changes in IOP occur only in the lower (glaucomatous) ranges of aqueous outflow (C Value). This explains the propensity of glaucomatous eyes for large variations in IOP and also demonstrates the difficulty of studying IOP-lowering therapy in normal subjects.

In the clinical setting, tonography is probably most helpful when there is poor correlation between IOP and aqueous outflow. An example is in inflammatory conditions in which aqueous production is abnormally decreased. In such a case, tonography provides a more accurate estimate of the function of the outflow channels than does IOP alone. Another occasion in which aqueous production may be artifactually decreased is in childhood glaucoma during examination under anesthesia. When IOP is artifactually reduced by anesthesia, tonography may provide important information about the true nature of the outflow system. Future use of tonography may see its greatest use in glaucoma research. As in the past, it will contribute to the understanding of any new medical or surgical approach for treatment of glaucoma and to our ability to define the mechanism in new types of glaucoma that may be recognized.

It should be noted that tonography measures only pressure-dependent outflow; that is, aqueous outflow that can be increased by increasing pressure within the eye. A separate pathway for aqueous outflow, the uveoscleral pathway, is pressureindependent44 and therefore not measured by tonography. In humans, this pathway normally constitutes only a small proportion of outflow, but new antiglaucoma drugs that affect prostaglandin receptors increase flow through this pathway and produce profound pressure-lowering effects. It is difficult to measure this pathway directly but an increase in uveoscleral flow can be presumed when a drug decreases IOP without affecting either tonographic outflow facility or aqueous flow rate.

FLUOROPHOTOMETRY

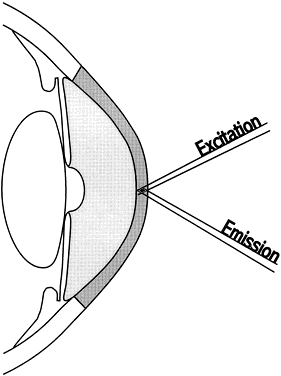
Aqueous humor flow can be determined by measuring the disappearance of fluorescein from the cornea and anterior chamber. In this technique, a reservoir of fluorescein is established in the corneal stroma by topical application of fluorescein drops several hours before the study. An interval of several hours is required to allow the fluorescein to distribute evenly in the cornea.

Fluorescein leaves the corneal stroma primarily through the endothelial surface, thereby entering the aqueous. Fluorescein leaves the aqueous primarily through the outflow tract, being carried away by the flow of newly formed aqueous entering the anterior chamber, mixing there, and then exiting through the outflow system. Thus, a measurement of the concentration of corneal and aqueous fluorescein as it declines over time is a good measurement of aqueous flow rate (Fig. 11).

Fig. 11. Measuring aqueous flow with fluorophotometry: an example. Fluorescein is introduced into the eye using topical instillations of the dye on the evening before testing. By the next morning, a uniform corneal stromal distribution of fluorescein exists, which is released almost exclusively through the endothelium into the anterior chamber. Fluorescein-stained aqueous humor is mixed with unstained newly formed aqueous humor and removed from the anterior chamber by the usual channels of outflow. Although many factors must be considered and controlled, the essential measurements are corneal stromal concentration (using a small sample area carefully separated from the aqueous humor, as shown) and aqueous humor concentration (measured by moving the sampling area into the anterior chamber while avoiding the region of newly formed aqueous humor at the pupil). Brubaker has provided typical data from a normal subject. (Brubaker RF: Clinical evaluation of the circulation of aqueous humor" in Duanes.) Measurements of fluorescein concentration in the right eye at 0800 hours were cornea, 806 ng/mL; anterior chamber, 94.3 ng/mL. An hour later the readings were cornea, 598 ng/mL; anterior chamber, 79.5 ng/mL. To determine the mass of fluorescein in each compartment, the volume of each compartment is determined using measurements of corneal thickness (in this case, 0.49 mm), corneal diameter (13.5 mm), and anterior chamber depth (2.8 mm). The volume of the cornea is estimated using the formula for the volume of a cylinder: In this case: The volume of the anterior chamber is estimated using the formula for a segment of a sphere: where h = axial depth of the anterior chamber and y = anterior chamber diameter. In this case: The total mass of fluorescein in the cornea and the anterior segment can then be calculated: The substraction of 1.5 ng/ml corrects for corneal autofluorescence in this patient. So, at 0800 hrs, By similar means, the mass at 0900 hours is calculated to be 60.6 ng, so the loss of fluorescein over the 1-hour period = 18 ng. As a first approximation, it is assumed that this 18 ng/60 minutes loss occurs completely from aqueous flow. Calculating average aqueous concentration during the hour: So, 1000 μL of aqueous humor “carries” 86.9 ng of fluorescein. We can then derive the flow rate necessary to remove this mass of fluorescein: In fact, because a small amount (5% to 10%) of the fluorescein leaves the anterior segment by diffusion into the iris, the true aqueous flow rate is correspondingly less. In practice, the test is more complicated than this example suggests. For one thing, the readings are usually repeated over several hours, and the necessary measurements and calculations are often more complex than this example. More detailed discussions are available.

The technique has been used for several decades and most recent data derives from work in Brubaker's laboratory.45–47 He and his colleagues have shown that the average flow of aqueous humor in normal patients is about 2.5 μL/minute. The flow in glaucoma patients is similar to the normal population; there is no suggestion for a hypersecretory form of glaucoma from these studies, which agrees with tonography studies showing a decline in outflow facility in glaucoma.

The flow rate changes slightly with age, showing a mild decrease with advancing age. There is also a fairly pronounced diurnal variation; the waking flow rate is almost double the rate during sleep.

Determining the mechanism of drug action is an important use for this technique. Fluorophotometry has shown significant decrease in aqueous flow with carbonic anhydrase inhibitors, beta blockers, and apraclonidine; no significant change with parasympathomimetics; and a slight increase in flow with epinephrine.

Back to Top
REFERENCES

1. Fick A: Ueber Messung des Druckes im Auge. Arch fur Die Gesammte Physiologie Des Menschen & Der Thiere 42:86, 1888

2. Imbert A: Theorie sur ophthalmotonometre. Arch Ophthalmol 5:358, 1885

3. Schiøtz H: Ein neuer Tonometer. Arch Ophthalmolmol 52:401, 1905

4. Friedenwald JS: Contribution to the theory and practice of tonometry. Am J Ophthalmol 20:985, 1937

5. Friedenwald JS: Some problems in the calibration of tonometers. Am J Ophthalmol 31:935, 1948

6. Goldmann MH: Un nouveau tonometre a applanation. Bull Soc Franc Ophthalmol 67:474, 1954

7. Goldmann VH, Schmidt T: Uber applanationstonometrie. Ophthalmolmologica 134:221, 1957

8. Perkins ES: Hand-held applanation tonometer. Br J Ophthalmolmol 49:591, 1965

9. Draeger J: Simple hand applanation tonometer for use on the seated as well as on the supine patient. Am J Ophthalmol 62:1208, 1966

10. Grolman B: A new tonometer system. Am J Optom Arch Am Acad Optom 49:646, 1972

11. Kaufman HE, Wind CA, Waltman SR: Validity of MacKay-Marg electronic applanation tonometer in patients with scarred irregular corneas. Am J Ophthalmol 69:1003, 1970

12. McMillan F, Forster RK: Comparison of MacKay-Marg, Goldmann, and Perkins tonometers in abnormal corneas. Arch Ophthalmol 93:420, 1975

13. West CE, Capella JA, Kaufman HE: Measurement of intraocular pressure with a pneumatic applanation tonometer. Am J Ophthalmol 74:505, 1972

14. Mackay RS, Marg E: Fast, automatic, electronic tonometers based on an exact theory. Acta Ophthalmol 37:495, 1959

15. Durham DG, Bigliano RP, Masino JA: Pneumatic applanation tonometer. Trans Am Acad Ophthalmol Otol 69: 1029, 1965

16. Eisenberg DL, Sherman BG, McKeown CA et al: Tonometry in adults and children. A manometric evaluation of pneumatonometry, applanation, and Tonopenin vitro and in vivo. Ophthalmology 105:1173, 1998

17. Moses RA, Grodzki WJ Jr: The pneumatonograph. A laboratory study. Arch Ophthalmol 97:547, 1979

18. Halberg GP: Hand applanation tonometer. Trans Am Acad Ophthalmol Otol 72:112, 1968

19. Leydhecker W, Akiyama K, Neumann HG: Der intraokulare Druck gesunder menschlicher Augen. Klin Monatsbl Augenheilkd 133:662, 1958

20. Armaly MF: On the distribution of applanation pressure. 1. Statistical features and the effect of age, sex, and family history of glaucoma. Arch Ophthalmol 73:11, 1965

21. Pensiero S, Da Pozzo S, Perisutti P et al: Normal intraocular pressure in children. J Pediatr Ophthalmol Strabismus 29: 79, 1992

22. Ziemer RC: Circadian variations in intraocular pressure. In Ritch R, Shields MB, Krupin T (eds): The Glaucomas,

23. Ziemer RC, Wilensky JT, Gieser DK et al: Application of a self tonometer to home tonometry. Arch Ophthalmol 104:49, 1986

24. Wilensky JT, Gieser DK, Mori MT et al: Self-tonometry to manage patients with glaucoma and apparently controlled intraocular pressure. Arch Ophthalmol 105:1072, 1987

25. Herndon LW, Choudhri SA, Cox T et al: Central corneal thickness in normal, glaucomatous, and ocular hypertensive eyes. Arch Ophthalmol 115:1137, 1997

26. Johnson M, Kass MA, Moses RA et al: Increased corneal thickness simulating elevated intraocular pressure. Arch Ophthalmol 96:664, 1978

27. Whitacre MM, Stein RA, Hassanein K: The effect of corneal thickness on applanation tonometry. Am J Ophthalmol 115:592, 1993

28. Emara B, Probst LE, Tingey DP et al: Correlation of intraocular pressure and central corneal thickness in normal myopic eyes and after laser in situ keratomileusis. J Cataract Refract Surg 24:1320, 1998

29. Rosa N, Cannamo G, Breve MA et al: Goldmann applanation tonometry after myopic photorefractive keratectomy. Acta Ophthalmol Scand 76:550, 1998

30. Whitacre MM, Stein RA: Sources of error with use of Goldmann-type tonometers. Surv Ophthalmol 38:1, 1993

31. Shields MB: Textbook of Glaucoma. Baltimore, Williams & Wilkins

32. Grant WM: A tonographic method for measuring the facility and rate of aqueous flow in human eyes. Arch Ophthalmol 1950;44:204.

33. Moses RA, Bruno M: The rate of outflow of fluid from the eye under increased pressure. Am J Ophthalmol 33:389, 1950

34. Linner E: Episcleral venous pressure during tonography. Acta XVII Cong Ophthalmol 3:1532, 1955

35. Anderson DR, Grant WM: Re-evaluation of the Schiøtz tonometer calibration. Invest Ophthalmol 9:430, 1970

36. Kupfer C: Clinical significance of pseudofacility. Am J Ophthalmol 75:193, 1973

37. Ellingsen BA, Grant WM: The relationship of pressure and aqueous outflow in enucleated eyes. Invest Ophthalmol 10:430, 1971

38. Armaly MF: On the consistency of tonography. Invest Ophthalmol 3:77, 1964

39. Becker B, Constant MA: The facility of aqueous outflow. A comparison on tonography and perfusion measurements in vivo and in vitro. Arch Ophthalmol 55:305, 1956

40. Hetland-Eriksen J, Odberg T: Experimental tonography on enucleated human eyes. I. The validity of Grant's tonography formula. Invest Ophthalmol 14:199, 1975

41. Tables for Tonometry and Tonography. In Hoskins D, Kass MA (eds): Becker-Shaffer's Diagnosis and Therapy of the Glaucomas. St. Louis, Mosby

42. Grant WM: Tonography: past, present, and future. Trans Am Acad Ophthalmol Otolaryngol 85:252, 1978

43. Grant WM: Tonography. In Newell F (ed): Transactions of the Third Macy Conference on Glaucoma. Macy Foundation, 1959

44. Bill A: Conventional and uveo-scleral drainage of aqueous humor in the cynomulgus monkey (Macaca irus) at normal and high intraocular pressures. Exp Eye Res 5:45, 1966

45. Brubaker RF, McLaren JW: Uses of fluorophotometry in glaucoma research. Ophthalmology 92:884, 1985

46. Brubaker RF: Measurement of Aqueous Flow by Fluorophotometry. In Ritch R, Shields MB, Krupin T (eds): The Glaucomas

47. Brubaker RF: Flow of aqueous humor in humans (The Friedenwald Lecture). Invest Ophthalmol Vis Sci 32:3145, 1991

48. Feldman RM, Katz LJ, Spaeth GL et al: Ocular palpation in pseudophakia. Am J Ophthalmol 104:307, 1987

49. Lempert P, Cooper KH, Culver JF et al: The effect of exercise on intraocular pressure. Am J Ophthalmol 63:1673, 1967

50. Purcell JJ, Tillery W: Hair glaucoma (Correspondence). Arch Ophthalmol 89:530, 1973

51. Ritch R, Reyes A: ‘Moustache glaucoma’ (Correspendence). Arch Ophthalmol 106.1505, 1988

Back to Top