|
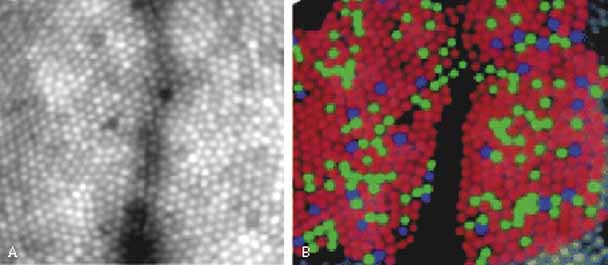
Fig. 6 A: Adaptive
optics image of the retinal cone mosaic 1 degree nasal to the fovea. The
retina was illuminated with 550 nm light. Approximately 50 images were averaged.
The small circles are individual cone outer segments. B: Pseudo color
image of the retinal cone mosaic. The colors red, green, and blue represent
the locations of individual L, M, and S cones respectively. The subject
and retinal region shown correspond to Figure
6A. Individual cone types were assigned using selective
bleaching experiments. (From http://www.opt.uh.edu/research/aroorda/.
The images were taken at the University of Rochester and are provided courtesy
of Austin Roorda and David Williams.) |