Chapter 14
Visual Function Testing: Clinical Correlations
ELIOT L. BERSON
Main Menu   Table Of Contents

Search

CONE AND ROD DISTRIBUTION ACROSS THE HUMAN RETINA
DARK ADAPTATION TESTING
SPECTRAL SENSITIVITY TESTING
COLOR VISION TESTING
FULL-FIELD ERG
FOCAL ERG
MULTIFOCAL ERG
OSCILLATORY POTENTIALS
VISUAL-EVOKED CORTICAL POTENTIAL
ELECTRO-OCULOGRAM
CLINICAL ASSESSMENT OF PATIENTS WITH RETINAL DISEASE
ACKNOWLEDGMENTS
REFERENCES

Visual function tests provide criteria to determine the extent and type of retinal malfunction in patients with retinal disease. This chapter provides an overview of some selected measures of retinal function that are useful as aids in the diagnosis of retinal diseases, particularly those that involve the cone and rod photoreceptors.
Back to Top
CONE AND ROD DISTRIBUTION ACROSS THE HUMAN RETINA
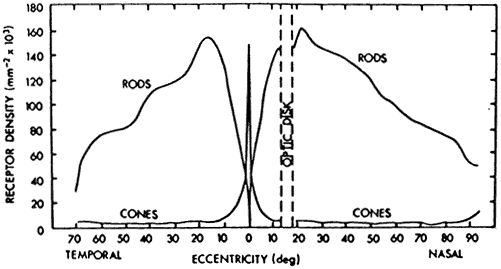
When we align each eye along its visual axis, we achieve fine visual acuity in part because of the high density of cones in the fovea (central 5 degrees).1 However, it is sometimes not appreciated that more than 90% of the cones in the normal human retina are outside the fovea (Fig. 1) and that cones can provide us with a full visual field under daylight (photopic) conditions. A patient with stationary night blindness with normal cone function and absent rod function can have full kinetic visual fields in the Goldmann perimeter. A patient with advanced macular degeneration has a central scotoma with loss of macular cones, but the majority of the cones outside the macula are still intact. In contrast, a patient with advanced cone degeneration by definition has lost cones across all or nearly all the retina.

Fig. 1. Distribution of rods and cones in the normal human retina. Corresponding perimetric angles from the fovea at 0 degrees are given. (After Osterberg; from Pirenne MH: Vision and the Eye, London, The Pilot Press, 1948)

Rods are distributed across all of the normal human retina except in the foveola (central 1 degree 40 minutes); rod density is maximal 20 to 40 degrees eccentric to the foveola (see Fig. 1).1 Rods can provide us with a nearly full visual field under scotopic conditions (i.e., under starlight or moonlight) and under dim photopic conditions as well. A patient with congenital rod monochromacy (i.e., complete achromat) with absent cone function and normal rod function has a small central scotoma but an otherwise full visual field in the Goldmann perimeter. Because cones and rods occur in approximately equal numbers in the macula (i.e., central 18.4 degrees), a patient with advanced macular degeneration with a 10- to 20-degree-diameter central scotoma by definition has lost not only macular cones but also macular rods. A patient with retinitis pigmentosa with a midperipheral scotoma has also by definition lost both rods and cones in the retinal area corresponding to the scotoma.

The normal human retina has about 130 million photoreceptors; the rods outnumber the cones by about 13 to 1. Patients with normal cone function and absent rod function would be expected to have a visual acuity of 20/20 and have normal color vision. Patients with normal rod function and absent cone function would be expected to have visual acuity of 20/200 and have absent color vision. Patients can read fine newspaper print with either their cones or their rods, although patients with only rod function usually require magnification to read. Patients with macular degeneration with large areas of retained peripheral (i.e., extramacular) cone or rod function can read fine print with either their peripheralcones or their peripheral rods with the appropriatemagnification.

Back to Top
DARK ADAPTATION TESTING
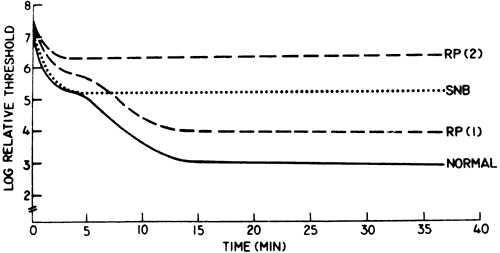
The cone and rod systems both have the capacity to dark adapt.2,3 After exposure to a steady white adapting light in the Goldmann-Weekers dark adaptometer, the threshold responses of a normal subject to an 11-degree white test light presented 7 degrees above the fovea in the dark over 40 minutes can be described by a biphasic curve, with an initial cone limb followed by a rod limb, as illustrated in Figure 2. Final cone threshold after 5 to 7 minutes of dark adaptation is normally 100- to 1,000-fold (i.e., 2 to 3 log units) higher than final rod threshold after 40 minutes of dark adaptation. A patient with stationary night blindness with normal cone function and absent rod function has a normal cone limb but no cone-rod break at 5 to 7 minutes; final threshold even after 40 minutes is determined by cones and is therefore 2 to 3 log units above normal. The patient with stationary night blindness can see normally under dim photopic conditions that exist at night near street lights or in dimly lit areas and experiences “night blindness” only under starlight or moonlight conditions.4

Fig. 2. Representative dark adaptation curves for a normal subject, a patient with congenital stationary night blindness (SNB), and two patients with moderately advanced retinitis pigmentosa, RP(1) and RP (2). (Berson EL: Night blindness: Some aspects of management. In Faye E, ed: Clinical Low Vision, p 302. Boston, Little, Brown & Company, 1976)

Figure 2 also illustrates dark adaptation curves from two representative patients with retinitis pigmentosa (RP); they show impairment of the initial cone limb of dark adaptation and, in the case of RP-2, no cone-rod break. Both patients RP-1 and RP-2 have night blindness under dim photopic conditions because they have impairment of their cone thresholds. Stated in another way, patients RP-1 and RP-2 report “night blindness” primarily because of impaired cone function.4 Some patients with early macular degeneration also have difficulty seeing at night, but on further questioning they report that this symptom occurs when driving at night and trying to adjust after looking at oncoming headlights; these patients appear to be experiencing difficulty with the capacity of their macular cones to dark adapt.

Back to Top
SPECTRAL SENSITIVITY TESTING
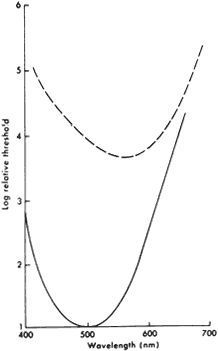
Rods and cones are sensitive to light across all or nearly all of the visible spectrum (i.e., deep blue, 400 nm, to deep red, 700 nm). The peak sensitivity of the rods is near 500 nm, whereas the average peak sensitivity of the cones is near 555 nm (Fig. 3). Under dark-adapted conditions rods are about 1,000-fold more sensitive than cones in the blue-green region of the spectrum; the difference is smaller or absent in the orange-red region. Under dark-adapted conditions a dim blue light presented to a normal subject near threshold will first be reported simply as white light because the subject is using rods and therefore cannot appreciate color; only when the light is made about 1,000-fold brighter will a normal subject be able to use cones and see the test light as blue. Similarly, under dark-adapted conditions a dim blue light can be used to isolate rod function in the electroretinogram (ERG); a bright blue light can elicit both rod and cone responses if the light is sufficiently bright to be seen by the cones.5

Fig. 3. Continuous line is CIE (Commission International de l'Eclairage) scotopic luminosity curve (rod spectral sensitivity function) derived from psychophysical measurements and placed at a level for normal human subjects; dashed line is Wald's photopic luminosity curve (spectral sensitivity function for the cone mechanisms under photopic conditions) derived from psychophysical measurements of peripheral retinal function. Electroretinographic spectral sensitivity curves for normal rod and cone systems also respectively approximate the solid line and dashed line curves. (Berson EL: Electrical phenomena in the retina. In Hart WM, ed: Adler's Physiology of the Eye. Clinical Application, 9th ed, p 641. St. Louis, CV Mosby, 1992)

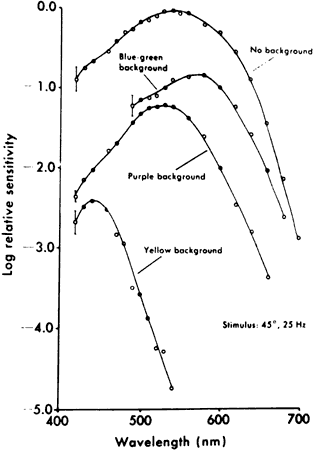
The peak sensitivity of the ERG to a 25-Hz white flickering light is near 555 nm under dark-adapted conditions (Fig. 4) because rods cannot respond to stimuli above 20 Hz under these test conditions.6 In the presence of different-colored steady background lights that desensitize one or another cone system by bleaching that system (i.e., dissociating opsin from vitamin A), one can isolate blue, green, and red cone function to this 25-Hz white flicker-ing light. In the presence of a bright yellow back-ground light that desensitizes green and red conefunction, presentation of this flickering light results in a peak sensitivity near 440 nm, thereby isolating blue cone function. In the presence of a purple adapting light that desensitizes the blue cone and red cone systems, the peak sensitivity of the eye is near 540 nm, thereby isolating green cone function. In the presence of a blue-green steady background light that desensitizes the blue cone and green cone systems, the peak sensitivity is near 580 nm, thereby isolating red cone function. In each case the chromatic background minimizes or eliminates the contribution of two cone mechanisms, thereby permitting isolation of the third cone mechanism. These three spectral sensitivities, derived from ERG testing in the presence of chromatic backgrounds, correspond with the absorption characteristics of individual blue, green, and red cones, determined with microspectrophotometry, thereby helping to establish that these three functions are generated by the blue (short wavelength sensitive), green (middle wavelength sensitive), and red (long wavelength sensitive) cones, respectively.7,8

Fig. 4. Spectral sensitivity of curves describing response of monkey cone mechanisms to 25-Hz stimulus under conditions of dark adaptation or in the presence of intense chromatic backgrounds. Sector disc (50% duty cycle) was used to present flickering stimuli (25 Hz). Stimulus subtended visual angle of 45 degrees and was centrally superimposed on 68-degree background. Spectral sensitivity data were based on the log relative quantum flux at the retina necessary to elicit a criterion amplitude in the electroretinogram. Red cone mechanism showed best separation on blue-green adapting field, green cone mechanism on purple adapting field, and blue cone mechanism on yellow adapting field. Data points (circles) are an average of three animals. Vertical lines equal ± 1 SD (average). (Mehaffey L III, Berson EL: Cone mechanisms in the electroretinogram of the cynomolgus monkey. Invest Ophthalmol 13:266, 1974)

Hereditary retinal diseases involving the photoreceptors can be subdivided with these spectral sensitivities in mind. For example, blue cone monochromats are patients born with blue cone and rod function and absent red and green cone function; their sensitivity function under dark-adapted conditions is governed by rods and peak sensitivity is near 500 nm, and their sensitivity under light-adapted conditions is governed by blue cones and peak sensitivity is near 440 nm. A rod monochromat with complete loss of cone function and normal rod function has a peak sensitivity near 500 nm under both light- and dark-adapted conditions. A patient with X-linked cone degeneration-protan type has a loss of red and green cone function with predominant loss of red cone function at a time when rod function and blue cone function appear to be normal. Patients with RP appear to have an abnormality of rod and cone function across all or nearly all the retina in the early stages of the condition.

Back to Top
COLOR VISION TESTING
The Farnsworth Panel D-15 and the Ishihara plates are useful to screen patients for X-chromosome-linked, red (protan) deficiency or X-chromosome-linked, green (deutan) deficiency.9–11 Dominantly inherited blue (tritan) deficiency can also be detected on the Farnsworth Panel D-15. Blue cone monochromat color test plates can be used to distinguish young males with X-linked blue cone monochromacy from young males with autosomal recessive rod monochromacy: the former pass this test and the latter fail it.12 All of these color vision tests should be performed without pupillary dilation under standardized lighting conditions that approximate daylight.

Acquired red-green and/or blue-yellow color defects are well known. For example, a patient with cone dystrophy may report an acquired red-green dyschromatopsia due to loss of cone photoreceptors in the macula. Red-green dyschromatopsia with a mild blue-yellow loss of discrimination has been observed in optic neuropathies. Acquired blue-yellow deficiency has been observed in patients with RP as well as in glaucoma and diabetic retinopathy. Acquired color deficiencies can be monitored with an anomaloscope, which allows color matches; for example, a patient with choroidal disease and sub-retinal fluid in the fovea may have cone photoreceptor disorientation with a consequent shift in the Rayleigh color match to a higher red primary ratio (i.e., pseudoprotanomaly).9,11

When color vision tests are used to assess retinal photoreceptor function, these tests provide information about patches of cones. For example, a patient with advanced macular degeneration with a central scotoma may fail the Ishihara plates because of loss of central cones and yet perform the Farns-worth Panel D-15 correctly by viewing the color caps with extramacular cones. Color vision tests that rely on manual dexterity and conceptual ordering of color caps (e.g., the Farnsworth Panel D-15) should be interpreted with caution in children younger than 10 years of age.9

Back to Top
FULL-FIELD ERG
The light-evoked electric response from the eye, or ERG, is a mass response generated by cells across the entire retina. Loss of half of the photoreceptors is associated with an approximately 50% reduction in full-field ERG amplitude. Although the rods outnumber the cones 13 to 1, the cones account for 20% to 25% of the full-field ERG response to single flashes of white light under dark-adapted conditions. The full-field ERG is primarily generated by extramacular (i.e., midperipheral and far peripheral) cones and rods, because patients with a four-disc diameter central scar and normal extramacular function have normal full-field cone and rod ERG responses. The central macula (central 10 degrees) contains about 450,000 cones, or about 7% of the total retinal cone population.5,13 This could account for the inability of the full-field ERG system to detect abnormalities confined to the central macula. Conversely, a patient with advanced RP and less than 10-degree-diameter fields can still retain 20/20 vision and have a profoundly reduced full-field ERG.5,14

A patient with a macular and perimacular scar would be expected to have a reduction in the full-field cone and rod ERG, taking into account the fact that large numbers of cones and rods are normally located in the macular and perimacular zone. A patient with a large peripheral chorioretinal scar would also be expected to have a reduction in the full-field rod and cone ERG because of loss of rod and cone function in the peripheral retina. Patients with losses of patches of retina characteristically show reductions in amplitude with normal b-wave implicit times (i.e., time intervals between stimulus onset and major cornea-positive peaks of the rod or cone responses).15

In the ERG, the initial cornea-negative component (i.e., negative relative to baseline) or a-wave is generated by the photoreceptors, whereas the later cornea-positive component or b-wave is generated by cells proximal to the photoreceptors. A patient with a central retinal artery occlusion would be expected to have a preserved a-wave and loss of the b-wave. Patients with reduced vision due to optic atrophy or cortical disease and preserved outer retinal function would be expected to have normal ERGs to full-field flashes of light.5

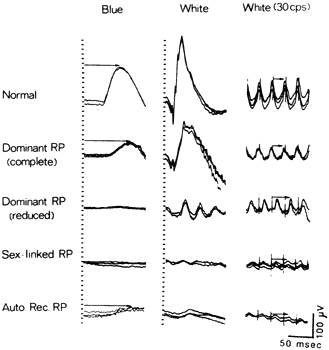
Rod responses are conventionally separated with dim blue light, whereas cone responses are isolated with a flickering light at 30 cycles per second (e.g., 30 Hz). Representative full-field ERGs are illustrated in Figure 5 from a normal subject and four children, ages 9 to 14, with early RP. Rod responses to dim blue light under dark-adapted conditions (left column) are reduced in all genetic types and, when detectable, are delayed in b-wave implicit times, as designated by horizontal arrows. Cone responses to 30-cycles-per-second white flickering light (right column) are normal or reduced in amplitude and normal or delayed in b-wave implicit times. In the dominant with reduced penetrance, X-linked, and autosomal recessive forms of RP, cone b-wave implicit times, displayed by arrows in the right column, are so delayed that a phase shift occurs between the stimulus artifacts (designated by the vertical lines) and the corresponding response peaks; each stimulus flash elicits the next-plus-one response in contrast to the normal. In the mixed cone-rod responses to single flashes of white light under dark-adapted conditions (middle column), the cornea-negative a-wave generated by the photoreceptors is reduced in amplitude in all genetic types, pointing to the involvement of the photoreceptors in these early stages.16

Fig. 5. Electroretinographic responses for a normal subject and four patients with retinitis pigmentosa (ages 13, 14, 14, and 9). Responses were obtained after 45 minutes of dark adaptation to single flashes of blue light (left column) and white light (middle column). Responses (right column) were obtained to 30-cycles-per-second (or 30-Hz) white flickering light. Calibration symbol (lower right corner) signifies 50 msec horizontally and 100 μV vertically. Rod b-wave implicit times in column 1 and cone implicit times in column 3 are designated with arrows. (Berson EL: Retinitis pigmentosa and allied retinal diseases: Electrophysiologic findings. Trans Am Acad Ophthalmol Otolaryngol 81:659, 1976)

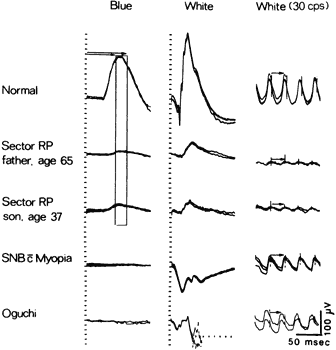
The subnormal responses with delayed b-wave implicit times seen in the widespread progressive forms of RP contrast with the subnormal responses with normal b-wave implicit times seen in self-limited sector RP (Fig. 6). For example, a father and son with dominantly inherited sector RP, separated in age by almost 30 years, have comparably reduced amplitudes and normal b-wave implicit times. These patients usually have an area of intra-retinal pigment confined to one or two quadrants of the periphery of each eye with loss of peripheral rods and cones with consequent reductions in both rod and cone amplitudes. Rod b-wave implicit times are within the normal range (designated by the vertical bars), and cone b-wave implicit times are also within the normal range, as each stimulus elicits the succeeding response as seen in the normals. The focal loss of retinal function seen in sector RP is comparable to that recorded from a patient with a large peripheral chorioretinal scar.15,16

Fig. 6. Electroretinographic responses of a normal subject and four patients with sector or stationary retinal disease. Horizontal arrows (column 1) designate range of normal rod b-wave implicit times, and vertical bar defining this range (mean ± 2 SD) has been extended through responses of patients with sector retinitis pigmentosa. Responses (middle column) from patient with Oguchi's disease are interrupted by reflex blinking, so the latter part cannot be illustrated. Cone implicit times in column 3 are designated with arrows. (Berson EL: Retinitis pigmentosa and allied retinal diseases: Electrophysiologic findings. Trans Am Acad Ophthalmol Otolaryngol 81:659, 1976)

In Figure 6 ERGs are also illustrated from a patient with stationary night blindness with myopia with a defect in intraretinal rod transmission and from a patient with Oguchi's disease with a defect in rod neural adaptation to show that forms ofstationary night blindness also have normal coneb-wave implicit times. These ERGs in patients with stationary night blindness are contrasted with the delays in b-wave implicit time seen in patients with progressive forms of night blindness associated with RP (see Fig. 5). Therefore, the full-field ERG can be used as an aid in defining the type and extent of rod and cone involvement and the long-term prognosis in some patients with hereditary retinal diseases.16

Full-field ERGs can be used not only to detect which patients are affected with the early stages of RP but also to determine which relatives are normal. In families with RP, patients age 6 and older with normal full-field ERGs with normal cone and rod amplitudes and normal cone and rod b-wave implicit times have not been observed to develop RP at a later time.16

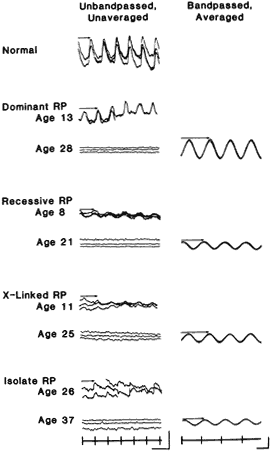
Computer averaging and narrow bandpass filtering have extended the range of detectability of ERG responses 100- to 1,000-fold. Responses that were undetectable without computer averaging or narrow bandpass filtering (i.e., < 10 μV) can be monitored down to a level of 0.05 μV with these techniques. More than 90% of patients age 6 to 49 with RP with visual field diameters greater than 8 degrees have detectable ERG responses with computer averaging and narrow bandpass filtering, thereby making it possible to quantify the amount of remaining visual function and follow the course of their condition (Fig. 7).17,18

Fig. 7. Full-field 30-Hz electroretinograms from a normal subject and four patients with retinitis pigmentosa (RP) tested at an 11- to 15-year interval. Stimulus onset, vertical markers; calibration symbol (left column, lower right) designates 100 μV vertically for the normal subject and top three patients and 40 μV vertically for the bottom patient and 50 msec horizontally for all traces; calibration (right column, lower right) designates 2 μV vertically for the dominant, X-linked, and isolate patients and 0.3 μV for the recessive patient and 20 msec horizontally for all traces. B-wave implicit times are designated with arrows. ( Andréasson SOL, Sandberg MA, Berson EL: Narrow-band filtering for monitoring low-amplitude cone electroretinograms in retinitis pigmentosa. Am J Ophthalmol 105:500, 1988) (Reprinted with permission from Elsevier Science Inc.)

The computer-averaged ERG was used as the main outcome measure in a randomized, controlled, double-masked trial among 601 adults from 1984 to 1991 to determine whether vitamin A or vitamin E, alone or in combination, would halt or slow the progression of the common forms of RP.19 Mean annual rates of decline of remaining ERG amplitude were slowest for the group taking 15,000 IU per day of vitamin A and fastest for the group taking 400 IU per day of vitamin E. A beneficial effect of vitamin A on preserving visual field area was also observed among a subset of 125 patients who could perform visual field testing with great precision.20 Based on these results, it has been recommended that most adults with the common forms of RP take 15,000 units of vitamin A palmitate daily under the supervision of their ophthalmologist and avoid high-dose supplements of vitamin E, such as the 400 units used in this trial.

Back to Top
FOCAL ERG
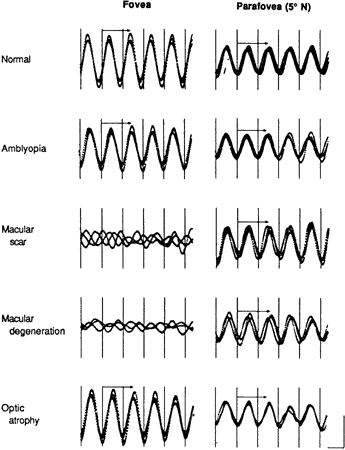
We can now visualize stimuli on the fundus and record from focal areas within the macula.21,22 These focal ERGs are elicited with a stimulator ophthalmoscope. With this instrument, a 4-degree, 42-Hz white flickering stimulus is presented within a 10-degree white steady surround; this flickering stimulus allows isolation of cone function, and the steady surround permits visualization of the fundus. The surround also desensitizes the retina just outside the stimulus, thereby minimizing any possible responses that could be generated by the effect of stray light from the stimulus. A patient with decreased vision and a one-disc diameter or larger central macular scar would be expected to have foveal cone ERG responses indistinguishable from noise when the stimulus is centered within the scar, but normal responses when the stimulus is centered outside of the scar in a parafoveal area that appears normal on ophthalmoscopic examination. A patient with decreased vision due to strabismic amblyopia or optic atrophy would be expected to have a normal foveal ERG (Fig. 8).23

Fig. 8. Foveal and parafoveal cone electroretinograms from a normal subject and four patients with visual acuity of 20/200. Two or three consecutive computer summations (n = 128) are shown. Vertical lines denote stimulus onset; arrows denote b-wave implicit time to corresponding response peak. Calibration symbol in lower right corner denotes 20 msec horizontally and 0.25 μV vertically. (Jacobson SG, Sandberg MA, Effron MH, Berson EL: Foveal cone electroretinograms in strabismic amblyopia. Trans Ophthalmol Soc UK 99:353–356, 1980)

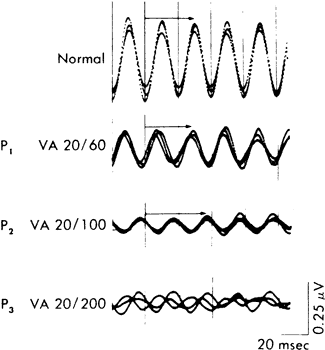
Foveal cone ERGs elicited with a stimulator ophthalmoscope are illustrated in Figure 9 for a normal subject and for three patients with juvenile hereditary macular degeneration with visual acuities ranging from 20/60 to 20/200. These patients had normal full-field cone flicker responses (i.e., >50 μV), but foveal cone ERGs were reduced in amplitude (i.e., < 0.18 μV in this test system) without (patient 1) or with (patient 2) delays (i.e., >38 ms) in implicit times, or indistinguishable from noise (patient 3).22 These foveal ERGs are quantitated with computer averaging and narrow bandpass filtering, thereby permitting detection of these small responses. Focal cone ERGs have proved useful in detecting and quantitating macular cone malfunction in patients with early stages of juvenile recessively inherited macular degeneration with visual acuity reduced to 20/50 or below. Patients with visual acuity less than 20/100 have had smaller and slower foveal cone ERGs than those with better visual acuity.24

Fig. 9. Foveal cone electroretinograms for a normal subject and three patients (P1, P2, and P3), ages 11, 13, and 23, respectively, with juvenile hereditary macular degeneration (Stargardt's disease). Responses represent computer summation of 128 sweeps; three consecutive runs are illustrated. Arrows designate b-wave implicit times for detectable responses. (Sandberg MA, Jacobson SG, Berson EL: Foveal cone electroretinograms in retinitis pigmentosa and juvenile macular degenerations. Am J Ophthalmol 88:702, 1979) (Reprinted with permission from Elsevier Science Inc.)

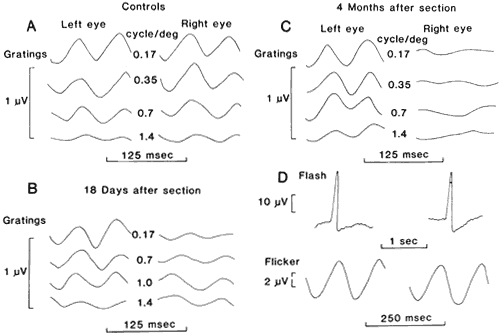
Responses from the central retina can be elicited not only in response to flashes of light but also in response to a phase reversing pattern stimulus, usually a grating or checkerboard displayed on a television screen. The pattern elements (checks or bars) periodically reverse position, so that the bright bars become dim and vice versa, although the sum of all bars has a constant brightness at all times. The responses can be reliably assessed only when the stimulus is known to be focused on the retina and to be stable on the fovea during testing. In contrast to the flash ERG, it has been reported that the pattern ERG can be eliminated by transection of the optic nerve (Fig. 10), supporting the idea that the pattern response is generated by the inner retina.25 However, there is some question as to whether the entire response is produced by ganglion cells, as the pattern ERG from a patient with surgical resection of the optic nerve showed a small residual response 30 months after surgery.26 The pattern ERG may have clinical value in monitoring inner retinal diseases such as glaucoma or optic nerve abnormalities, but an abnormal pattern response should be interpreted as reflecting inner retinal or optic nerve disease only when it is known that the outer retina is functionally intact, as abnormal pattern ERGs have also been reported in macular degenerations involving the photoreceptors.27

Fig. 10. Examples of pattern-reversal electroretinograms recorded from one cat before and after the section of the right optic nerve. A. Control records obtained from the two eyes before the section of the optic nerve. B and C. Records obtained 18 days and 4 months after the optic nerve section. Each record is the average of 500 responses. Stimulus: vertical sinusoidal grating reversed in contrast 16 times per second; contrast, 30%; mean luminance, 10 cd/m2. The spatial frequency is indicated next to each record. D. Electroretinogram in response to 50-msec light flashes (250 trolands) and to light flickering at 8 Hz (mean luminance, 10 cd/m2; amplitude of square-wave modulation, 40%) recorded from the two eyes 4 months after section of the right optic nerve. (Maffei L, Fiorentini A: Electroretinographic responses to alternating gratings before and after section of the optic nerve. Science 211:953, 1981)

Back to Top
MULTIFOCAL ERG
The multifocal ERG (mERG) is recorded by asking the patient to fix on the center of a computer monitor display containing an array of hexagons that increase in size with distance from the center.28 Typically the sizes of the hexagons are scaled inversely with the gradient of cone receptor density so as to produce focal ERG responses of approximately equal amplitude in normal subjects. The retinal size of the display varies but is usually less than 35 degrees in radius. During stimulation the display appears to flicker because each hexagon goes through a pseudorandom sequence (the m-sequence) of black and white presentations. While the patient views this display, an ERG record is obtained using the same electrodes and amplifiers employed for standard ERG recording; usually either 61 or 103 focal responses are derived, with each response tied to stimulation in a particular hexagon. Most of the mERG is either directly generated by bipolar cells or due to inner nuclear activity driven by these cells. The implicit time of the mERG, rather than the amplitude, appears to be the more sensitive measure of damage to photoreceptors in RP.29 The efficacy of this technique, if any, for detecting glaucomatous damage remains to be clarified.30,31 The mERG may be considered “little ERGs” reasonably close to responses obtained with more traditional focal stimulation.31 It remains to be established to what extent the mERG can be used to follow the course of retinal disease over time.
Back to Top
OSCILLATORY POTENTIALS
The normal human ERG elicited with high-intensity light stimuli shows a large a-wave with a series of rhythmic oscillations superimposed on the b-wave. These rhythmic oscillations, called oscillatory potentials, are generated more proximally than either the a- or b-wave, most probably in the distal region of the inner plexiform layer, and may derive from bipolar cells based on feedback from other cells, in particular amacrine cells.32 Oscillatory potentials are considered of clinical importance because they disappear in patients with inner retinal ischemia, as is sometimes seen in patients with central retinal vein occlusion or diabetic retinopathy (Fig. 11). Oscillatory potential amplitudes have been considered useful in predicting the progression of diabetic retinopathy to the more severe proliferative stages.33 In patients with media opacities, a reduction in the ratio of oscillatory potential amplitude to a-wave slope can suggest inner retinal malfunction.34 Studies of multifocal oscillatory potentials have revealed prolonged latencies in patients with insulin-dependent diabetes and retinopathy not visible on ophthalmoscopy.35 The relative sensitivity of oscillatory potential amplitudes versus fluorescein angiographic changes as an early indicator of inner retinal ischemia remains to be clarified.

Fig. 11. Full-field electroretinograms recorded from a normal subject, a patient with central retinal vein occlusion (CRVO), and a patient with diabetic retinopathy in response to a white flash of 1.85 log ft.L-sec after 45 minutes of dark adaptation. These recordings illustrate the diminution of oscillatory potential amplitudes in the two patients compared with the normal subject. Two or three consecutive traces are superimposed for each recording.

Back to Top
VISUAL-EVOKED CORTICAL POTENTIAL
Visual-evoked cortical potential (VEP) testing can be used to assess central foveal cone function in patients with macular disease. The central 2 degrees generates about 65% of this response. The confounding effect of stray light can be minimized by the use of pattern reversal stimuli. The VEP has had limited value in measuring macular function behind a lens opacity because smaller-than-normal responses can result from reduction of stimulus sensitivity and from image blur on the retina produced by the opacity. The VEP can be abnormal in diseases of the outer retina such as hereditary macular degeneration, as well as in diseases of the optic nerve or visual cortex. Abnormalities in the VEP can be more informative in localizing the site of visual loss if the patient is known to have normal photoreceptor function as revealed by a normal focal cone ERG.5

Multifocal VEPs can be obtained with techniques similar to those used to record the multifocal ERG. Evidence has been obtained that local ganglion cell/optic nerve damage can be detected with the multifocal VEP.36

Back to Top
ELECTRO-OCULOGRAM
The electro-oculogram (EOG) is recorded with leads placed near the inner and outer canthus and is measured by asking the patient to look straight at a fixation light and then laterally 30 degrees at a second fixation light, alternating between these fixation lights first for 10 to 12 minutes in the dark and then for an additional 15 to 20 minutes in the light. The lowest potential generated per 30 degrees of eye movement in the dark is compared with the largest potential generated per 30 degrees of eye movement in the light and recorded as the light rise to dark trough ratio. This ratio is usually 1.8 or greater for patients 50 years of age or younger.5

The EOG has particular clinical application in evaluating patients with dominantly inherited Best vitelliform macular dystrophy. Patients with Best macular dystrophy have a light rise to dark trough ratio less than 1.5 at a time when the full-field ERG is normal; abnormal EOGs have been observed not only in patients with a visible vitelliform macular lesion, but also in asymptomatic relatives with normal fundi who nevertheless have this condition. The EOG is normal in patients with dominantly inherited cone degeneration but is abnormal in patients with cone-rod dystrophies, as normal rods are required to generate a normal light increase in the EOG.5

The EOG is normal in early Plaquenil retinopathy but becomes abnormal when this toxicity involves large areas of the pigment epithelium and photoreceptors. Careful perimetric testing with fine red or white test lights, or testing with the Ishihara plates as a measure of remaining central field, can be used as an aid in detecting the pericentral scotomas that develop in early Plaquenil retinopathy.37

Back to Top
CLINICAL ASSESSMENT OF PATIENTS WITH RETINAL DISEASE
Visual function tests provide criteria for assessing cone and rod function across the retina in patients with known or suspected retinal disease. Patients can have malfunction of cones and rods without diagnostic changes on ophthalmoscopic examination or on fluorescein angiography. Patients with central visual loss can have impairments of cone or rod function or both; similarly, patients with peripheral visual loss can have impairments of cone or rod function or both. Hereditary retinal diseases can be subdivided into those that involve cone function alone (i.e., achromatopsia) or rod function alone (i.e., stationary night blindness) across the entire retina. If one photoreceptor system is abnormal and the other is normal in a hereditary retinal disease primarily involving photoreceptors, the long-term prognosis for the remaining normal photoreceptor system is usually good. Patients with loss of both cones and rods across all or nearly all the retina have a poor long-term visual prognosis, as seen in cases of RP. Therefore, knowledge of the amount of remaining cone and rod function has implications with respect to establishing diagnoses and estimating long-term visual prognoses.38,39

Different visual function tests provide complementary information. For example, color vision tests are used to assess patches of cones either in the macula or in the peripheral retina; a patient can have a normal color vision test and yet have an abnormal full-field cone ERG. Similarly, a patient can have a normal rod threshold on dark adaptation testing because of retention of a normal patch of functioning rods and yet have a subnormal full-field rod ERG because other areas of rod function are compromised. A patient can have an abnormal focal ERG and yet have a normal full-field ERG when disease is confined to the central macula.

In assessing a patient with known or suspected retinal disease involving the photoreceptors, color vision testing, dark adaptation testing, full-field ERG testing, and focal ERG testing are particularly useful in defining the extent and type of retinal disease. EOG testing is helpful in selected patients. These tests are best performed in patients older than age 6. ERG testing can be reliably performed in patients younger than age 6 with mild sedation.

Molecular genetic techniques are providing a new dimension for defining hereditary retinal diseases. More than 50 chromosomal loci have been mapped and mutations in more than 20 genes have been identified as causes of RP.40 Variable clinical expression has been observed among patients with RP with the same gene defect, suggesting that factors other than the gene abnormality itself are responsible for severity of disease.41,42 Functional assessment of patients with retinal disease, including those with known gene defects, provides a framework for determining the amount of remaining retinal function as well as a basis for following patients over time to help determine the course of their disease.

Back to Top
ACKNOWLEDGMENTS
This work was supported in part by National Eye Institute grant EY00169 and in part by the Foundation Fighting Blindness, Owings Mills, Maryland.
Back to Top
REFERENCES

1. Osterberg G: Topography of the layer of rods and cones in the human retina. Acta Ophthalmol 6(Suppl):1, 1935

2. Hecht S: Rods, cones and the chemical basis of vision. Physiol Rev 17:239, 1937

3. Mandelbaum J: Dark adaptation: Some physiological and clinical considerations. Arch Ophthalmol 26:203, 1941

4. Berson EL: Night blindness: Some aspects of management. In Faye E, ed: Clinical Low Vision, p 301. Boston, Little, Brown, 1976

5. Berson EL: Electrical phenomena in the retina. In Hart WM, ed: Adler's Physiology of the Eye. Clinical Application, 9th ed, p 641. St. Louis, CV Mosby, 1992

6. Mehaffey L III, Berson EL: Cone mechanisms in the electroretinogram of the cynomolgus monkey. Invest Ophthalmol 13:266, 1974

7. Brown PK, Wald G: Visual pigments in single rods and cones of the human retina. Science 144:45, 1964

8. Marks WB, Dobelle WH, MacNichol EF Jr: Visual pigments of single primate cones. Science 143:1181, 1964

9. Pokorny J, Smith V: Color vision and night vision. In Ryan SJ, ed: Retina, Vol. 1: Basic Science and Inherited Retinal Disease, p 109. St. Louis, CV Mosby, 1989

10. Reichel E: Hereditary cone dysfunction syndromes. In Jakobiec FA, Albert DM: Principles and Practice of Ophthalmology, 2nd ed, vol 3, p 2290. Philadelphia, WB Saunders, 2000

11. Pokorny J, Smith VC: Eye disease and color defects. Vision Res 26:1573, 1986

12. Berson EL, Sandberg MA, Rosner B, Sullivan PL: Color plates to help identify patients with blue cone monochromatism. Am J Ophthalmol 95:741, 1983

13. Wyszechi G, Stiles WS: Color Science, p 206. New York, John Wiley and Sons, 1967

14. Gouras P: Electroretinography: Some basic principles. Invest Ophthalmol 9:557, 1970

15. Berson EL, Gouras P, Hoff M: Temporal aspects of the electroretinogram. Arch Ophthalmol 81:207, 1969

16. Berson EL: Retinitis pigmentosa and allied retinal diseases: Electrophysiologic findings. Trans Am Acad Ophthalmol Otolryngol 81:659, 1976

17. Berson EL, Sandberg MA, Rosner B et al: Natural course of retinitis pigmentosa over a three-year interval. Am J Ophthalmol 99:240, 1985

18. Andreasson SOL, Sandberg MA, Berson EL: Narrowband filtering for monitoring low-amplitude cone electroretinograms in retinitis pigmentosa. Am J Ophthalmol 105:500, 1988

19. Berson EL, Rosner B, Sandberg MA et al: A randomized trial of vitamin A and vitamin E supplementation for retinitis pigmentosa. Arch Ophthalmol 111:761, 1993

20. Berson EL: Treatment of retinitis pigmentosa with vitamin A. Proceedings of the Fernström Symposium on Tapetoretinal Degenerations, Lund, Sweden. Digital J Ophthalmol 1998; http://www.djo.harvard.edu/meei/OA/RPB/RPB.html

21. Sandberg MA, Berson EL, Ariel M: Visually evoked response testing with a stimulator-ophthalmoscope: Macular scars, hereditary macular degeneration, and retinitis pigmentosa. Arch Ophthalmol 95:1805, 1977

22. Sandberg MA, Jacobson SG, Berson EL: Foveal cone electroretinograms in retinitis pigmentosa and juvenile macular degenerations. Am J Ophthalmol 88:702, 1979

23. Jacobson SG, Sandberg MA, Effron MH, Berson EL: Foveal cone electroretinograms in strabismic amblyopia: Comparison with juvenile macular degeneration, macular scars and optic atrophy. Trans Ophthalmol Soc UK 99:353, 1980

24. Sandberg MA, Hanson AH, Berson EL: Focal and parafoveal cone electroretinograms in juvenile macular degeneration. Ophthalmol Pediatr Gen 3:83, 1983

25. Maffei L, Fiorentini A: Electroretinographic responses to alternating gratings before and after section of the optic nerve. Science 211:953, 1981

26. Harrison JM, O'Connor PS, Young RSL et al: The pattern ERG in man following surgical resection of the optic nerve. Invest Ophthalmol Vis Sci 28:492, 1987

27. Lawwill T: The bar-pattern electroretinogram for clinical evaluation of the central retina. Am J Opthalmol 78:1231, 1979

28. Sutter EE, Tran D: The field topography of ERG components in man, I. The photopic luminance rsponse. Vis Res 32:433, 1992

29. Hood DC, Holopigian K, Seiple W et al: Assessment of local retinal function in patients with retinitis pigmentosa using the multi-focal ERG technique. Vis Res 38:163, 1998

30. Sutter EE, Bearse MA: The optic nerve head component of the human ERG. Vis Res 39:419, 1999

31. Hood DC: Assessing retinal function with the multifocal technique. In Osborne NN, Chader GJ, eds: Progress in Retinal and Eye Research, vol 19, p 607. Oxford, Pergamon Press, 2000

32. Heynen H, Wachtmeister L, van Norren D: Origin of the oscillatory potentials in the primate retina. Vision Res 25:1365, 1985

33. Bresnick GH, Korth K, Groo A, Palta M: Electroretinographic oscillatory potentials predict progression of diabetic retinopathy: Preliminary report. Arch Ophthalmol 102:1307, 1984

34. Sandberg MA, Lee H, Matthews GP, Gaudio AR: Relationship of oscillatory potential amplitude to a-wave slope over a range of flash luminances in normal subjects. Invest Ophthalmol Vis Sci 32:1508, 1991

35. Kurtenbach A, Langrova H, Zrenner E: Multifocal oscillatory potentials in type 1 diabetes without retinopathy. Invest Ophthalmol Vis Sci 41:3234, 2000

36. Hood DC, Zhang X, Greenstein VC et al: An interocular comparison of the multifocal VEP: A possible technique for detecting local damage to the optic nerve. Invest Ophthalmol Vis Sci 41:1580, 2000

37. Weiner A, Sandberg MA, Gaudio AR et al: Hydroxycholorquine retinopathy. Am J Ophthalmol 112:528, 1991

38. Berson EL: Hereditary retinal diseases: Classification with the full-field electroretinogram. In Lawwill T, ed: ERG, VER and Psychophysics, Documenta Ophthalmologica Proceedings Series, 13-XIV ISCERG Symposium, May 10–14, 1976, Louisville, KY, p 149. The Hague, Dr. W. Junk, 1977

39. Berson EL: Retinitis pigmentosa. The Friedenwald Lecture. Invest Ophthalmol Vis Sci 34:1659, 1993

40. RetNet: Summary of Genes Causing Retinal Diseases.http://www.sph.uth.tmc.edu/Retnet/summary.htm

41. Berson EL, Rosner B, Sandberg MA, Dryja T: Ocular findings in patients with autosomal dominant retinitis pigmentosa and a rhodopsin gene defect (Pro23His). Arch Ophthalmol 109:92, 1991

42. Berson EL, Rosner B, Sandberg MA, Dryja TP: Ocular findings in patients with autosomal dominant retinitis pigmentosa and rhodopsin, proline-347-leucine. Am J Ophthalmol 111:614, 1991

Back to Top