Chapter 109
Automated Perimetry Diagnostic Modalities in Ophthalmology
ANDREW M. PRINCE and DIANE P. ROMSAITONG
Main Menu   Table Of Contents

Search

HISTORICAL OVERVIEW
MANUAL PERIMETRY
COMPUTERIZED AUTOMATED STATIC PERIMETRY
ADVANTAGES
DISADVANTAGES
THRESHOLD
LIGHT INTENSITIES
MACHINE CHARACTERISTICS
SOFTWARE DESIGN
PRINTOUT
TEST SELECTION
NEW TESTING STRATEGIES
FACTORS INFLUENCING PERIMETRY
VARIABILITY
EVALUATION OF TEST RESULTS
INTERPRETATION
CONCLUSION
REFERENCES

Visual field testing has evolved considerably since the advent of automated perimetry. The transition from kinetic to static threshold perimetry has doubtlessly altered our conception of the field of vision. Computerized perimetry has provided a new technology for visual screening and the detection and management of glaucoma and may also be useful in the management of certain neuro-ophthalmologic and posterior segment disorders. Automated threshold perimetry facilitates standardized, accurate, and reproducible visual field testing in any office setting and has allowed for more reliable methods of quantitating the visual field for clinical as well as research purposes.
Back to Top
HISTORICAL OVERVIEW
The delineation of normal and pathologic visual fields has challenged investigators for centuries. Mariotte, in 1668, described the physiologic blind spot, the first identified scotoma. Thomas Young, in 1801, was among the first to provide precise measurements of the visual field.1 Approximately half a century later, von Graefe reported characteristic central and peripheral visual field defects in glaucoma and neurologic disorders.2 Förster devised the arc perimeter in 1869,3 and Bjerrum formulated the concept of the tangent screen visual field testing in 1889, which led to the development of quantitative kinetic campimetry.4 Sloan is credited with first describing stationary or static perimetry in 1939,5 but it was Goldmann who, in 1945, standardized instrument variables and introduced what has evolved as the prototype manual kinetic perimeter.6 Harms and Aulhorn, in 1959, combined static and kinetic perimetric methods in designing the Tübingen perimeter.7 Automated kinetic perimetry was introduced by Dubois-Poulsen and Magis in 1966.8 Lynn and Tate developed the first automated static perimeter in 1969.9 Since then, many other investigators have contributed to the evolution of automated perimetry and the computerized analysis of test data.

Although most ophthalmologists are proficient in the technique and interpretation of manual kinetic perimetry, many have had little experience with automated perimetry. To comprehend the basic principles and applications of automated perimetry, one must be familiar with the basic terminology and principles of kinetic field testing as well as several concepts of visual physiology.

Back to Top
MANUAL PERIMETRY
Traquair defined the visual field as an “island of vision in a sea of darkness.”10 This island or hill of vision was contoured as a three-dimensional graphic representation of differential light sensitivity at each point in the field of vision, with the peak corresponding to foveal fixation. This manner of conception of the field of vision facilitates a clear understanding and comparison of kinetic and static techniques of visual field testing (Fig. 1). Perimetric evaluation of the visual field by an examiner without automation may be accomplished by static testing, kinetic testing, or a combination of the two means. Static testing involves presenting stimuli of varying sizes and intensities at a fixed location to determine the presence and depth of a scotoma. In manual kinetic perimetry, a series of stimuli of fixed intensity and size are moved from nonseeing to seeing areas of the visual field. The foci identified kinetically as corresponding to points of equal retinal sensitivity along the various meridians are connected by a curve, constituting an isopter. Each isopter, therefore, represents a horizontal cross-section through a given level of the topographic hill of vision (see Fig. 1). The techniques for kinetically determining a mapping of the visual field include tangent screen, arc perimeter, autoplot, and Goldmann-type perimeters.

Fig. 1. Center: A graphic representation of Traquair's island of vision. The island contour represents the field of vision, where the higher a loci is situated on the island, the more sensitive the point on the corresponding visual field at points corresponding to the peak of the island (foveal fixation). Top: The curves (isopters) labeled I4, II4, and III4 on the island of vision connect corresponding areas of equal threshold sensitivity and are plotted (kinetic perimetry). Bottom: The shaded region on the island delineates the area of the visual field to be tested statically. The three points within the shaded area on the surface of the island of vision have a specific height and therefore a threshold value. These values are recorded as points with specific threshold sensitivity values (dB).

Tangent screen visual field testing represents a form of campimetry, or measurement of the field of vision on a flat surface. Once suspicious areas are identified by kinetic techniques, with white or colored test objects, the depths of scotomas may be further explored by a static method with various stimulus sizes. Screening may also be accomplished by static suprathreshold testing by exploring various regions with a suprathreshold stimulus. Tangent screen field testing is inexpensive and convenient, requires relatively little training, and permits rapid assessment of a variety of pathologic states, particularly in neuro-ophthalmology. However, test parameters such as background illumination are not standardized and stimulus intensity cannot be varied. Also, the chore of monitoring patient fixation rests with the examiner. Visual field testing is generally limited to the central 30°, and evaluation of patient reliability is purely subjective.

Arc perimetry consists of a semicircular white band, with a radius of approximately 330 mm, serving as the background on which stimulus lights are presented. The band may be rotated at various angles to test desired meridians. Many of the same limitations of tangent screen testing are present, although perimetry may be performed beyond 30° as well as centrally.

The introduction of the manual bowl projection perimeter of Goldmann permitted standardization of testing distance, background illumination, stimulus size, and stimulus intensity. The bowl of the Goldmann perimeter measures 300 mm in radius and extends 95° to each side of fixation, enabling central and peripheral field testing. Stimulus size and intensity, measured in apostilbs (asb), can each be varied. By manual kinetic techniques, the stimulus is moved at a constant rate from a nonseeing area along each meridian until identified by the patient. Foci of identical retinal threshold sensitivity (isopters) are thereby identified.

Goldmann perimetry can also be used to obtain quantitative information by static threshold testing to further delineate the extent and depth of field cuts by varying stimulus parameters. Static suprathreshold methods may also be employed for rapid screening purposes. Test strategies such as the Armaly-Drance technique use both static and kinetic methods. This method employs the Goldmann perimeter with static suprathreshold screening of the central field and static suprathreshold as well as kinetic techniques to explore the periphery.11–16

The Harms or Tübingen perimeter is another example of a manual bowl-type perimeter capable of both static and kinetic field testing. The primary intent of the Tübingen perimeter, however, was for static threshold examination because the stimulus intensity may be varied for fixed test objects.7,17

Manual static methods are often fatiguing for the patient and time-consuming. Kinetic techniques, although more rapid, are more dependent on patient reaction time and speed of target movement, and are less quantitative. Manual perimetry, in contrast to automated techniques, is certainly less expensive and provides for greater perimetrist-patient interaction. Automated techniques are more reproducible, provide standardized testing strategies, and are less subject to examiner experience and technique.

Many of the principles of visual physiology, testing strategies and patterns, and examination limitations and variables of kinetic perimetry also apply to automated perimetry.

Back to Top
COMPUTERIZED AUTOMATED STATIC PERIMETRY
Computerized automated static perimetry involves determining a map of a field of vision by employing a system whose operation is conducted by a machine programmed to perform explicit mathematical calculations (algorithms), taking the place of human operation, effort, and decision making. This, of course, does not imply that the automated perimeter can determine who requires an examination, which examination to perform, or the value of the information obtained, nor can it make diagnoses or clinical decisions. It is but a powerful tool for obtaining additional diagnostic data to be used in the care of a patient, to be orchestrated by a physician.

When the technology for automating perimetry became available, it was determined that automating kinetic perimetry was going to be a more difficult and involved chore than automating static perimetry. Although both would require controlling stimulus intensity and size, automating kinetic perimetry would also demand managing the speed and direction of stimuli in a variety of patterns.

Since the initial prototypes of automated perimetry were introduced, numerous instruments have been made available to clinicians, with some products being discontinued and new ones introduced as several companies changed hands. New machines continue to be made available with repeated improvements in both hardware and software, as a result of progressive advances in research physiology and computer technology. Machines are available with a broad range of capabilities as well as monetary cost. Choosing an instrument must involve a careful determination of the purpose of the machine, its cost, capabilities, and ease of use, and the patient population to be tested.

Throughout this chapter, references will be made to and examples given using the Octopus perimeter (Interzeag)18 and Humphrey Field Analyzer (Allergan Humphrey).19 These instruments were chosen because we have had more experience with them and because the bulk of published studies have employed these perimeters. There are many other machines available that perform comparably with these devices, and we are not endorsing either of the aforementioned products. Because the majority of instruments have many characteristics in common, including hardware and software, most of the comments and observations made may be applied to any automated perimeter.

Back to Top
ADVANTAGES
Automated perimetry offers numerous advantages over manual techniques. Test administration is more standardized and therefore more reproducible. Less input from a technician is required, minimizing testing variability. Reliability is improved with automated fixation monitoring and reduced examination time for static testing compared with manual static testing. Patient dependability may be quantitated and statistically assessed. Certain instruments provide the ability for data storage, allowing for statistical comparison of sequential fields and transmission of data. In addition, several studies have demonstrated that automated static techniques are as good as or superior to kinetic perimetry in detecting certain field defects.20–26 Finally, the limitation in manual perimetry of requiring a well-trained and experienced technician is eliminated, with minimal training necessary for machine operation.
Back to Top
DISADVANTAGES
There are, however, several disadvantages of automated perimetry. Automated perimeters are markedly more expensive than manual devices, require mechanical servicing, and therefore may have considerable periods of down-time. Full-field threshold testing may be prolonged, limiting the number of patients examined as well as causing patient fatigue, with possibly unreliable data. A significant number of patients do not test well with automated devices but perform well with manual techniques. Finally, many physicians are less familiar with the interpretation of automated static testing results.
Back to Top
THRESHOLD
A clear comprehension of the concept of threshold is needed for understanding automated static perimetry. Threshold is defined as the minimal intensity of light at which a stimulus is perceived by the visual system at a specific location in the field of vision. In statistical terms, threshold is defined as the point on a frequency- or probability-of-seeing curve at which a stimulus is perceived 50% of the time. Suprathreshold stimuli are those perceived greater than 95% of the time on the frequency-of-seeing curve, or any stimulus brighter than threshold. Infrathreshold stimuli are those perceived with a frequency of less than 5%, or any stimulus weaker than threshold. In actuality, an automated perimeter determines a threshold value by presenting stimuli of gradually increasing and decreasing intensities, determining the dimmest stimulus presented that is seen and the brightest that is not seen, and either averaging these values or using the last seen or not-seen stimulus as the threshold value. Threshold sensitivity may vary with retinal adaptation (background illumination), stimulus color and size, duration of stimulus presentation, and degree of stimulus movement.27 Static perimetry requires presenting a stimulus of varying intensity at a fixed location to determine the threshold sensitivity at that locus. This technique is performed at every designated location in a preselected area and pattern, and a map of threshold sensitivities for a given field of vision is generated (see Fig. 1).
Back to Top
LIGHT INTENSITIES
An understanding of the means by which values of light intensities are expressed is essential in analyzing automated visual fields. Apostilbs, an absolute measurement of light intensity reflected from a surface (luminance), are used in quantitative manual perimetry. When expressed in apostilbs, the range of intensities between the dimmest and brightest stimuli produced by a perimeter is quite large, as is the range of intensities of light over which the human eye is sensitive. Because variations in presented light intensities are not perceived in a linear manner but on a relative scale, the decibel scale, a logarithmic scale based on the maximum stimulus a perimeter may produce, proves to be a convenient method for expressing retinal sensitivities. Unlike apostilbs, decibels (dB) are logarithmic units (reciprocal of log intensity in apostilbs) and delineate a certain degree of reduction of a maximum stimulus that may be generated by a given perimeter.28 Intensities are expressed in decibel values where 1 dB is 0.1 log unit. The range of stimuli intensities provided by the Humphrey perimeter is 0 to 10,000 asb, corresponding to 50 to 0 dB, respectively. The Octopus perimeter may generate a range of stimuli from 0 to 1000 asb, equivalent to 40 to 0 dB, respectively. The higher the decibel value of threshold sensitivity for a given locus in the visual field, the dimmer that intensity is in apostilbs, and the more sensitive the visual system must be at that point for the stimulus to be perceived. Therefore, defective areas of a visual field present themselves as points in the visual field printout with lower decibel values than those in the surrounding normal areas.
Back to Top
MACHINE CHARACTERISTICS

CUPULA

Cupula distances, or bowl radii, differ in various machines. For example, the Octopus employs 100- and 85-cm bowls; the Humphrey Field Analyzer, like the standard Goldmann perimeter, uses a 33-cm cupula.18,19 These values dictate the warranted corrective lens for central field examinations.

BACKGROUND ILLUMINATION

Background illumination also varies among perimeters and is important in its effect on the level of retinal adaptation as well as the degree of contrast that may be generated. The level of background illumination in the Octopus perimeter is 4 apostilbs; the Humphrey Field Analyzer's is 31.5 apostilbs, similar to the Goldmann perimeter.18,19 Dimmer backgrounds allow a machine to present brighter stimuli to the visual system with respect to background light, which is helpful for evaluating patients with markedly reduced sensitivities. The disadvantage is the risk of shifting retinal sensitivity from the photopic range, with a subsequent alteration in retinal sensitivities. The effect of media opacities to decrease retinal sensitivities may be more pronounced in instruments using lower background illuminations.29 The possible advantages of the brighter background include the shorter time required for adaptation from ambient lighting conditions before test initiation and a testing situation in which the examination is less sensitive to aberrant light.

STIMULUS SOURCES

Instruments use three basic stimulus sources. The first is a fiberoptic cable system, with the advantages of low cost, no moving parts, and quiet operation. Its disadvantages include minimal flexibility in that stimuli are at fixed locations, are of fixed size, and cannot individually alter their intensities during any one examination. The light-emitting diode (LED) system has the same advantages and disadvantages as the fiberoptic system but is somewhat more flexible in that intensities of stimuli can be altered individually during a program. An additional disadvantage of both systems is a potentially increased variability of results compared with projection perimeters.30,31 The projection system, employed by both the Octopus and Humphrey perimeters, allows the greatest flexibility and versatility in the selection of test point locations as well as stimulus size, intensity, and color. Its disadvantages include expense, noise production, and need for more frequent maintenance. Unlike the fiberoptic and LED systems, the projection method allows for possible adaptation to kinetic capabilities.

STIMULUS SIZE

Most instruments incorporate a stimulus size equal to that of a Goldmann III target (4 mm2, 0.431°). Projection perimeters allow for the use of larger targets, which may allow quantification of focal defects in the presence of generalized field depression and identification of small remaining portions of the visual field in cases of extensive loss.32 LED and fiberoptic cable systems do not allow for the changing of target sizes.

STIMULUS INTENSITY

The perimeter may be programmed for testing at a fixed intensity or at a few levels of intensity, or to vary intensities for determining threshold sensitivities at test locations. Ranges of stimulus intensities vary among machines. The Humphrey Field Analyzer generates stimuli that range between 0 and 10,000 apostilbs (51 to 0 dB, respectively); the Octopus provides a range of 0 to 1000 apostilbs (40 to 0 dB, respectively).18,19 A fixed stimulus intensity in apostilbs has a different value in decibels on machines with different maximum stimuli, because decibels are relative measurements depending on maximum stimuli. A patient's ability to perceive a stimulus depends on the intensity of the stimulus in addition to the level of background illumination.

STIMULUS DURATIONS

Stimulus durations usually range between 0.1 (Octopus) and 0.2 (Humphrey) seconds,18,19 but they can be altered by the examiner with certain instruments. These values have been chosen because it has been shown that duration times greater than 0.5 seconds have no effect on the ability to detect stimuli by temporal summation, and exposure times greater than 0.2 seconds correspond to a patient's reaction time to the stimulus and might cause a shift in fixation.27

FIXATION MONITORING

Reliable fixation is essential for automated perimetry. Available techniques include viewing the patient's eye, electronic eye motion detectors, and blind-spot monitoring. Combinations of these systems are often used by various perimeters. The technician can view the patient's eye directly either with a telescope or a closed-circuit television monitor. Images of the eye may be taken from a camera coupled to a bowl-centered telescope and then easily viewed by the examiner. Eye movement sensors are the most sensitive fixation deviation detectors. Photoelectric detectors of corneal reflectivity and pupil image monitors are used. The disadvantage of fixation monitoring by electronic sensors is that it may be too sensitive, responding to minor physiologic alterations in fixation such as respirations or blinking. The blind-spot projection technique, the Heijl-Krakau method,33 assumes that if fixation is unchanged during an examination, the blind spot should remain constant. During an examination, the machine presents suprathreshold stimuli into the presumed or previously mapped blind spot. If the stimuli are seen, fixation has changed; if not, fixation has been maintained. The disadvantages include increased testing time and unknown status of fixation between points tested. Another disadvantage is that the visual field being tested may be only a central 10° island (as in end-stage glaucoma or retinitis pigmentosa), in which case a physiologic blind spot cannot be localized. If there exists a scotoma contiguous with the blind spot and deviations from fixation occur, if blind-spot checking stimuli are presented in the scotoma, fixation losses will not be detected. The advantage of the blind-spot projection technique is that it is less expensive and sensitive than electronic sensors and does not require technician input. This technique is usually supplemented by a telescope or video monitor, allowing the examiner to oversee fixation. When these techniques are used in combination, as they often are, monitoring of fixation is excellent.

In general, fixation is improved with random presentations of stimuli where patients cannot as easily anticipate the location of the next stimulus. For patients with central scotomas who cannot fixate on a central target, most instruments direct fixation by having patients look at the center of a diamond or cross pattern.

DATA STORAGE

Although not all perimeters have this capability, one of the greatest advantages of computerized automated perimetry is its capacity for data storage. Data are stored on hard disk or a floppy disk; this prevents data loss when the hard copy is inaccessible. Storage of data also permits statistical analysis and manipulations of individual visual fields or serial examinations of the same patient, as well as transfer of information to a central computer or another clinician or researcher.

Back to Top
SOFTWARE DESIGN

TESTING PATTERNS

Most instruments make available a series of basic testing patterns, allowing the examiner to choose the area of field tested and the density and distribution of points within. The options for areas to be tested include the central 30°, the peripheral 30° to 60° area, full 60°, central 10°, and central 5°. Special test configurations are also available, including glaucoma patterns (central 30° plus peripheral nasal step area and temporal periphery), peripheral nasal step area, temporal crescent region, and neurologic patterns for examining the vertical meridian. Custom tests for obtaining additional detail in certain abnormal areas may be added to any portion of the field in different patterns such as grids, clusters, or individual points. With certain instruments, the examiner has the option of combining several different patterns to increase the density of testing locations or total area tested. Custom tests can be stored and reused in subsequent testing.

TESTING STRATEGIES

Two basic categories of testing strategies are offered by most instruments: suprathreshold testing and threshold determinations.34 Either of these modalities of testing can be used with most of the above patterns or variations thereof.

SCREENING

Suprathreshold (supraliminal) screening enables rapid discovery of gross field defects. However, the degree of the resolved sensitivity decrease is not determined. A fixed stimulus that is presumed to be threshold at approximately 30° is used for the entire test area, without compensating for the normal contour of the hill of vision—that is, without adjusting for decreased sensitivity with increasing eccentricity (one-level or single-intensity strategy). These suprathreshold stimuli of fixed intensity are presented throughout the designated testing area. The tested points are recorded as either seen or not seen.

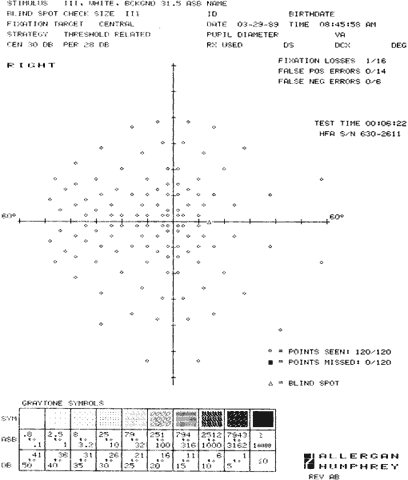
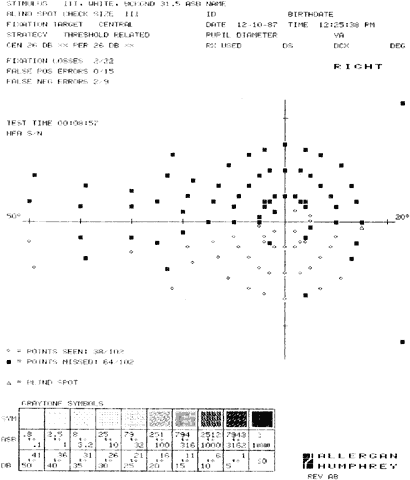
An alternative technique is the threshold-related screen. This strategy involves using a varying stimulus intensity at different test points, taking into account the effects of eccentricity on the expected threshold levels. The expected values are determined by either thresholding at two or four points in the field at the initiation of the test (prethresholding) or estimating the height of the hill of vision using age-matched normals. The intensity of the stimuli presented at any given point in the field is suprathreshold, usually 5 to 6 dB brighter than the expected threshold value. The points can be recorded as either seen or not seen (Figs. 2 and 3). Unseen points can then be tested with maximal stimuli to determine whether they are absolute or relative defects (three-zone strategy). These unseen points may also be thresholded to determine actual sensitivity at these defective locations. Certain strategies allow for testing of additional points around any abnormal points to delineate the size and density of the detected scotoma. The prethresholding strategy compensates for generalized depression, unlike using age-matched normals, better enabling the detection of localized abnormalities.

Fig. 2. Threshold-related screen. This screening examination on the Humphrey Field Analyzer encompasses a full 60° from fixation with 120 test locations. Results will be recorded as either seen (open circles) or not seen (solid squares). The center of the blind spot is designated as a triangle. This is a normal screening visual field examination.

Fig. 3. Threshold-related screen. This test is an Armaly full-field screening examination, intended for glaucoma testing. The examination emphasizes testing of the central field but includes screening of the peripheral nasal horizontal meridian for nasal steps and temporal periphery for sector defects. This examination is abnormal, demonstrating marked nasal constriction, a dense superior arcuate scotoma, and several abnormal areas in the inferior paracentral region. Full threshold testing is indicated to quantitate the abnormal field.

To designate the sensitivity level at which the screening test was run, or the height of the patient's hill of vision, the perimeter reports the central reference level. This represents the extrapolated sensitivity at fixation determined by thresholding several reference points away from fixation.

THRESHOLD DETERMINATIONS

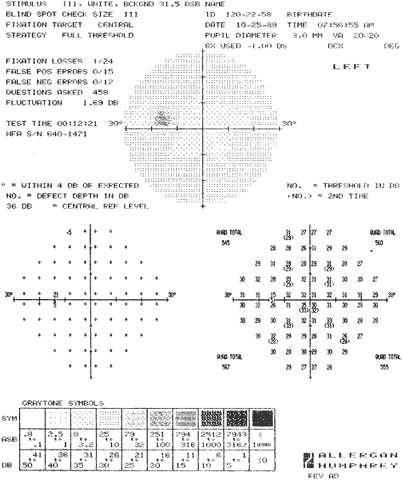
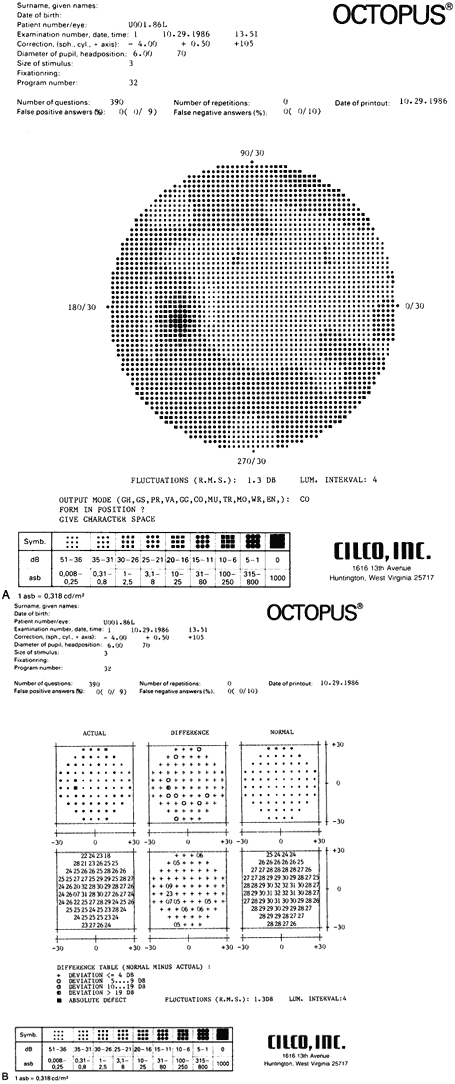
Threshold determination gives the most accurate and detailed information concerning the quality of a visual field but is the most tedious and time-consuming testing strategy (Figs. 4 and 5). For example, a normal full threshold test of the central 30° requires approximately 11 to 13 minutes; a significantly abnormal test may take 50% longer to complete, because thresholding an abnormal point requires more stimulus presentations. This testing modality involves performing the bracketing (“staircase,” “up-and-down”) process at every point tested. A stimulus brighter than the patient's expected threshold is presented at a point. If the stimulus is seen, stimuli of successively reduced intensity are presented until the stimulus is not seen. Then stimuli of increasingly higher intensity are presented until one is seen. Most instruments use 4-dB increments until threshold is crossed for the first time. Subsequent changes in intensity are usually of 2-dB steps. A point somewhere between suprathreshold and infrathreshold is determined to be threshold for that point. Most perimeters bracket until threshold is crossed twice, from the supra- and infrathreshold direction.

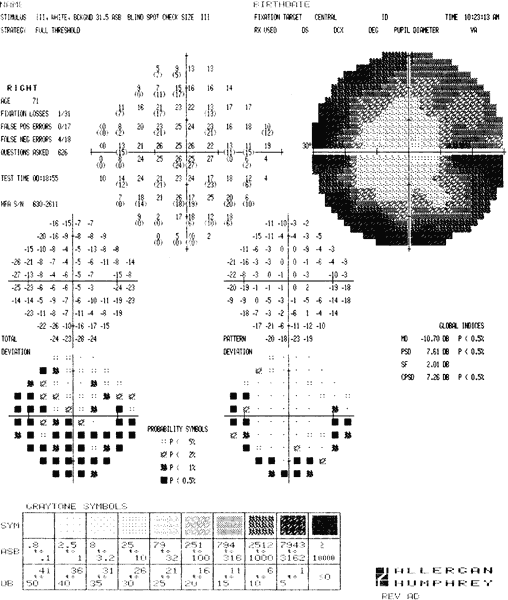
Fig. 4. Full threshold examination. Program 30-2 of the Humphrey Field Analyzer fully thresholds each of 76 points within the central 30°, spaced 6° apart. Standard data, including program used, testing parameters, patient identification, acuity, pupil diameter, age, and refraction, are given. Reliability parameters and testing time are also recorded. A display of the actual threshold sensitivity values determined for each point tested is given (lower right). Note the quadrant (Quad) totals. In addition, a display of the depth of defect is provided (lower left). In the gray-scale printout (upper), a different symbol is delegated to a series of sensitivity ranges (see key, below). A symbol is assigned to each of the points tested and a printout is generated. In the numeric printout, note the 12 loci at which a threshold sensitivity value has been determined twice. The differences between the first and second determinations are used to determine the degree of short-term fluctuation.

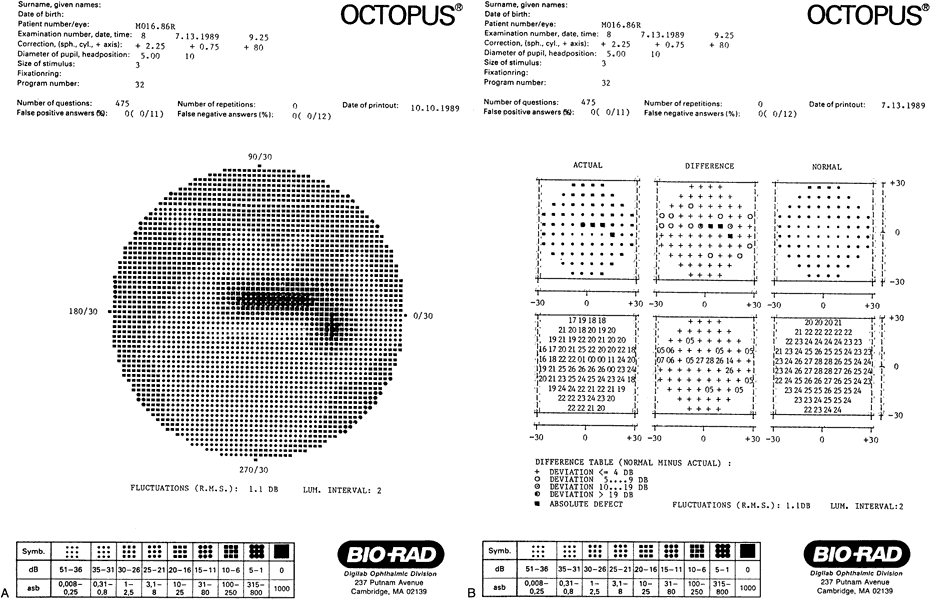
Fig. 5. A. A cursory review of the gray-scale printout of this Octopus Perimeter 30° full threshold examination of the central field demonstrates no gross abnormalities in this 34-year-old ocular hypertensive. B. Inspection of the numeric printout of the differences (center, bottom) between actually determined threshold sensitivities (left, bottom) and those expected (right, bottom) reveals several points of minimally reduced sensitivities in the inferior Bjerrum area. These findings are suggestive of the development of early visual field defects and warrant close scrutiny on future testing. Note the use of symbols in the difference display (top, center) using the difference table as a key (bottom).

Several points in the field are in the process of being thresholded at the same time. Completely thresholding only one point at a time would encourage anticipation and possible loss of fixation by the patient as well as altering local retinal adaptation. At each point examined, a value for retinal threshold sensitivity is generated. Certain instruments begin the full threshold program by determining threshold values at several primary points and then use these points to extrapolate probable threshold levels at adjacent points. These estimated threshold levels are the starting point for full thresholding. Others begin thresholding at an age-corrected expected level.

Several perimeters offer rapid thresholding strategies. One such strategy involves not fully thresholding a point if a 4-dB stimulus above expected threshold is seen. An additional testing strategy involves thresholding of each point in the field, beginning at 2 dB greater than those determined during a previous examination. Another alternative is to screen the field for areas of significantly decreased sensitivity from those established during a previous examination, and then threshold only these areas. The latter strategies save time but risk overlooking small, gradual decreases in sensitivities.

FASTPAC

Humphrey Instruments, Inc., developed a rapid thresholding strategy, FASTPAC, which uses a 3-dB step size and estimates the threshold after only one crossing, but thresholds the four primary seed points in a similar manner to standard full-threshold testing. Half of the points start at 1 dB brighter and the other half start at 2 dB dimmer than the predicted threshold values. After a single crossing, the threshold is estimated. Thresholds of locations (that differ from expected values by 4 dB or more are then re-estimated. Recent studies have indicated that FASTPAC, although considerably faster than conventional standard threshold strategies, underestimated mean deviation, pattern standard deviation, and corrected pattern standard deviation when compared with the standard algorithm.35–37

SWEDISH INTERACTIVE THRESHOLDING ALGORITHM

In an attempt to create shorter threshold tests with preserved accuracy, a family of new threshold strategies, SITA (Swedish Interactive Thresholding Algorithm), was developed. The SITA strategies use continuous estimation of threshold values and measurement errors throughout the test, using advanced visual field models and mathematical analyses performed in real time. Models are initially based on prior visual fields. Staircase procedures are used to alter stimulus intensities at predetermined test point locations, with interruption of staircases when measurement errors have been reduced to a preset level. This is the main factor involved in test time reduction. Test time is further reduced by eliminating catch trials to determine the frequencies of false-positive answers and by using a more effective timing algorithm. Several studies have demonstrated that SITA strategies may reduce automated perimetry testing time while achieving the same or better test quality than standard fullthreshold and FASTPAC strategies.38–40 The SITA Standard and SITA Fast strategies are available as software implemented on the Humphrey Field Analyzer II.

Back to Top
PRINTOUT
One difficulty in adapting to an automated perimeter is in evaluating the data presentation.41 A standard printout usually includes some or all of the following: the pattern and strategy employed, patient's name and date of birth, date of examination, pupil diameter, visual acuity, correction used, size of stimulus used, fixation target (central versus diamond pattern), testing time, fixation losses, false-positive and -negative responses, degree of response fluctuations, and central reference level (see Fig. 4).

SCREENING STRATEGIES

Screening programs display, in a framework of symbols corresponding to the pattern used, whether a stimulus was seen or not seen at each point tested (see Figs. 2 and 3). Some perimeters automatically determine whether additional points around detected abnormal points were seen. A multizone strategy delineates, usually by symbols, whether a maximally bright stimulus was seen or not seen, indicating an absolute versus relative scotoma. Actual retinal sensitivities at the abnormal points may be determined and displayed in numeric form (dB) with certain strategies. (See Testing Strategies, Screening.)

THRESHOLD STRATEGIES

Threshold strategies report actual retinal sensitivities at each point tested in numeric form (dB). As in the screening strategies, the sensitivities are displayed in a pattern corresponding to that employed in the test. Quadrant totals can also be reported, which is helpful in comparing quadrants within the same examination, those of fellow eyes, or subsequent fields of the same eye (see Fig. 4). Along with actual values, a display of differences from expected values or depth of defect may be provided. Expected threshold values may be those determined by thresholding several points and extrapolating the remainder of the tested loci or those of age-matched controls collected by the manufacturer. If the actual values are within 4 to 5 dB of expected values, they are considered within the limits of normal variability and may be recorded as “normal,” without a value for difference from expected (see Figs. 4 and 5). This type of display may be reported in numeric decibel values or in symbols, where a specific symbol corresponds to a range of reduction in decibel level. This table is valuable because it is a way to determine abnormal points rapidly. Its drawback is that localized areas that are defective with respect to a patient's actual field may not be recognized as abnormal if they are within the normal limits of the thresholds expected by the perimeter. (See Testing Strategies, Threshold Determinations.)

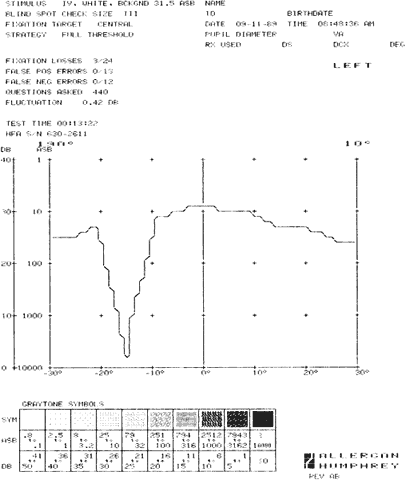
A gray-scale printout is generated by delegating different symbols to actual decibel values of threshold sensitivities, with a specific symbol representing a particular range of stimulus intensities. Symbols usually increase in density (darker) as the required threshold intensity increases. Therefore, darker areas indicate a lower differential light sensitivity and lighter areas indicate zones of higher sensitivity. The resultant printout appears to assign a retinal sensitivity to every area of the field tested, but in reality only a limited number of points were actually thresholded. To allow for continuity, values of presumed retinal sensitivity are interposed to unassessed areas of the field. Its appearance therefore resembles a picture simulating isopters. One should use this type of information display with its limitations in mind, because it gives only a gross assessment of the field. Although the clinician accustomed to manual kinetic perimetry results may find it more comfortable to rely on this type of graphic representation, important information may be missed when actual numeric values are not also considered (see Fig. 5). Static profile printouts of interposed values along specified meridians may also be derived from the data (Fig. 6).

Fig. 6. A static profile printout along the 190/10° meridian derived from data obtained from a threshold examination. Note the wide trough between 10° and 20° corresponding to the physiologic blind spot.

Back to Top
TEST SELECTION
Perimeters are used for purposes of screening for visual field defects and for their quantitation. Different objectives demand distinct testing strategies.41 In certain situations the appropriate test choice is clear, but in other cases different clinicians have different preferences. There may be several appropriate choices for any given situation. We strongly recommend investing the necessary time to become familiar with accompanying user manuals. They will prove to be extremely useful in using the perimeter effectively.

When determining which test pattern and strategy to employ in an examination, always consider the fact that data from reliable, shorter, less encompassing tests are more helpful than those from a less reliable, more extensive one. An unreliable 60° full threshold examination with numerous scotomas may be of less clinical use than a reliable 30° screening test revealing a full field.

SCREENING STRATEGIES

In general, screening strategies are most appropriate in situations in which the likelihood of finding an abnormal field is rather low. These might include baseline testing for a patient before ocular or neurosurgical operative procedures, a routine examination for occupational licensing (e.g., a pilot's license), or an ocular hypertensive at low risk for the development of glaucomatous field defects (see Fig. 2). A screening strategy might also be sufficient for a patient in whom a postchiasmal neuro-ophthalmologic lesion needs to be localized for the purpose of diagnosis. Armaly glaucoma screening patterns are well-established methods of detecting glaucomatous field defects with a high sensitivity and specificity (see Fig. 3).11,13,15,16

THRESHOLD TESTING

In contrast, threshold testing may be more appropriate for those known to have defects present in previous threshold testing and those with previous abnormal suprathreshold testing. Threshold testing is preferred over screening strategies for patients in whom a defect is likely to be present (e.g., those with optic neuritis accompanied by reduced acuity, glaucoma patients with pathologic-appearing optic discs).

RETINAL AND CHOROIDAL DISEASE

In retinal and choroidal disease, perimetry may be used for following lesions that typically produce scotomas. These usually respect neither the vertical nor horizontal meridians. Examples include retinoschisis, chorioretinal inflammations, and posterior segment tumors.42,43 Its use in macular disorders with markedly reduced acuity is limited. Branch vascular occlusions often present as arcuate or wedge-shaped lesions, whereas hemiretinal occlusions appear as altitudinal defects. Scotomas resulting from retinal detachments are usually ill defined and relative; those secondary to retinoschisis are dense and well defined.

NEURO-OPHTHALMOLOGIC DISEASES

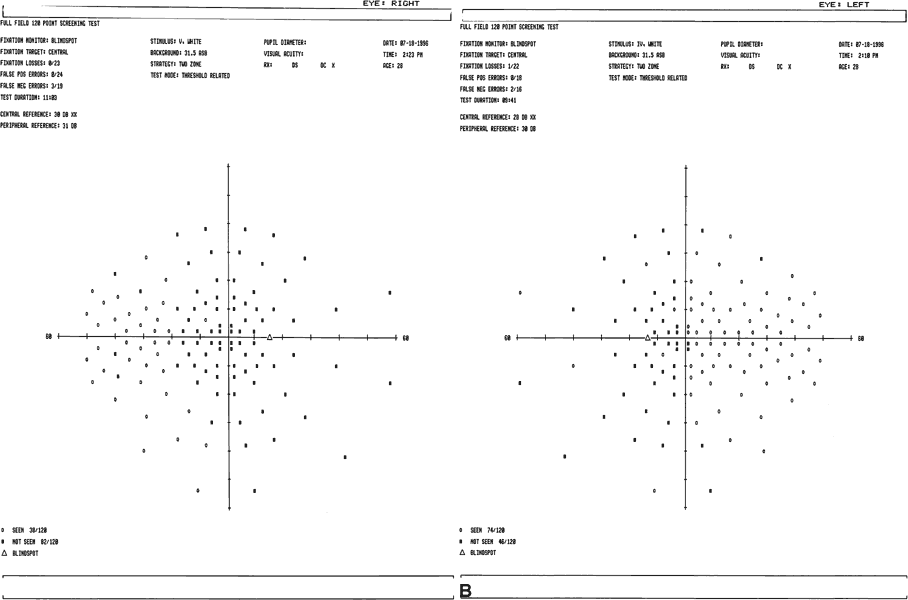
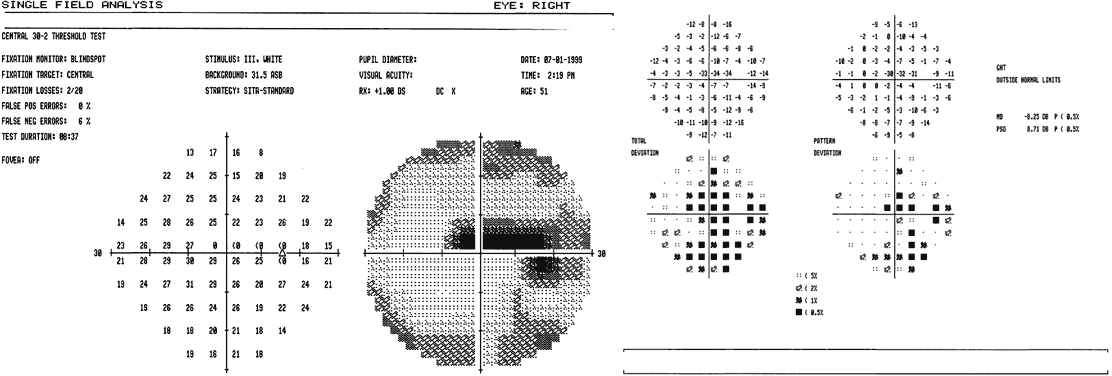
Automated perimeters have been demonstrated to be excellent tools in evaluating neuro-ophthalmologic disorders.25,44–46 For this purpose, testing of the central 30° has been recommended by most.47,48 To determine whether a defect is present, a full-field test pattern to assess the size, shape, and degree of congruity of homonymous defects may be adequate (Fig. 7). Central threshold testing is preferred for detecting and following optic neuropathies (e.g., optic neuritis, pseudotumor cerebri) (Fig. 8).49,50 If factors limiting testing time are present, testing only the vertical meridian may be sufficient if a postchiasmal lesion is clinically suspected.

Fig. 7. This full-field 120-point screening examination of both eyes demonstrates a bilateral bitemporal hemianopia and right central scotoma. A pituitary gland tumor produced these findings. A. Right eye. B. Left eye.

Fig. 8. This 30° threshold examination of a 51-year-old patient with the diagnosis of optic neuritis reveals a dense central scotoma, typical of the disease.

GLAUCOMA

Typical glaucomatous defects include generalized or diffuse reductions of threshold sensitivities and localized defects including arcuate and paracentral scotomas (Figs. 9 and 10), nasal steps (Fig. 11), and temporal wedge defects. However, in testing a glaucoma field for scotomatous defects, the earliest defects may appear as areas of diminished sensitivities in the paracentral area.12,13,51,52 Even before the detection of frank scotomas, increased scatter in manual perimetry53,54 and increased short- and long-term fluctuations in automated perimetry may appear in these same areas.55–57 Because progression of glaucomatous field defects more commonly manifests itself as increased density rather than as increasing extent or development of new scotomas, full threshold testing is required for appropriate glaucoma follow-up.58

Fig. 9. A. This threshold examination of the central 30° of a patient with glaucoma demonstrates a dense paracentral scotoma, close to fixation, and adjacent to the blind spot. B. The numeric printout confirms the presence of these loci with reduced sensitivities.

Fig. 10. This 30° threshold visual field examination of an eye with moderate glaucomatous optic nerve damage exhibits a dense superior arcuate scotoma extending to the extreme nasal periphery and close to splitting fixation. A wide inferotemporal notch was noted on examination of the optic nerve head.

Fig. 11. Note the superior nasal step in this patient with glaucoma. This examination is of excellent reliability with no fixation losses or false responses. The low short-term fluctuation value is also consistent with good reliability.

Although most glaucomatous visual field defects occur within the central 30°,59 isolated defects may occur in the peripheral field with significant frequency.54,59,60 Seamone and colleagues demonstrated an increased sensitivity to detecting glaucomatous defects in ocular hypertensives when threshold testing of the nasal periphery was added to central field testing.61 However, Schulzer and associates determined that an examination of peripheral isopters added little to their assessment of a visual field for progression when information regarding central isopters and scotomas was available.62 Although it appears that threshold testing of the central 30° is usually adequate, testing of the peripheral nasal step area can be added to the examination if a high index of suspicion exists. Some instruments provide specific patterns for glaucoma testing.63 Custom patterns for following small, localized defects or central 10° patterns for assessing small remaining central islands may be applied in appropriate cases (Fig. 12).

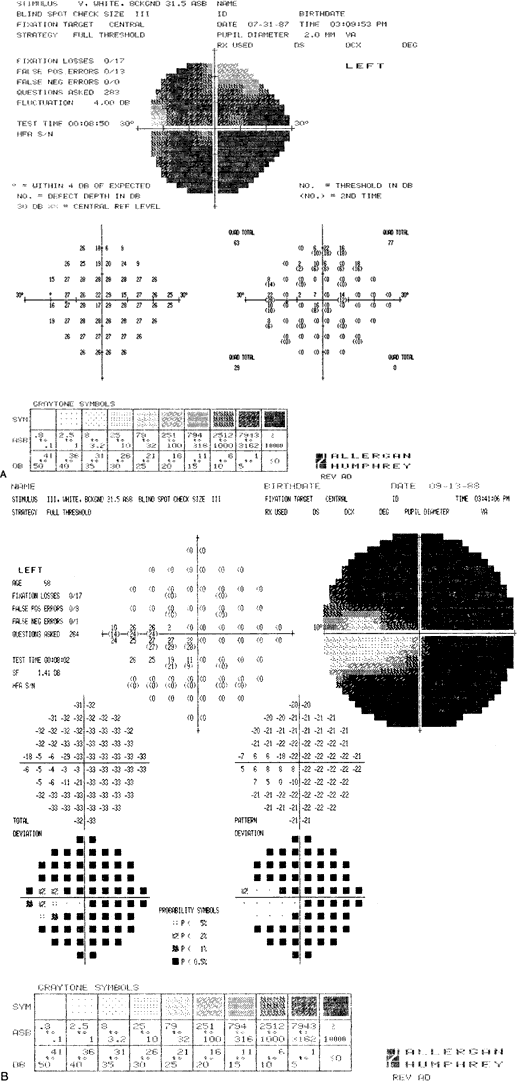
Fig. 12. A. This threshold examination in a patient with extensive glaucomatous optic nerve damage using program 24-4 and a size V target produced no valuable data with which to follow this patient for disease progression. B. When the examination was later repeated with program 10-2, a threshold examination of the central 10°, a small remaining central island is evident. This data will better allow assessment of potential disease progression.

The generalized sensitivity reductions that occur in glaucoma also result from media opacities, pupillary miosis, uncorrected refractive errors, aging, and poor patient performance. Diffuse depression may be of significance when comparisons with a previous baseline examination suggest that progression has occurred without another identifiable cause. These findings may also be of significance when they occur asymmetrically, are marked in degree, or correlate with clinical findings.

Localized glaucomatous-appearing defects may have other causes. These include branch retinal vascular occlusions, myopia, retinal detachment, retinoschisis, retinitis pigmentosa, aging macular degeneration, preretinal macular gliosis, optic pit, optic disc drusen, papilledema, ischemic optic neuropathy, disc coloboma, papillitis, and others. Again, correlating clinical findings with visual field results is most important.

Back to Top
NEW TESTING STRATEGIES

SHORT-WAVELENGTH AUTOMATED PERIMETRY

Several new testing strategies have been developed to detect early visual field defects in patients with ocular hypertension or otherwise suspected glaucoma. Short-wavelength automated perimetry (SWAP), also known as blue-on-yellow perimetry, color visual fields, and blue cone perimetry, is based on the finding that losses of short-wavelength sensitivity are predictive of subsequent visual field loss observable by standard automated perimetry.64 SWAP strategies require only minor modifications of the Humphrey Field Analyzer. The standard 31.5-apostilb (10 candela/m2) white background is replaced with a yellow background of 100 to 200 candela/m2, and a blue filter (440 to 500 nm) is placed in the stimulus projection pathway. A size V target is used to increase the dynamic range of the test, with a stimulus duration of 200 ms. With these modifications in place, all of the testing strategies, target presentation patterns, reliability checks, and other features of the Humphrey Field Analyzer may be used in SWAP. Recent studies have suggested that although SWAP may be able to detect glaucomatous visual field loss before standard perimetry, the increased interindividual normal variability of SWAP and its lack of correction for ocular media absorption limits its utility in that the reduction in sensitivity required to indicate an abnormality with SWAP is greater than that for standard white-on-white perimetry.65

MOTION PERIMETRY

Whereas SWAP tests the parvocellular visual pathways, another new testing modality, motion perimetry, detects deficits in the magnocellular pathways. It is theorized that early glaucomatous damage may cause defects in one or both pathways that may be detected earlier with these specific testing strategies than with standard automated perimetry.66 Motion perimetry uses a sparse random distribution of single white pixels displayed on a gray background of 31.5 apostilbs using a video display monitor, which is driven by a computer using a video card. The motion targets are kinematograms within which anywhere from 0% to 100% of the pixels move in one of four directions relative to fixation (up, down, left, or right) to create the coherent motion signal that the patient is to detect. Coherence detection threshold can then be determined by determining the lowest coherence percentage detectable by the patient. Conversely, stimulus size may be varied, and threshold of the smallest stimulus detected can be determined.67

FREQUENCY-DOUBLING PERIMETRY

Another new modality that detects abnormalities in the magnocellular visual pathway is frequency-doubling perimetry (FDP), which produces an illusion in which additional ghost lines are perceived between actual presented sine wave patterns of varying spatial frequency, contrast, and temporal modulation. This phenomenon occurs in part because of the difference in character and conduction time along the magnocellular and parvocellular pathways. FDP is a rapid, portable, and relatively inexpensive test that shows promise in screening for early glaucomatous visual field loss.68,69

Back to Top
FACTORS INFLUENCING PERIMETRY
Before discussing visual field interpretation, a mention of the factors affecting testing may be helpful. (These factors include patient, ocular, and testing variables.

PATIENT VARIABLES

With respect to the effects of age on differential light threshold, it has been demonstrated by several investigators that mean threshold sensitivities decrease with advancing age.52,70–73 Hass and colleagues estimated this effect to be 0.58 dB per decade.70 This effect was found to be eccentrically dependent, with the most prominent decreases in sensitivity in the periphery of 30° field examinations.71–73 It has also been established that advancing age is associated with an increase in the variability of responses on threshold testing.72,74

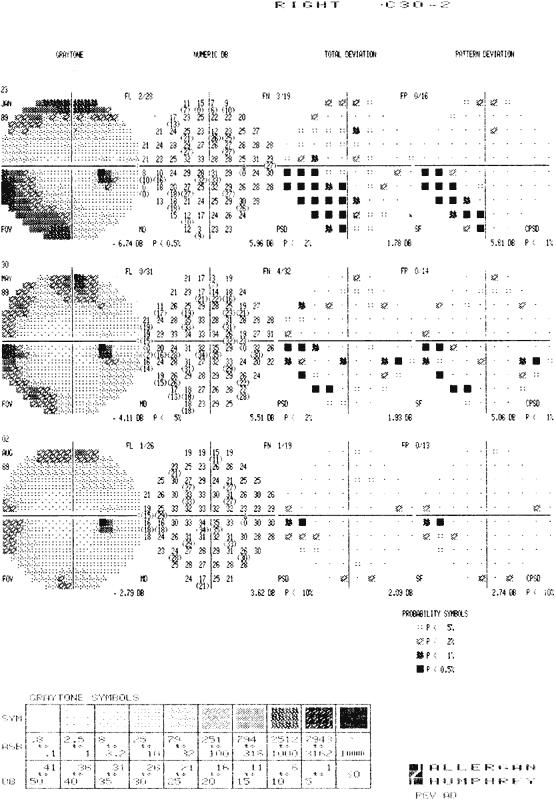
Heijl and associates demonstrated that in certain patients, the degree of experience with automated visual field testing may affect test results. These effects may be manifested by reductions in peripheral sensitivities, producing constricted fields, and a high degree of variability (short-term fluctuations) (Fig. 13).75 This learning effect on variability has been confirmed by Werner and associates.76 Other patient variables that may have an effect on testing include intelligence, degree of cooperation, fatigue, and physical and emotional disabilities.

Fig. 13. This is an overview printout of three sequential fields during a 7-month period in a patient with glaucoma. All fields are of good reliability with few fixation losses (FL) or false-negative (FN) and false-positive responses (FP). When we compare the most recent field (bottom) with the initial examination (top), we see an overall increase in threshold sensitivities, particularly in the periphery, with patient experience.

OCULAR VARIABLES

Ocular variables may have an effect on perimetric results. Significant effects of uncorrected refractive disorders (blur) on visual field testing have been reported. Blur has been shown to have the effect of reducing differential light threshold sensitivities.77,78 Mean sensitivities in the central 30° may be decreased with induced ametropia, without changes in global indices (see Global Indices below).78 These effects are particularly important in patients with large refractive errors (aphakia and high myopia). An appropriate add for near vision is crucially important for most patients. Posterior staphylomas may behave as local areas of uncorrected “refractive error,” resulting in what appear to be focal defects in the visual field. The induced myopia of topical parasympathomimetics should not be overlooked.

The pupil diameter may also have a significant effect on field testing.79,80 The degree of retinal illumination falls as pupil diameter decreases; this could cause a shift in retinal adaptation and therefore retinal sensitivity.80 Although lens aberrations and depth of field improve as the diameter of the pupil decreases, as it decreases beyond 2.5 mm, diffraction occurring at the pupil edge results in compromise in image resolution and therefore true retinal sensitivity.27 Patients should therefore be dilated to a minimum of 2.5 mm before testing. If possible, pupil diameter should remain consistent with subsequent testing. Pupillary dilation with a sympathomimetic agent should be employed when needed; using a cycloplegic agent may affect accommodation and possibly refractive error.

Media opacities (cataract, vitreal and corneal opacities) may affect the visual field by defocusing the test spot image, decreasing the actual intensity of light presented to the retina, and therefore reducing the apparent retinal sensitivity. In general, media opacities cause a generalized depression in the visual field. When assessing the effect of a cataract formation on the visual field, one should consider its effect on visual acuity and refraction and its density. Cataracts have been shown to cause an overall decrease in sensitivities, with the greatest effect in the central field.81 Media opacities in general alter retinal sensitivity more significantly when pupil diameter decreases.

Prominent brow, drooping lid, large nose, and small palpebral fissure result in frequent superior, inferior, and nasal peripheral defects. An additional cause for artifact is that resulting from obstruction of the periphery of the field by the corrective lens rim. This has been shown to occur most prominently in the temporal periphery of a 30° field, and occurs with higher frequency in older patients and high hyperopes (Fig. 14).82

Fig. 14. This 30° threshold examination is an example of reduced peripheral threshold sensitivities resulting from corrective lens rim obstruction of the field of vision.

TESTING VARIABLES

Testing variables might also have a significant effect on test results. Proper standardization and calibration of the perimeter are of obvious importance in performing standardized testing and should be evaluated on a regular basis. In determining patient reliability, adequate fixation monitoring must be maintained. As mentioned previously, stimulus size increases threshold sensitivity and should remain unchanged in subsequent testing. The duration of stimulus may be changed on some machines, but temporal summation has no influence on visual field testing when the duration of stimuli is 0.5 seconds. Some patients perform better when response time is increased; this may be modified on some machines. The importance of proper correction—that is, near add for central 30° and distance correction for more peripheral areas—has already been mentioned.

Back to Top
VARIABILITY
The variability of measured threshold sensitivities, or fluctuation, has two components: intratest and (intertest variability, or short-term and long-term fluctuations, respectively. An appreciation for the normal degree of variability is essential in assessing a visual field examination. Variability can be misinterpreted for or mask true progression. In addition, it may reflect an early sign of disease progression.

FACTORS AFFECTING VARIABILITY

Several factors have been shown to affect variability. Multiple studies have demonstrated increased variability with increasing eccentricity of the area tested.72–74,83–85 The effect of the increasing severity of visual field damage on the greater degree of variability is well established.53,55–57,83,86 Test variability increases with age.72,74 Variability also increases in patients who do not understand the test or who are inattentive, including those with a high degree of false responses.

When visual field results appear to be inconsistent with clinical findings, repeat testing is indicated before clinical decisions are made. More than one examination may be required to establish reliable baseline values.41,75,76,87

SHORT-TERM FLUCTUATION

Short-term fluctuation is a measure of the variability of threshold sensitivity at a given tested point during the same examination, or the level of precision obtained within a visual field examination. Repeat thresholding is routinely performed at a series of test points within a given examination (see Fig. 4). The variability between the two sensitivities calculated for the points may also be expressed as a root mean square. Short-term fluctuation usually ranges from 1 to 2 dB in normals57,73,88 but is increased in patients with localized glaucomatous visual field defects, glaucoma suspects,55–57,86 and patients with generalized reductions in sensitivities. In addition, unreliable fields tend to have associated high short-term fluctuations. When reliability is judged to be acceptable with respect to fixation losses and false responses, an abnormally high short-term fluctuation may reflect actual pathology in the visual system.57

LONG-TERM FLUCTUATION

Long-term fluctuation is a measure of the variability of threshold sensitivity at a given point tested at different times, not attributed to disease progression. It has been found to be higher in glaucoma patients and glaucoma suspects than in normals.56 The normal limits of long-term fluctuation become important in visual field interpretation because it is a significant factor in distinguishing normal variability from true field progression.89

Back to Top
EVALUATION OF TEST RESULTS
Evaluating the visual field involves determining whether the field is normal or if any progression or improvement has occurred between two or more fields. Assessing test results begins with determining the reliability of the test.

RELIABILITY

Patient reliability may be appraised by several parameters. These include the examiner's subjective evaluation of fixation, calculated fixation losses, false-positive and -negative responses, and degree of response variability. The presence of a technician throughout the examination is a necessity.90 During the examination, rest periods as well as additional instructions may be needed to ensure optimal reliability. In addition, if machine-determined parameters of reliability suggest that the patient performed poorly but fixation was observed to be of good quality, the field may be of more value than would have otherwise been determined.

FIXATION LOSSES

Fixation losses may be recorded as a fraction, with the number of losses of fixation in the numerator and the number of blind-spot presentations in the denominator, in the case of the blind-spot monitoring technique. If eye movement sensors are used, an absolute number of fixation losses is recorded (see Fixation Monitoring). Test results are considered unreliable by most manufacturers' standards if fixation losses exceed 20%. It has been suggested that this arbitrary cutoff point be increased to 33%, which would decrease the number of fields deemed unreliable without significantly affecting the sensitivity or specificity of the test.91

FALSE-POSITIVE AND NEGATIVE RESPONSES

A false-positive response is recorded when a patient signals that a stimulus has been seen when one has not been presented, usually in response to an audible rather than a visual stimulus. A false-negative response is registered when a patient fails to respond to the presentation of a stimulus at a given location that is significantly brighter than the previously determined threshold at that point (suprathreshold). Examinations in which false responses of greater than 33% are registered have been considered unreliable. A higher rate of false-negative responses has been shown to occur in patients with glaucomatous field loss compared with normals (see Fig. 9; Fig. 15).87

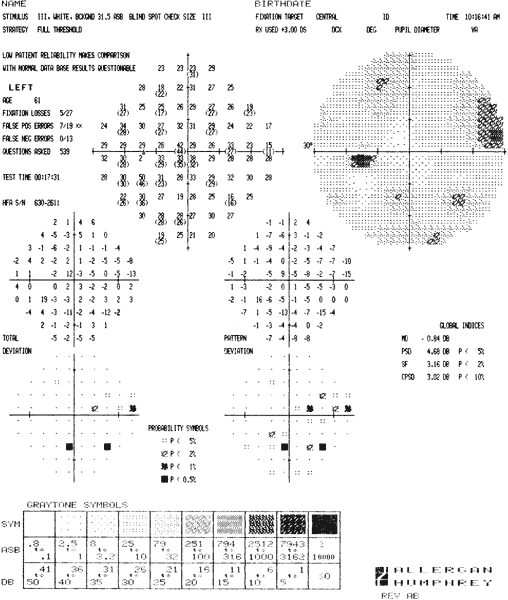
Fig. 15. This is an example of an unreliable 30° threshold field, with 7/19 (37%) false-positive responses. Note the scattered areas of abnormally high threshold sensitivities and increased short-term fluctuations.

Back to Top
INTERPRETATION

GLOBAL INDICES

Perimeters provide numeric calculations for overall assessment of the visual field called global indices (Fig. 16). These include mean deviation or defect, loss variance or pattern standard deviation, corrected pattern standard deviation or loss variance, and short-term fluctuation (see Variability).88,92 These allow for an analysis of the overall quality of the field for the presence of abnormalities or change from previous testing. A probability value may be assigned to these indices indicating whether the abnormal index is by chance or of true significance.

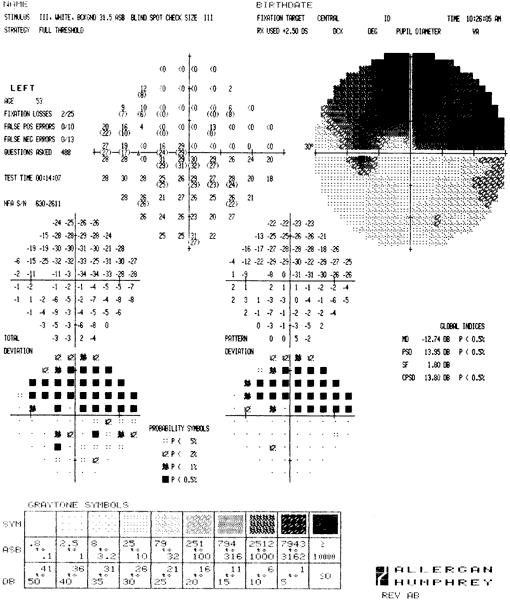
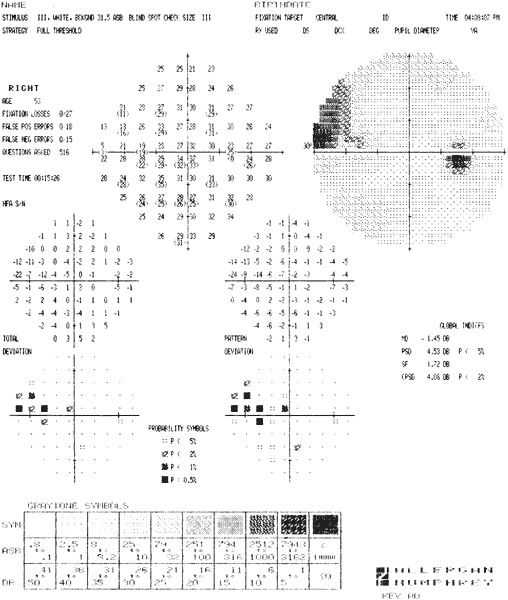
Fig. 16. This examination of a glaucomatous eye with a cataract, employing program 30-2 of the Humphrey Field Analyzer, demonstrates the uses of global indices. The mean deviation (MD) of 16.79 dB represents the significant degree of generalized reduction in threshold sensitivities secondary to the media opacity. The corrected pattern standard deviation (CPSD) of 8.39 reflects the additional localized reduction in sensitivities resulting from the dense superior nasal step, well demonstrated in the pattern deviation display. The pattern deviation display also discloses the abnormal loci in the Bjerrum area in the superotemporal and inferonasal quadrants.

The mean sensitivity is an average value of threshold sensitivity for all points tested. The mean defect (deviation), the difference between mean sensitivity obtained and that expected, may also be determined and compared with other fields of the same individual for evidence of progression. Mean deviation may be determined for the entire field or for individual zones or quadrants and should be in the range of zero in normals. It is more affected by generalized decreases in sensitivities rather than by small, localized defects but is increased in the presence of any defect (see Fig. 16).88 Mean sensitivity may also be decreased by media opacities, significant pupil constriction, blur, and unreliability.

Loss variance or pattern standard deviation reflects the regional nonuniformity of a visual field, or frequency of deviation of sensitivity values after adjusting for the mean defect of the entire field—in other words, a measurement of the extent to which the shape of the patient's field deviates from the expected age-adjusted normal. A high value indicates an irregularity to the expected normal hill of vision, suggesting localized defects. Therefore, a normal value is in the range of zero. A low value is also found in a field with a diffuse but regular decrease in threshold sensitivities. Corrected loss variance or corrected pattern standard deviation takes into account the effect of short-term fluctuation or root mean square on loss variance or pattern standard deviation. This is more sensitive to the presence of localized defects, correcting for coexisting diffuse fluctuations (see Fig. 16). It should be in the range of zero in normal fields as well as those with even depression throughout the field.88 Pattern standard deviation and loss variance have been shown to be useful in determining the presence of glaucomatous field defects.93,94

OTHER METHODS OF FIELD ASSESSMENT

Besides global indices, other methods of assessment may be used for determining whether a visual field is abnormal or whether changes from previous fields have occurred. Real progressive changes in visual fields are typically gradual and may be camouflaged by significant fluctuations between fields (long-term fluctuations).89 Therefore, “deterioration” between two subsequent fields may represent fluctuation or true disease progression. Hence, documentation of true progression may require determining trends among several subsequent fields. Hoskins and colleagues have demonstrated that depending on the location and size of the area investigated, a decrease in mean threshold sensitivities of 4 to 7 dB must occur between two subsequent fields to achieve confidence that true progression rather than long-term fluctuation is occurring.95 Werner and colleagues have shown that there is significant variability among clinician assessments as well as statistical techniques for determining the stability of a patient's visual field over time.96 Most agree that an effort must always be made to correlate visual field findings with the remainder of the clinical examination, and that repeat testing is often indicated for establishing true progression.

Comparing a visual field with that of the fellow eye for significant asymmetry may be helpful.97,98 This method makes several assumptions. The first is that the fields of a patient's eyes are normally symmetric. The second assumption is that the fellow eye has a normal field. It has been determined that asymmetry of overall mean sensitivities of more than 1.4 dB should occur in less than 1% of the normal population, and that an asymmetry in excess of 6 dB should be found in less than 1% of locations.97 Feuer and Anderson suggested that even a 2-dB difference in mean sensitivity may be significant on a single examination.98 The advantages of this type of comparison are that it is easier to predict “normal” and can be used when previous fields are not available. In addition to comparing fields with those of the fellow eye, the examiner may compare them with previous fields of the same eye or with a presumably normal portion of the field of the same eye.

Sommer and associates,93 in studying the automated visual fields of groups of normal and glaucomatous eyes, demonstrated that useful information can be obtained by comparing corresponding areas of the visual field across the horizontal meridian. This technique revealed both a sensitivity and specificity of 93% for detecting glaucomatous visual field defects. With early glaucomatous visual field loss having been shown to present often in either the superior or inferior hemifield,54,58 this technique of field assessment may prove to be useful.

In assessing a visual field, particularly that of a glaucoma patient, a systematic approach is recommended.41 A field should first be evaluated for diffuse or generalized changes when compared to normals or previous fields. Specifically, the level of overall sensitivities should be determined using mean sensitivity or deviation values. If a reduction is appreciated, confounding factors such as media opacities, pupil diameter, or blur should be sought.

At this point, the field should be assessed for localized defects. In manual perimetry, a scotoma may be defined as an area in the field at which retinal sensitivity is less than that of the surrounding area. When we refer to scotomas in automated perimetry, we are concerned with one or several contiguous loci at which threshold sensitivity is less than that at surrounding loci. There are no absolute definitions in terms of the degree of sensitivity reduction or the number of adjacent points of reduced sensitivity as to what constitutes a significant scotoma. In general, local areas of minimally decreased sensitivity may be within normal limits (one point reduced by 5 dB). The more severely the sensitivity is reduced, the more likely the area in question is pathologic. Several adjacent points of reduction may represent a true defect and deserve careful follow-up or additional testing. There are certain areas of the field in which glaucomatous defects are more likely to occur. These include such areas as the Bjerrum (10° to 20°), paracentral area (within 10°), and nasal step regions. When loci of reduced sensitivity are detected in these areas, they should arouse more suspicion than abnormal points in, for example, the extreme superior periphery. One should also investigate the numeric printout for areas of increased short-term fluctuations because these may represent areas that will progress to scotomas.41

STATISTICAL ANALYSIS

Statistical analysis programs, which assist with field evaluation, may be offered by some perimeters.92 A printout of total deviations or the difference in (decibel values between the actual results and age-corrected reference values may be provided. Pattern deviation graphic plots are generated by adjusting total deviation values for any generalized overall decrease or increase in sensitivities. This allows the detection of localized scotomas within a diffusely depressed field (media opacity) (see Fig. 16). Other programs provide a probability value that the detected deviation at each point is of statistical significance.

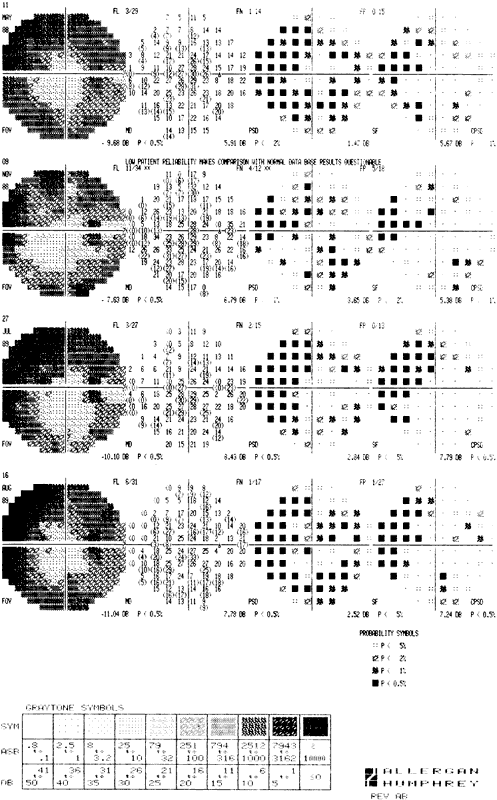
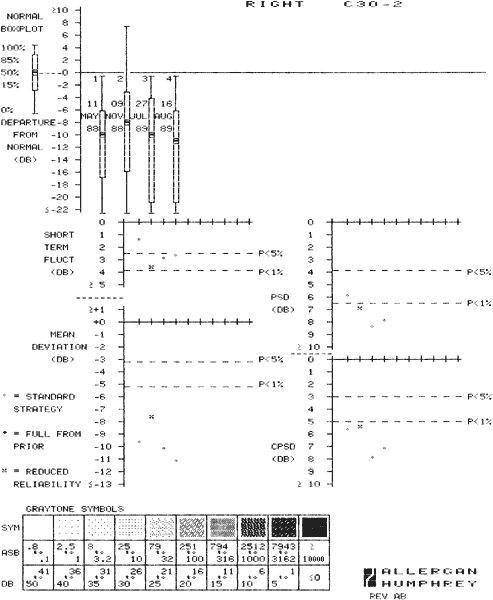
Overview and change analysis printouts furnish an analytic summary of changes in serial fields over time and graphically analyze global indices, determining the statistical significance of any trend in mean deviation (Figs. 17 and 18). Certain statistical packages allow comparisons of specific quadrants among subsequent tests. The Delta program of the Octopus perimeter performs a t test for each point tested, determining statistical significance.

Fig. 17. This overview printout of the Humphrey Field Analyzer presents data of these four sequential fields in several formats, including gray scale, numeric printout, total deviation probability plot, and pattern deviation probability plot. For each field, false-negative and -positive responses, fixation losses, and global indices are provided.

Fig. 18. This change analysis printout provides an analytic summary of changes in the visual field over time. Deviations of threshold (mean and range) are presented in the form of a box plot analysis (top). This box plot is a modified histogram that gives the 100th, 85th, 15th, and zero percentile as well as median differences of threshold sensitivities at all points tested. A normal box plot is provided for comparison. Each of the four global indices for each of the four fields being analyzed is plotted over time (lower four graphs) using symbols that identify the strategy employed in testing and whether the reliability of the test was adequate. To aid in interpretation, P < 5% and P < 1% limits are offered.

Back to Top
CONCLUSION
Automated perimetry has enhanced ophthalmologists' ability to collect valuable clinical data for better patient management, most notably in the care of the glaucoma patient. Quantitative perimetry is now available to all practitioners in an office setting. Continued advances in determining mechanisms of disease progression, visual physiology, and computer hardware and software will evidently lead to more refined techniques in assessing the field of vision.
Back to Top
REFERENCES

1. Young T: The Bakerian lecture on the mechanism of the eye. Philos Trans R Soc Lond (Biol) 91:23, 1801

2. Graefe A von: Uber die Untersuchung des gesichtsfeldes bei amblyopischen Affectionen. Graefes Arch Klin Exp Ophthalmol 2:258, 1856

3. Förster R: Vorzeigung des Perimeter. Klin Monatsbl Augenheilk 7:411, 1869

4. Bjerrum JP: Omen tilfojelse til saedvanlige synsfeltundersogelse saint om synfeltet ved glaukom. Nord Ophth Tidsskr Kjobenh 2:144, 1889

5. Sloan LL: Instruments and techniques for the clinical testing of light sense—an apparatus for studying regional differences in light sense. Arch Ophthalmol 22:233, 1939

6. Goldmann H: Grundlagen exakter Perimetrie. Ophthalmologica 109:57, 1945

7. Harms H, Aulhorn E: Vergleichende Untersuchungen über den Wert der Quantitativen Perimetrie, Skiaskotometrie und Verschmelzungsfrequenz fur die Erkennung beginnender Gesichtsfeldstorungen beim Glaukom. Doc Ophthalmol 13:303, 1959

8. Dubois-Poulsen A, Magis C: Premieres applications a l'ophthalmologie des techniques modernes d'automation et d'analyse de l'information. Bull Mere Soc Fr Ophthalmol 79: 576, 1966

9. Lynn JR, Tate GW: Computer-controlled apparatus for automatic visual field examination. US patent 3,883,234, issued May 1975

10. Traquair HM: Perimetry in the study of glaucoma. Trans Ophthalmol Soc UK 51:585, 1931

11. Armaly, MF: Ocular pressure and visual fields: A ten-year follow-up study. Arch Ophthalmol 81:25, 1969

12. Drance SM: The early field defects in glaucoma. Invest Ophthalmol Vis Sci 8:84, 1969

13. Armaly MF: Selective perimetry for glaucomatous defects in ocular hypertension. Arch Ophthalmol 87:518, 1972

14. Drance SM, Brais P, Fairclough M, Bryett J: A screening method for temporal visual defects in chronic simple glaucoma. Can J Ophthalmol 7:428, 1972

15. Rock WJ, Drance SM, Morgan RW: A modification of the Armaly visual field screening technique for glaucoma. Can J Ophthalmol 6:283, 1971

16. Rock WJ, Drance SM, Morgan RW: Visual field screening in glaucoma: An evaluation of the Armaly technique for screening glaucomatous visual field defects. Arch Ophthalmol 89:287, 1973

17. Harms H: Entwicklungsmoglichkeiten der Perimetrie. Graefes Arch Ophthalmol 150:28, 1950

18. Le Blanc RP: The Octopus system. In Drance SM, Anderson DA (eds): Automatic Perimetry in Glaucoma. A Practical Guide, pp 69–87. Orlando, FL, Grune & Stratton, 1985

19. Heijl A: Humphrey field analyzer. In Drance SM, Anderson DA (eds): Automatic Perimetry in Glaucoma. A Practical Guide, pp 129–140. Orlando, FL, Grune & Stratton, 1985

20. Heijl A: Automatic perimetry in glaucoma visual field screening: A clinical study. Graefes Arch Clin Exp Ophthalmol 200:21, 1976

21. Li SG, Spaeth GL, Scimeca HA et al: Clinical experience with the uses of an automated perimeter (Octopus) in the diagnosis and management of patients with glaucoma and neurologic diseases. Ophthalmology 86:1302, 1979

22. Johnson CA, Keltner JL, Balestrery FG: Suprathreshold static perimetry in glaucoma and other optic nerve disease. Ophthalmology 86:1278, 1979

23. Johnson CA, Keltner JA: Automated suprathreshold static perimetry. Am J Ophthalmol 89:731, 1980

24. Heijl A, Drance SM: A clinical comparison of three computerized automatic perimeters in the detection of glaucoma defects. Arch Ophthalmol 99:832, 1981

25. Beck RW, Bergstrom TJ, Lichter PR: A clinical comparison of visual field testing with a new automated perimeter, the Humphrey field analyzer, and the Goldmann perimeter. Ophthalmology 92:77, 1985

26. Trope GE, Britton R: A comparison of Goldmann and Humphrey automated perimetry in patients with glaucoma. Br J Ophthalmol 71:489, 1987

27. Tate GW Jr: The physiological basis for perimetry. In Drance SM, Anderson DA (eds): Automatic Perimetry in Glaucoma: A Practical Guide, pp 1–28. Orlando, FL, Grune & Stratton, 1985

28. Anderson DR: Perimetry, With and Without Automation, 2d ed, p 228. St. Louis, CV Mosby, 1987

29. Klewin K, Radius R: Background illumination and automated perimetry. Arch Ophthalmol 104:395, 1986

30. Britt JM, Mills RP: The black hole effect in perimetry. Invest Ophthalmol Vis Sci 29:795, 1988

31. Dejardins D, Anderson DR: Threshold variability with an automated LED perimeter. Invest Ophthalmol Vis Sci 29:915, 1988

32. Wilensky JT, Mermelstein JR, Siegel HG: The use of different-sized stimuli in automated perimetry. Am J Ophthalmol 101:710, 1986

33. Heijl A, Krakau CET: An automatic perimeter for glaucoma visual field screening and control: Construction and clinical cases. Graefes Arch Klin Exp Ophthalmol 197:13, 1975

34. Anderson DR: Principles of static perimetry. In Drance SM, Anderson DA (eds): Automatic Perimetry in Glaucoma. A Practical Guide, pp 69–87. Orlando, FL, Grune & Stratton, 1985

35. O'Brien C, Poinoosawmy D, Wu J, Hitchings R: Evaluation of the Humphrey FASTPAC threshold program in glaucoma. Br J Ophthalmol 78:516, 1994

36. Flanagan JG, Wild JW, Trope GE: Evaluation of FASTPAC, a new strategy for threshold estimation with the Humphrey Field Analyzer, in a glaucomatous population. Ophthalmology 100:949, 1993

37. Schaumberger M, Schafer B, Lachenmayr BJ: Glaucomatous visual fields: FASTPAC versus full threshold strategy of the Humphrey Field Analyzer. Invest Ophthalmol Vis Sci 36:1390, 1995

38. Bengtsson B, Heijl A, Olsson J: Evaluation of a new threshold visual field strategy, SITA, in normal subjects. Acta Ophthalmol Scand 76:165, 1998

39. Bengtsson B, Heijl A: Evaluation of a new perimetric threshold strategy, SITA, in patients with manifest and suspect glaucoma. Acta Ophthalmol Scand 76:268, 1998

40. Bengtsson B, Heijl A: SITA Fast, a new rapid perimetric threshold test. Description of methods and evaluation in patients with manifest and suspect glaucoma. Acta Ophthalmol Scand 76:431, 1998

41. Liebermann MF, Drake MV: A Simplified Guide to Automated Perimetry, pp. 34–42, 103–128. Thorofare, NJ, Slack, 1987

42. Abramson DH: Computerized visual field of choroidal melanoma. Glaucoma 10:39, 1988

43. Palazzi M, Abramson DH, Myers C et al: Computerized visual fields in uveal melanomas after treatment. Glaucoma 11:114, 1989

44. McCrary JA, Feigon J: Computerized perimetry in neuro-ophthalmology. Ophthalmology 86:1287, 1979

45. Keltner JL, Johnson CA: Automated and manual perimetry: A six-year overview: Special emphasis on neuro-ophthalmic problems. Ophthalmology 91:68, 1983

46. Younge BR, Trautmann JC: Computer-assisted perimetry in neuro-ophthalmic disease. Mayo Clin Proc 55:207, 1980

47. Hard-Boberg A, Wirtschafter JD: Evaluating the usefulness in neuro-ophthalmology of visual field examination peripheral to 30 degrees. Doc Ophthal Proc Series 42:197, 1985

48. Mills RP: Usefulness of peripheral testing in automated screening perimetry. Doc Ophthal Proc Series 42:207, 1985

49. Beck RW: Optic Neuritis Treatment Trial. Operations Manual. 1988

50. Smith TJ, Baker RS: Visual field findings in pseudotumor cerebri. Ophthalmology 92 (suppl 2):69, 1985

51. Aulhorn E, Harms H: Early visual field defects in glaucoma. In Leydhecker W (ed): Glaucoma: Tutzing Symposium, 1966, pp 151–186. Basel, Karger, 1967

52. Drance SM, Berry V, Hughes A: Studies on the effects of age on the central and peripheral isopters of the visual fields in normal subjects. Am J Ophthalmol 63:1667, 1967

53. Werner EB, Drance SM, Schulzer M: Early visual field disturbances in glaucoma. Arch Ophthalmol 95:1173, 1977

54. Hart WM Jr, Becker B: The onset and evolution of glaucomatous visual field defects. Ophthalmology 89:268, 1982

55. Werner EB, Saheb N, Thomas D: Variability of static visual field threshold responses in patients with elevated IOPs. Arch Ophthalmol 100:1627, 1982

56. Flammer J, Drance SM, Zulauf M: Differential light threshold: Short- and long-term fluctuation in patients with glaucoma, normal controls and patients with suspected glaucoma. Arch Ophthalmol 102:704, 1984

57. Flammer J, Drance SM, Fankhauser F, Augustiny L: Differential light threshold in automated static perimetry: Factors influencing short-term fluctuation. Arch Ophthalmol 102:876, 1984

58. Mikelberg FS, Drance SM: The mode of progression of visual field defects in glaucoma. Am J Ophthalmol 98:443, 1984

59. Werner EB, Beraskow J: Peripheral nasal field defects in glaucoma. Ophthalmology 86:1875, 1979

60. LeBlanc RP, Becker B: Peripheral nasal field defects. Am J Ophthalmol 72:415, 1971

61. Seamone C, LeBlanc R, Rubillowicz M et al: The value of indices in the central and peripheral visual fields for the detection of glaucoma. Am J Ophthalmol 106:180, 1988

62. Schulzer M, Mikelberg FS, Drance SM: A study of the value of the central and peripheral isopters in assessing visual field progression in the presence of paracentral scotoma measurements. Br J Ophthalmol 71:422, 1987

63. Flammer J, Jenni F, Bebie JH, Keller B: The Octopus glaucoma G-1 program. Glaucoma 9:67, 1987

64. Johnson CA, Brandt JD, Khong AM, Adams AJ: Short-wavelength automated perimetry in low-, medium-, and high-risk ocular hypertensive eyes: Initial baseline results. Arch Ophthalmol 113:70, 1995

65. Wild JM, Cubbidge RP, Pacey IE, Robinson R: Statistical aspects of the normal visual field in short-wavelength automated perimetry. Invest Ophthalmol Vis Sci 39:54, 1998

66. Sample PA, Bosworth CF, Weinreb RN: Short-wavelength automated perimetry and motion automated perimetry in patients with glaucoma. Arch Ophthalmol 115:1129, 1997

67. Wall M, Jennisch CS, Munden PM: Motion perimetry identifies nerve fiber bundlelike defects in ocular hypertension. Arch Ophthalmol 115:26, 1997

68. Sponsel WE, Arango S, Trigo Y, Mensah J: Clinical classification of glaucomatous visual field loss by frequency-doubling perimetry. Am J Ophthalmol 125:830, 1998

69. Johnson CA, Samuels SJ: Screening for glaucomatous visual field loss with frequency-doubling perimetry. Invest Ophthalmol Vis Sci 38:413, 1997

70. Hass A, Flammer J, Schneider U: Influence of age on the visual field of normal subjects. Am J Ophthalmol 101:199, 1986

71. Jaffe GJ, Alvarado JA, Juster RP. Age-related changes in the normal visual field. Arch Ophthalmol 104:1021, 1986

72. Katz J, Sommer A: Asymmetry and variation in the normal hill of vision. Arch Ophthalmol 104:65, 1986

73. Heijl J, Lindgren G, Olsson J: Normal variability of static perimetric threshold value across the central field. Arch Ophthalmol 105:1544, 1987

74. Katz J, Sommer A: A longitudinal study of the age-adjusted variability of automated visual fields. Arch Ophthalmol 105:1083, 1987

75. Heijl J, Lindgren G, Olsson J: The effect of perimetric experience in normal subjects. Arch Ophthalmol 107:81, 1989

76. Werner EB, Adelson A, Krupin T: Effect of patient experience on the results of automated perimetry in clinically stable glaucoma patients. Ophthalmology 95:764, 1988

77. Weinreb RN, Perlman JP: The effect of refractive correction on automated perimetric thresholds. Am J Ophthalmol 101:706, 1986

78. Goldstick B, Weinreb RN: The effect of refractive error on automated global analysis program G1. Am J Ophthalmol 104:229, 1987

79. McCluskey DJ, Douglas JP, O'Connor PS et al: The effect of pilocarpine on the visual field in normals. Ophthalmology 93:843, 1986

80. Lindenmuth KA, Skuta GL, Rabbani R et al: Effects of pupillary constriction on automated perimetry in normal eyes. Ophthalmology 96:1298, 1989

81. Guthauser U, Flammer J: Quantifying visual field damage caused by cataract. Am J Ophthalmol 106:480, 1988

82. Zalta AH: Lens rim artifact in automated threshold perimetry. Ophthalmology 96:1302, 1989

83. Heijl A, Lindgren A, Lindgren G: Test-retest variability in glaucomatous visual fields. Am J Ophthalmol 108:130, 1989

84. Parrish RK, Schiffman J, Anderson SR: Static and kinetic visual field testing: Reproducibility in normal volunteers. Arch Ophthalmol 102:1497, 1984

85. Lewis RA, Johnson CA, Keltner JL, Labermeier PK: Variability of quantitative automated perimetry in normal observers. Ophthalmology 93:878, 1986

86. Brenton RS, Argus WA: Fluctuations on the Humphrey and Octopus perimeters. Invest Ophthalmol Vis Sci 28:767, 1987

87. Katz J, Sommer A: Reliability indexes of automated perimetric tests. Arch Ophthalmol 106:1252, 1988

88. Flammer J, Drance SM, Augustiny L, Funkhouser A: Quantification of glaucomatous visual field defects with automated perimetry. Invest Ophthalmol Vis Sci 26:176, 1985

89. Wilensky JT, Joondeph BC: Variation in visual field measurements with an automated perimeter. Arch Ophthalmol 97:328, 1984

90. deJong DGMM, Greve EL, Bakker D, van den Berg TJTP: Psychological factors in computer assisted perimetry; automatic and semiautomatic perimetry. Doc Ophthalmol Proc Series 42:137, 1985

91. Bickler-Bluth M, Trick GL, Kolker AE, Cooper DG: Assessing the utility of reliability indices for automated visual fields: Testing ocular hypertensives. Ophthalmology 96:616, 1989

92. Heijl A, Lindgren G, Olsson, Jet al: STATPAC User's Guide. San Leandro, CA, Allergan Humphrey, 1986

93. Sommer A, Enger C, Witt K: Screening for glaucomatous visual field loss with automated threshold perimetry. Am J Ophthalmol 103:681, 1987

94. Liao PM, Gollamudi SR, Hirsch J: Evaluation of corrected loss variance as a visual field index (Part I). Ophthalmologica 197:136, 1988

95. Hoskins HD, Magee SD, Drake MV, Kidd MN: Confidence intervals for change in automated visual fields. Br J Ophthalmol 72:591, 1988

96. Werner EB, Bishop K, Koelle J et al: A comparison of experienced clinical observers and statistical tests in detection of progressive visual field loss in glaucoma using automated perimetry. Arch Ophthalmol 106:619, 1988

97. Brenton RS, Phelps CD, Rojas P, Woolson RF: Interocular differences of the visual field in normal subjects. Invest Ophthalmol Vis Sci 27:799, 1986

98. Feuer WJ, Anderson DA: Static threshold asymmetry in early glaucomatous visual field loss. Ophthalmology 96: 1285, 1989

Back to Top