Chapter 5 Clinical Visual Electrophysiology J. VERNON ODOM, MONIQUE LEYS and GEORGE W. WEINSTEIN Table Of Contents |
GENERAL CONSIDERATIONS ELECTRORETINOGRAM ELECTRO-OCULOGRAM VISUALLY EVOKED POTENTIALS MULTIFOCAL TECHNIQUES IN ELECTROPHYSIOLOGY CLINICAL APPLICATIONS REFERENCES |
In this chapter, we introduce the reader to some of the principles of and
major observations in clinical electrophysiology. Although this is
a brief summary that must be limited in its depth of coverage, several
other chapters in this volume point out the utility of electrophysiologic
measures in the diagnosis of particular diseases or categories of
disease1–4 or discuss their physiologic origins.5 Additionally, several brief books6,7 and major reviews8–10 are available for the reader who is interested in a more extensive introduction. An
excellent reference volume, which is currently being revised, is
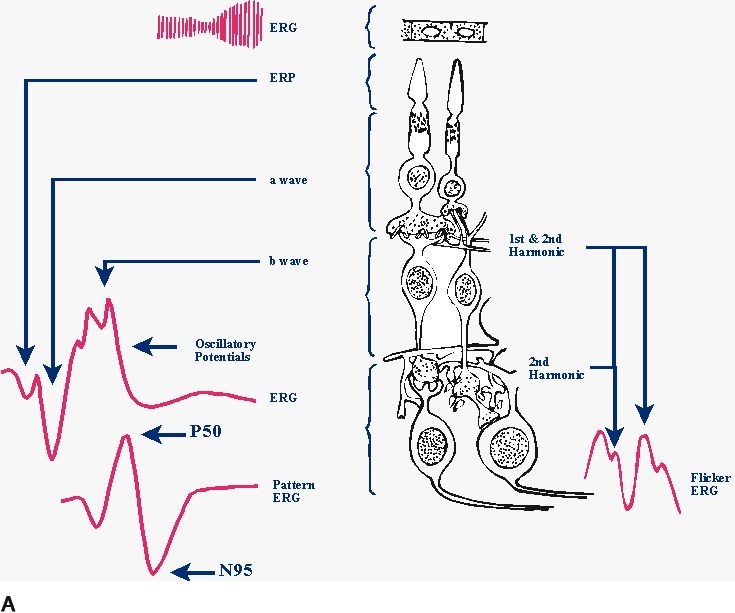
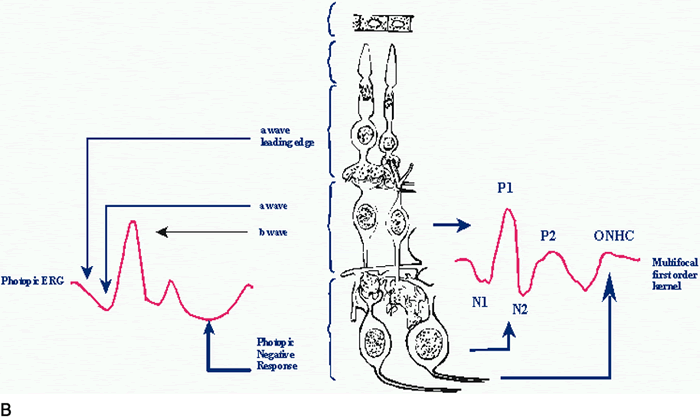
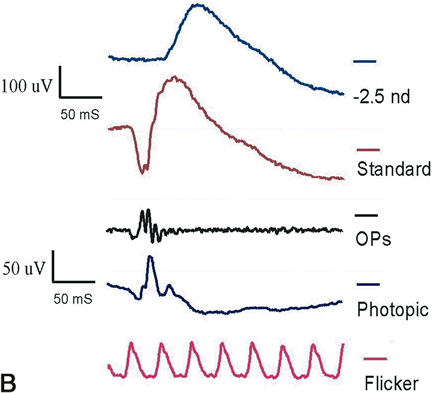
available for the serious student of clinical electrophysiology.11 The primary means of electrophysiologic testing are electroretinography (electroretinogram [ERG]), electro-oculography (electro-oculogram [EOG]), and visually evoked potential (VEP) testing. Electroretinography, as it is classically performed using flashes of light, provides information primarily about the outer retinal layers (Fig. 1A and B). EOGs (and the c wave of the ERG) reflect variations in the standing potential across Bruch's membrane and are altered by metabolic changes in the retinal pigment epithelium and outer retina (Fig. 1A). VEPs are cortical responses elicited by visual stimuli. Normal cortical responses are obtained only if the entire visual system is intact. Disturbances anywhere within the visual system can produce abnormal VEPs. |
GENERAL CONSIDERATIONS | |
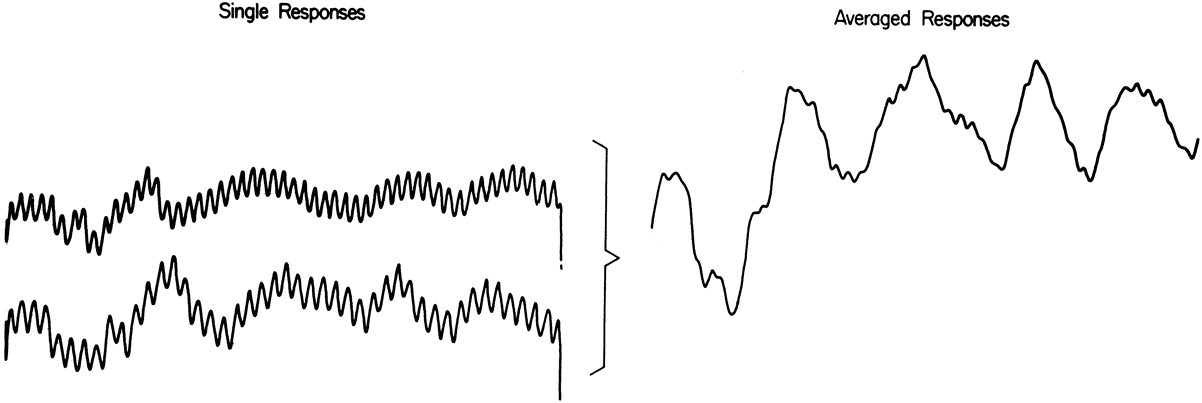
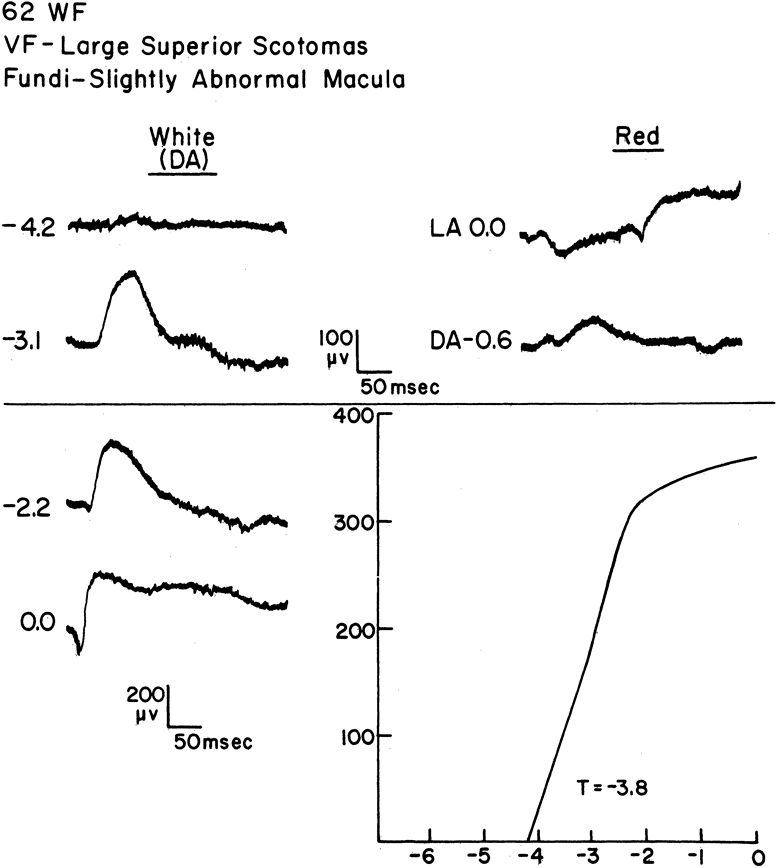
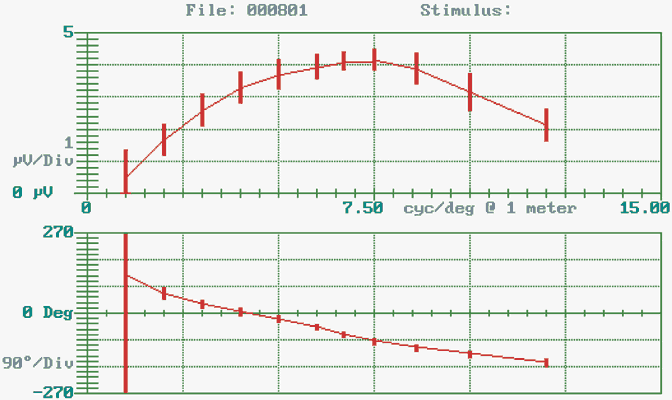
GENERAL TERMINOLOGY As with any specialized area, clinical electrophysiology abounds with specialized terminology. Terms that deal with general characteristics of the stimulus or response are introduced here. Terms specific to a particular response are introduced in that particular section. The stimulus for clinical visual electrophysiology is usually either diffuse light or patterned light. The stimulus may vary in intensity, duration, wavelength, rise time, fall time, spatial extent, and spatial location. A diffuse light stimulus varies in time but is uniform across a relatively large area of visual space. A diffuse light stimulus that appears and disappears suddenly and is of brief duration is termed a light flash or simply a flash. Diffuse, uniform stimuli are often presented in a sphere called a cupola, which provides Ganzfeld (full-field) stimulation. If the light appears and disappears periodically, it is said to flicker. The number of cycles of appearance and disappearance of light in one second equals the temporal frequency of the flicker in cycles per sec (cps) or Hertz (Hz). A patterned stimulus varies not only in time but also in space. A patterned stimulus may appear and disappear as some areas become lighter and others become darker, or it may reverse so that light areas become dark and dark areas become light. The stimulator should perform these functions without any change in mean light level or luminance, which generally requires that light and dark areas appear equally in the pattern presented. The temporal frequency of an appearing-disappearing pattern is equal to the number of appearances (or disappearances) in 1 second. However, there are two reversals in a reversal cycle. Therefore, the number of reversal cycles in 1 second of the reversing pattern expressed in Hz—in other words, the temporal frequency—is one-half the number of reversals in 1 second. Because of the possible confusion between temporal frequency and the number of reversals, it is advisable to indicate both frequency and reversal rate when describing the reversing stimulus. The spatial characteristics of a patterned stimulus may be described either in terms of the visual angle (arc tan [size/distance]) of the elements in the pattern or in terms of their spatial frequency, which is the number of cycles of light and dark transitions in one degree of visual angle. To isolate rod system from cone system function, stimuli are presented after the patient has been in the dark for some period of time. Responses recorded after a period of dark adaptation are termed dark-adapted, scotopic, or rod mediated. To isolate cone system function, patients are tested after a period in the light, usually at a light level that suppresses rod activity. Responses recorded after a period of light adaptation are termed light adapted, photopic, or cone mediated. Electrophysiologic responses elicited by visual stimuli have a shape, or waveform, which depends on the characteristics of the stimulus and the patient. The response can usually be decomposed into components. If the stimulus is presented at a slow frequency, the response is said to be transient, and peaks of a specific polarity usually define the components. The peaks can be characterized by their size or amplitude, their polarity positive or negative the time to their maximum amplitude, which is termed implicit time for the ERG and latency for the VEP. If the stimulus frequency is fast, the peaks of the transient response become blurred so that the response often consists of only one or two peaks. The amplitude and implicit time or latency of these steady state responses may be measured; for example, 30-Hz flicker ERGs, or the response, may be Fourier analyzed and characterized by the amplitudes and phases of the Fourier components. Irrespective of the response component measured, one may establish functions relating the component to a stimulus parameter, such as intensity, contrast, or frequency. If one varies the stimulus parameter and measures the response, one establishes a response function, such as an intensity response function. However, if one uses some response criterion, such as a criterion voltage, one determines sensitivity.12,13 If one determines sensitivity across a range of values, one determines a sensitivity function, such as a contrast sensitivity function. Although functions are usually determined using a set of separate responses, it is possible to determine response functions from a single stimulus presentation if the parameter of interest, such as intensity or luminance, is varied continuously (or approximately continuously). Such continuous stimulus presentations are called stimulus sweeps, and the responses elicited by them are termed sweep or swept VEPs or ERGs (Fig. 2). Generally, sweep responses are elicited by steady state stimulation as well as the signals analyzed in the frequency domain using a lock-in amplifier or Fourier analysis.14
A number of terms have been used to describe severely abnormal responses, including flat, absent, extinguished, and nonrecordable. We use the term nonrecordable as a more neutral term. Nonrecordable indicates that under a specific set of stimuli and recording conditions, a response was not recorded. Often, with a change in stimulus or recording conditions, a response is recordable. INTERNATIONAL STANDARDS Members of the International Society for Clinical Electrophysiology of Vision (ISCEV) establish ophthalmic standards for various electrophysiologic tests (http://www.iscev.org).15–24 The accepted standards are reconsidered and revised, if necessary, on a regular basis. These standards are intended to assist in normalizing electrophysiologic testing by establishing minimal standards for diagnostic test conditions and analysis methods. Additional tests or analyses are always permitted. Because of inevitable variations due to choice of electrode, subjects, and other variables, the standards also require each laboratory to establish normal values and the limits of normal values for all tests performed in that laboratory. These normal values and their limits should be included in clinical reports and publications from the laboratory. |
ELECTRORETINOGRAM | ||||
The ERG is the retinal electrical potential elicited by visual stimulation. Electroretinography
dates back more than a century.25 The amplitude of dark-adapted, flash-elicited ERGs is usually
several hundred microvolts and, therefore, does not require complex
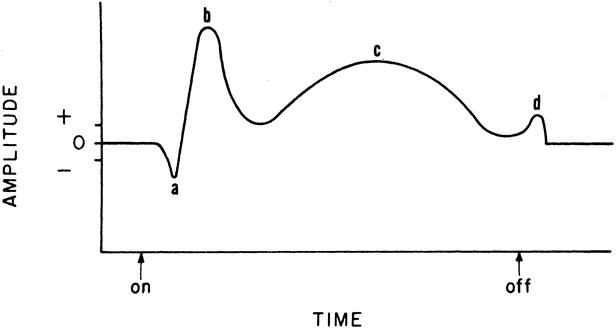
averaging instrumentation. A schematic ERG is presented in Figure 3. The era of clinical electroretinography began with the introduction of
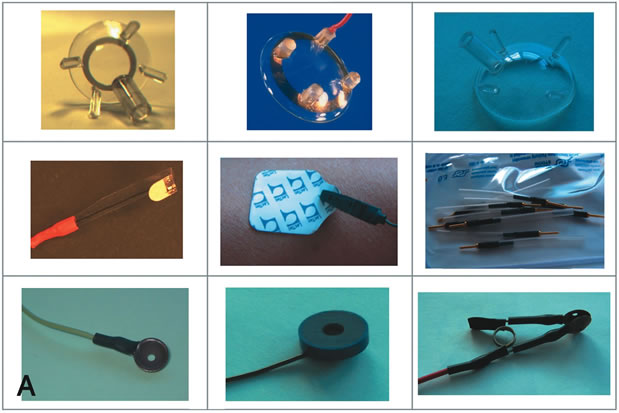
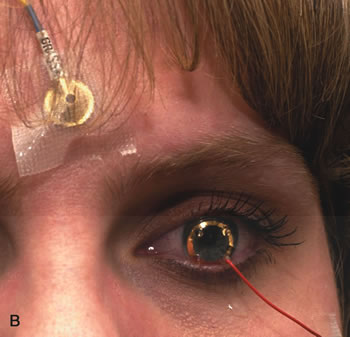
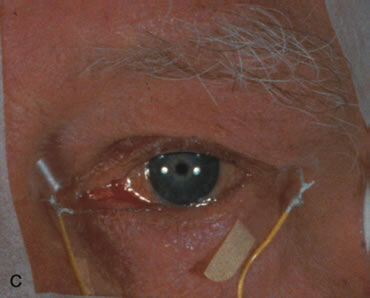
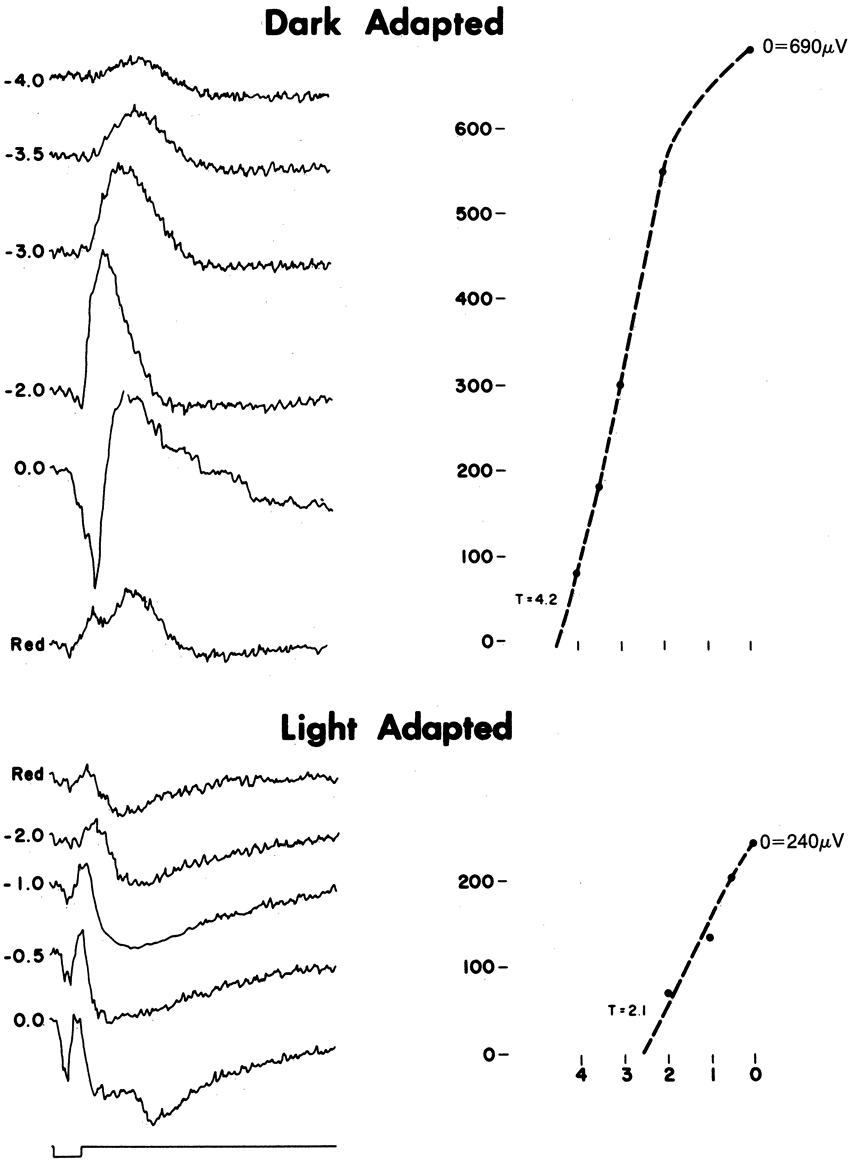
the contact lens electrode in the 1950s (Fig 4). The different waves of the ERG can be useful in detecting retinal diseases, which may or may not affect the VEP. For example, early stages of retinitis pigmentosa may have little or no effect on the VEP, although the ERG may be severely altered. In sphingolipidoses, such as Niemann-Pick disease, retinal degeneration tends to parallel cerebral dysfunction and the ERG may serve as a useful noninvasive diagnostic test. FLASH ELECTRORETINOGRAMS Retinal Physiology and the Flash Electroretinogram Under the proper conditions, the human eye has a subjective range of sensitivity of approximately 1010 (10 log units). The dark-adapted flash ERG b-wave range is approximately 1 log unit less than this. At the very lowest stimulus intensities, very near subjective threshold, under fully dark-adapted conditions, the ERG response consists of a slow negative deflection, termed the scotopic threshold response (STR), which appears to reflect the activity of amacrine cells, probably the AII type.26 As intensity increases, the STR decreases in latency and is replaced by the b wave about 1 log unit above subjective threshold; the a wave is not seen until the stimulus is 2 or 3 log units brighter (Fig 5). The c and d waves are not recorded under the ISCEV standard conditions. Both the a and b waves increase in amplitude and decrease in implicit time with increasing stimulus intensity.
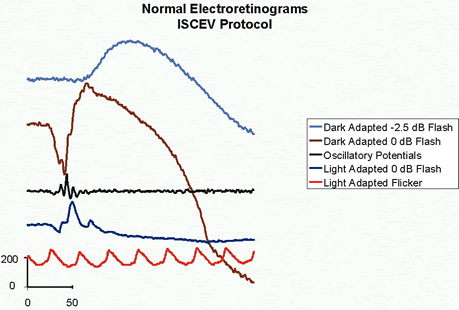
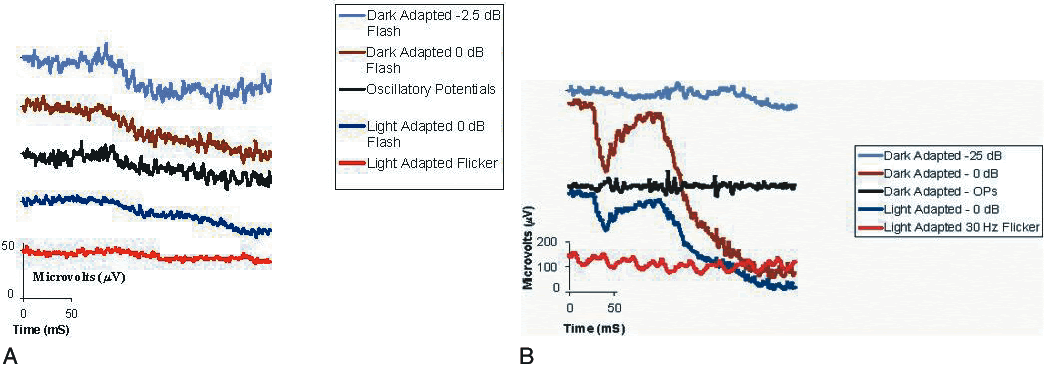
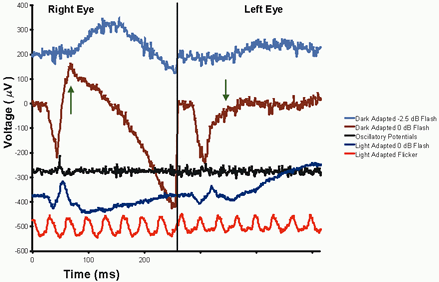
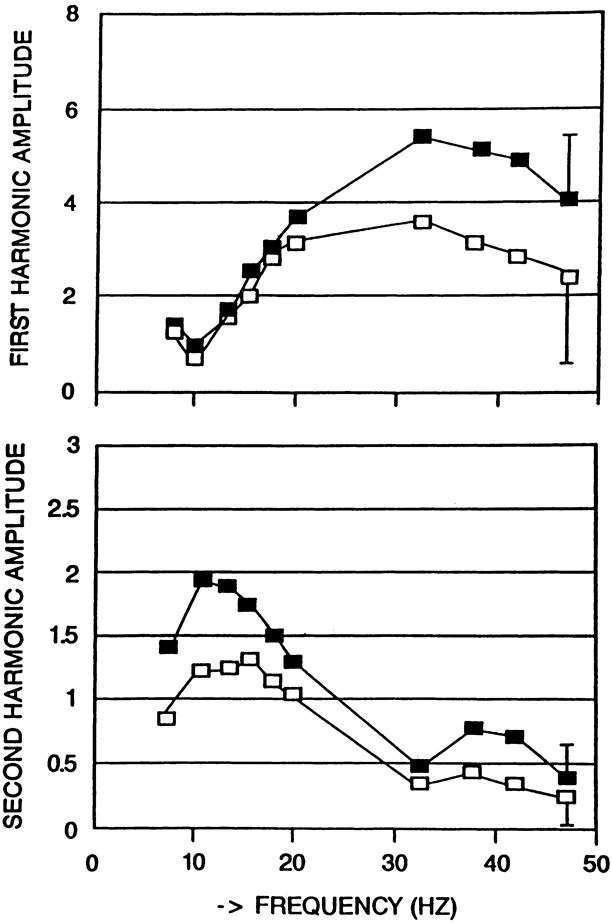
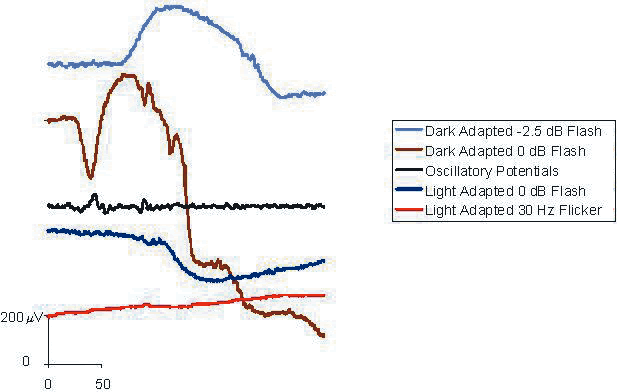
When the eye is stimulated, a chain of vegetative and neural biochemical and electrical events are activated in the retinal neural cells, glial cells, and retinal pigment epithelium. The electrical voltages reflecting these events are volume conducted through the ocular media and tissues and recorded at the cornea as the ERG. Consequently, the various waves of the ERG reflect the algebraic summation of the activity of several processes. Granit27 advanced an analysis of the dark-adapted flash ERG, the main points of which are still accepted. He identified three retinal processes, abbreviated PI, PII, and PIII. Subsequent analyses have shown that each of the three processes can be subdivided and localized with even greater precision. Generally, PI-related processes derive from the choroid and retinal pigment epithelium and are primarily reflected in the c wave. PII-related processes reflect the activity of Müller's cells at about the level of the bipolar cells and are primarily reflected in the b wave. PIII-related processes primarily derive from the outer retina at about the level of the photoreceptors and are primarily reflected in the a wave, especially in its slope. The relationship of the a-wave slope to rod photoreceptor currents has opened the door to the possibility of noninvasively monitoring human rod receptor dynamics in vivo. Perception of light in the dark-adapted and light-adapted states is subserved by different retinal circuitry. As flash intensity increases under light-adapted background conditions, both the a and b wave appear at about 1 log unit above the psychophysical increment threshold. As flash intensity increases, the a and b waves increase roughly in parallel until the b wave reaches a peak, after which the a wave continues to grow and the b wave declines in amplitude and then grows again. The light-adapted ERG is dependent on retinal cells different from those required by the dark-adapted ERG. The dark-adapted PII is dependent only on the on-bipolar cells, whereas the light-adapted PII is dependent on both the on-bipolar and off-bipolar cells. The difference in timing between activation of the on-bipolars and off-bipolars results in a small potential difference at low flash intensities, which appears as an a wave, accounting for the simultaneous appearance of a and b waves in the light-adapted ERG.28 After the photopic b wave, a negative component can frequently be seen. This photopic negative component disappears if the spiking activity of ganglion and amacrine cells is eliminated pharmacologically.29,30 Consequently, in both animal models of glaucoma31,32 and glaucoma patients,33,34 the photopic negative component is greatly reduced or abolished.35 The cone-mediated (photopic) and rod-mediated (scotopic) systems each contribute distinct components to both the a and b wave. In each wave, the photopic components are seen first because of the directness of the neuronal connections of this system as compared with the diffuseness of the scotopic system. These components are termed a-photopic (ap), a-scotopic (as), b-photopic (bp), and b-scotopic (bs). Both a and b waves originate in the outer retinal layers. The a wave is produced primarily by the photoreceptors; the b wave is produced by the Müller cells, largely at the level of the bipolar cells. The ganglion cells do not contribute to the ERG because their electrical signals are in the form of spikes that cannot be recorded externally. The ERG has been referred to as an amplitude-modulated (AM) signal as contrasted to the frequency-modulated (FM) signal of the ganglion cells. A normal ERG may be recorded in the absence of the ganglion cells or their axons (including the optic nerve), which occurs in many eye diseases (such as glaucoma and optic nerve injury or section). Nutrition comes to the receptors through the choroidal vasculature and to the inner nuclear layer (bipolar, amacrine, and horizontal cells) from the central retinal system. A variety of disorders may affect one, but not another of these circulations. For example, disorders of the retinal circulation, such as central retinal artery occlusion, tend to unmask a large negative component as the positive (b wave) is reduced. The result has been described as a “negative ERG,” a sign of inner retinal ischemia. Conversely, insufficiency of the choroidal circulation, which occurs in ophthalmic artery occlusion or degenerative disorders such as choroideremia, halts the initial chain of events, thereby producing reduction of both ERG a- and b-wave amplitudes. Because the stimulus light has a light-adapting effect on the retina, flickering stimuli tend to isolate the photopic components of the response, especially faster rates such as 30-Hz flicker. Flicker ERGs are usually of small magnitude relative to single-flash ERGs. Therefore, a flicker ERG is most informative when it is recorded using a summing and averaging device, which can extract relatively small signals from background interference. Typically, under clinical test conditions, 30-Hz flicker produces a sinusoidal response. Because the a and b waves are no longer clearly visible, the origins of the flicker ERG are uncertain. One line of argument suggests that the a wave, which diminishes with light adaptation, is suppressed. Therefore, the resultant responses consist mainly of b waves. Alternatively, Müller's cells, which generate the b waves, are relatively less active at higher temporal frequencies,36 so the response to 30-Hz flicker might reflect neural activity, primarily the cone receptor potential.37 It is also possible to separate 30-Hz flicker ERGs into linear, first harmonic, and nonlinear, second harmonic components, which have an apparent latency suggestive of an outer retinal (receptor or bipolar cell) origin of the first harmonic components and an inner retinal (amacrine or ganglion cell) origin of the second harmonic.38 If one varies stimulation frequency, the first harmonic has multiple maxima and minima, suggesting that at least two sources combine to generate it and that these two sources cancel out at around 10 Hz.38 The two mechanisms are the on- and off-bipolar cells, which are about 180 degrees out of phase in the region of 10 Hz.39–41 If one blocks all postreceptor activity, there is minimal first harmonic response remaining, which indicates that the photoreceptors do not make the major contribution to the first harmonic in the 30-Hz region.41 Oscillatory potentials (OPs) appear as oscillations on the ascending portion of the b wave. The sensitivity of OPs to inner retinal diseases is consistent with suggestions that OPs derive from inner nuclear and/or the inner plexiform layers of the retina. However, individual oscillations may have different sources, as the number and characteristics of the OPs change with light adaptation and stimulus parameters. International Standards for Clinical Electroretinography Internationally accepted ERG standards were finally achieved in l98915 and have been revised subsequently.16 To comply with the international standards, a clinical laboratory must employ full-field stimulation. ERGs may be recorded using a variety of corneal electrodes, including contact lens, fiber, and foil electrodes. Contact lens electrodes have been preferred in the United States. Standard flashes must be 5 milliseconds (msec) or less in duration at their peak and have an intensity of between 1.5 and 3 candelas per square meter per second (cd·m-2·s-1). If a laboratory or manufacturer cannot generate a stimulus with these characteristics, they may calibrate the stimulus relative to the standard to generate a response of equivalent response characteristics. The light-adapted background must be between 17 and 34 cd·m-2 depending on the luminance of the standard flash. Clinical ERG testing should assess the function of both cones and rods. Rod function should be tested using at least two ERGs recorded following a minimum of 20 minutes of dark adaptation with a minimum of 5 seconds between flashes. A dark-adapted ERG elicited by a low-luminance flash (2.5 log units below the standard flash) and an ERG elicited by a standard flash are suggested as standards for testing dark-adapted function. Dark-adapted OPs should also be recorded. The OPs should be measured in the dark using standard flashes and recording the second and subsequent flashes with a 15 msec separation. To assess cone function, one should record a light-adapted ERG elicited by the standard flash following a minimum of 10 minutes of light adaptation. Flicker should be presented at the standard intensity, with the background at the same level as for the light-adapted ERG, and the frequency should be 30 Hz. Figure 5 presents examples of normal ERGs recorded under a range of stimulus intensities. Figure 6 presents normal ERGs recorded using the ISCEV protocol.
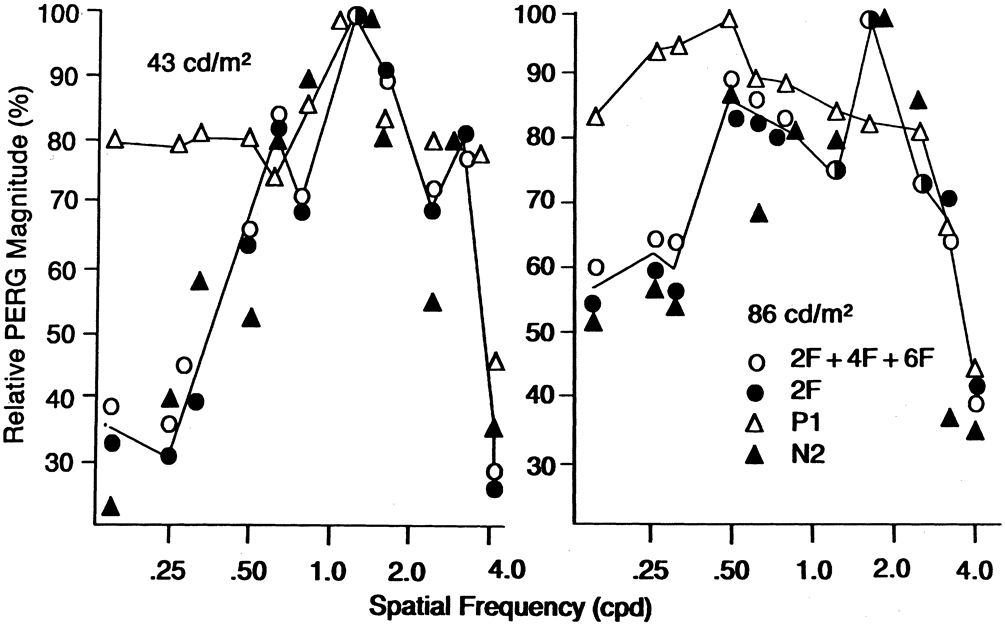
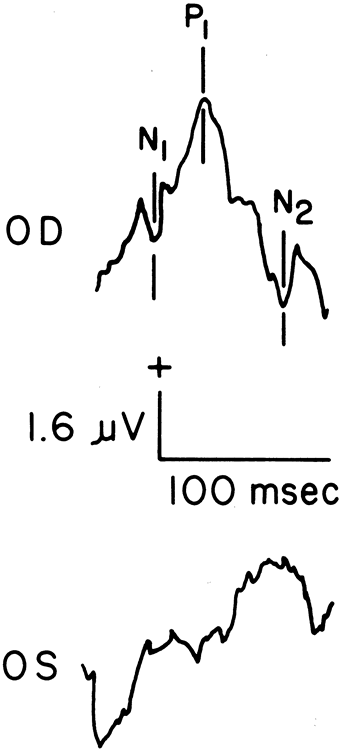
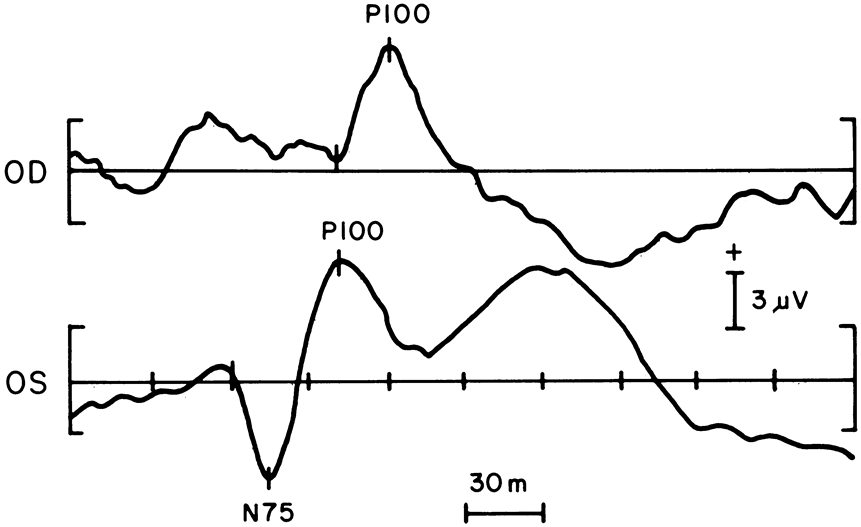
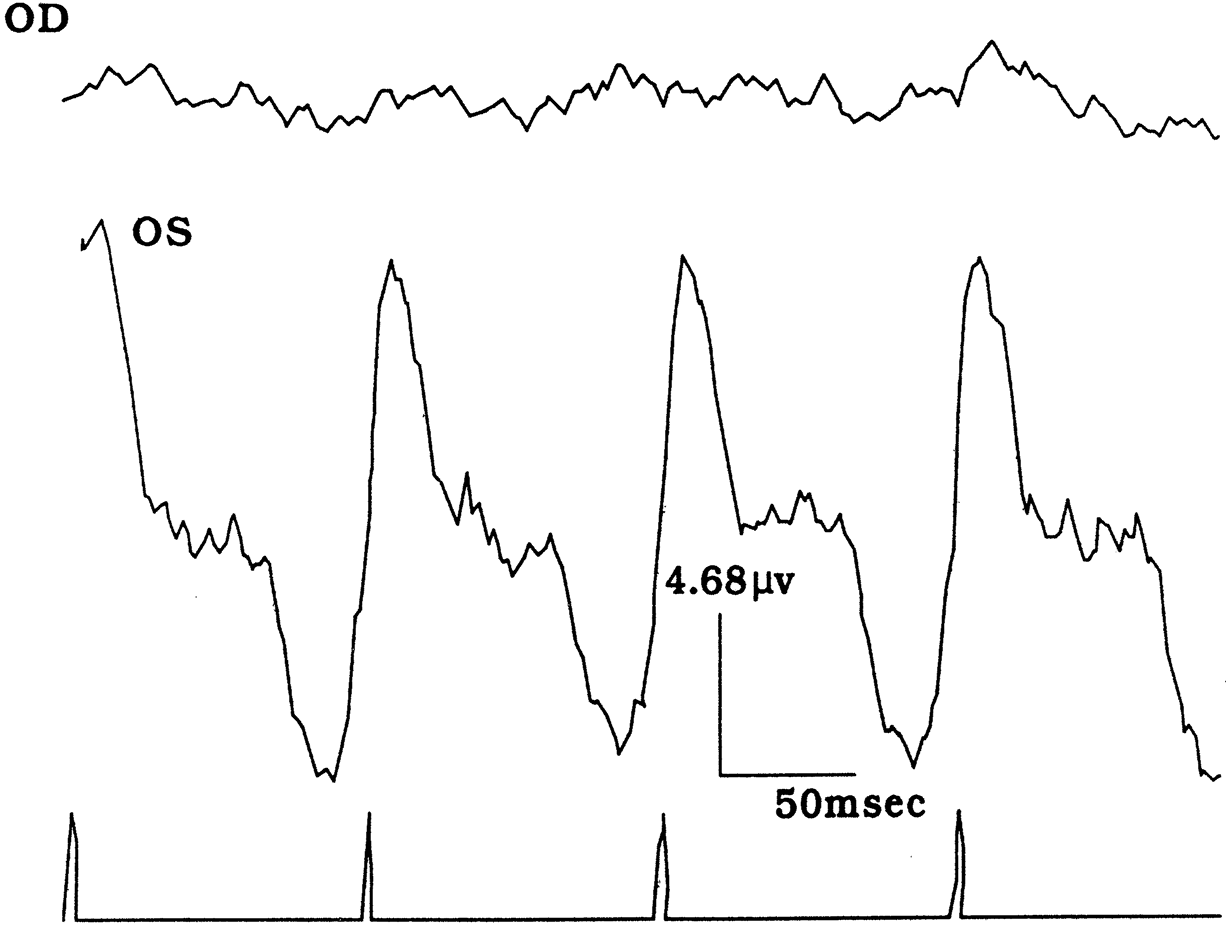
Some clinical electrophysiologists employ different stimulus conditions or record ERGs using skin electrodes placed underneath the eyes as their active electrodes. Although such recordings do not conform to the standard, they can be clinically useful. Recordings using skin electrodes may be especially useful in children who are too old to be swaddled or sedated but remain uncooperative with corneal electrode testing. Nonstandard conditions are most useful if appropriate norms and normal limits are available. Some countries, notably France, concerned about disease transmission through contact with the cornea and tear film require the use of disposable electrodes. BEYOND THE STANDARD ELECTRORETINOGRAM The ISCEV standards represent what its members regard as the minimum needed to perform a satisfactory, clinically useful ERG examination. Several modifications of the ERG protocol have proven particularly useful adjuncts to the ISCEV standard ERG: use of chromatic filters, calculation of intensity response functions, modeling of photoreceptor current, use of long-duration flashes, and measurement of the photopic negative response. It is not clear which, if any, of these techniques will gain widespread use, and in part, it depends on their careful implementation on commercial equipment as a “standard” protocol on that system. Chromatic Electroretinograms Most ERG protocols before the ISCEV standard employed chromatic stimuli as one means of isolating rods and cones. Consequently, most commercial clinical electrophysiology systems provide some means by which chromatic stimuli and backgrounds may be presented. Although the ISCEV standards eliminated this requirement, some diseases are best studied using chromatic stimuli. A notable example is the enhanced S cone syndrome, which is characterized by an enhanced response to stimuli that activate short-wavelength–sensitive cones.42–49 Additionally, experiments investigating the photopic negative response have frequently employed chromatic stimuli.32–34,50 Present evidence seems to support the idea that the S cone photopic negative response is more sensitive to glaucomatous damage than the L or M cone photopic negative response.51 Intensity Response Functions Sometimes referred to as Naka-Rushton or Michaelis-Menton functions, intensity response functions have been useful in understanding the mechanisms of a number of retinal diseases.12 The basic strategy in employing intensity response functions is to record ERGs under a wide range of intensity levels from very dim flashes to very bright flashes. The major question that emerges and that has not been standardized, however, is how one fits the intensity response functions.52–58 Few of the manufacturers of electrophysiology equipment supply a built-in strategy for calculating an intensity response function of the b wave. Modeling of Photoreceptor Current When intensity response functions for the b wave are calculated, the a wave at higher intensities is accentuated. Using the leading edge of the a wave, it becomes possible to calculate a response that is largely dependent on the photoreceptors.59–70 Using models based on the properties of the photocurrent, it has been possible to make interesting observations in a number of diseases.44,66,67 Implementation of the technique requires specialized curve-fitting algorithms and a much brighter flash than that recommended as the ISCEV standard. The widespread clinical application of the technique depends on implementation of the brighter flash and curve-fitting algorithms by commercial manufacturers. Use of Long-Duration Flashes In his original work, Granit27 used long-duration flashes and demonstrated an off response in the dark-adapted ERG. Several Japanese scientists continued to use long-duration flashes.71,72 The work of Professor Miyake and colleagues73 demonstrated that differences in photopic on and off responses could usefully distinguish subtypes of congenital stationary night blindness, which was further explained through subsequent work by Sieving's group and others.74–76 Subsequently, long-duration flashes have proven useful in understanding the mechanisms of a number of diseases, including cancer- and melanoma-associated retinopathies77 and juvenile X-linked retinoschisis.78,79 Measurement of the Photopic Negative Response As noted earlier, the photopic negative response is dependent on ganglion cell activity and is reduced in glaucoma.32–34,50 Therefore, as standard procedures are developed and established for eliciting the response, the photopic negative response may become a useful adjunct to standard electroretinography, and because this response is larger and easier to record, it may supplement, or even replace, the pattern ERG (PERG). PATTERN ELECTRORETINOGRAMS Although the PERG was initially thought to have the same origins as the flash ERG, the PERG is now considered to be the sum of local luminance and pattern responses.80–82 In the steady state PERG, the local luminance responses have both an inner retinal and outer retinal origin, whereas the pattern response elicited by rapid sinusoidal modulation of sine wave gratings has only an inner retinal origin.83 The local luminance responses appear to represent the parallel activity of several systems whose relative importance varies with temporal frequency.38 Consequently, the relative importance of local luminance and pattern components of the PERG vary as a function of a number of stimulus parameters, including temporal frequency, contrast, and spatial frequency. One possible source of the inner retinal local luminance component is the so-called m wave. The m wave, originating in the inner retina, shows a negative deflection to both the onset and offset of light and shows spatial tuning, such that it is largest for intermediate spot sizes.84 However, eliminating the spiking activity of retinal ganglion cells does not substantially reduce the m wave.85 The transient PERG waveform appears superficially like the ERG elicited by luminance stimulation: There is an early negativity at about 30 msec, a positivity at about 50 msec, and a later negativity at about 95 msec. Because of this superficial similarity, the responses were originally labeled a, b, and after potentials, as those of the flash-elicited ERG. More recently, because the PERG waves have different origins than those of the flash ERG, additional nomenclatures have been proposed. We use the terms N30, P50, and N95 to describe the waves of the PERG. Other alternatives that have been used are p, q, and r and N1, P1, and N2. In enucleated eyes, the PERG N95 appears to follow the activity of the optic nerve response.86 Similarly, while leaving the P50 relatively unaffected,87 elimination of spiking retinal neurons eliminates not only the photopic negative response but also the PERG N95. N95 appears to reflect activity from the ganglion cell layer more clearly than P50. N95 shows greater variation in amplitude with spatial frequency (Fig. 7) and is more affected in diseases of the optic nerve.88 P50, however, is altered in a number of diseases that affect primarily the outer retina.88 A ratio of P50 and N95 has been suggested as useful in discriminating a number of diseases that affect the optic nerve.88–91 Similarly, correcting VEP latency by PERG P50 latency may improve diagnosis and prediction of optic nerve disease.8 Examples of PERGs from a patient with pseudotumor cerebri of the left eye, which affects the optic nerve, are presented in (Figure 8. Holder91 recently reviewed his approach to clinical electrophysiology, which places the transient PERG at the center of electrophysiologic diagnosis because of its ability to differentiate inner retinal (ganglion and amacrine cell) from outer retinal (bipolar and photoreceptor). Holder's review provides an excellent introduction to the range of uses of the PERG.
International Standards for Pattern Electroretinography ISCEV approved PERG standards in 2000.21The standards emphasize the transient PERG; they discourage laboratories without special equipment from performing Fourier transforms on PERGs, which are an exact multiple of the stimulus cycles from recording or using steady state PERGs. A major emphasis of the guidelines is the care with which the signals must be recorded. Care is important because the small size of the signals that can be contaminated by electrical or physiologic artifacts, such as blinks with relative ease and the use of pattern stimulation, requires additional attention to refraction and accommodative status of the patient. The PERG is seldom more than 5 μV; therefore, averaging is always necessary. Active electrodes, which do not interfere with the optics of the eye, are recommended. Because binocular recording is recommended, the preferred electrode locations are the active electrode on the cornea and the reference near the ipsilateral lateral canthus. The recommended stimulus is a reversing black-and-white checkerboard with a stimulus field between 10 and 16 degrees and a check size of approximately 0.8 degrees, reversing at two to six reversals per second (1 to 3 Hz) in a room with dim, indirect lighting. The stimulus contrast should be greater than 80%, with the white areas greater than 80 cd·m-2. The amplitudes and latencies of the P50 and N95 should be measured. If one records steady state PERGs as well, the amplitude and phase should be measured at the second harmonic of the recommended 8-Hz stimulation rate (16 reversals per second). |
ELECTRO-OCULOGRAM | ||||||||||||||||||
The EOG reflects metabolic changes in the retinal pigment epithelium that
depend, in part, on the neural retina. Thus, this test supplies additional
information concerning the retina and its supporting tissues. As
a test of retinal function, the EOG serves primarily to complement
the ERG. Together, these tests provide objective information about a portion
of the visual apparatus. Often an abnormal EOG makes the diagnostician
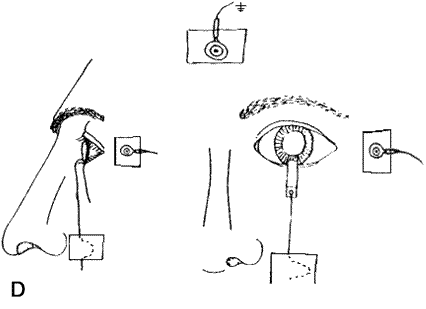
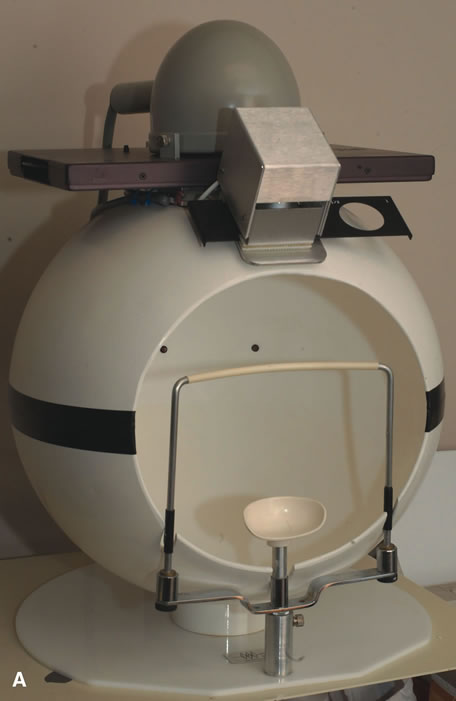
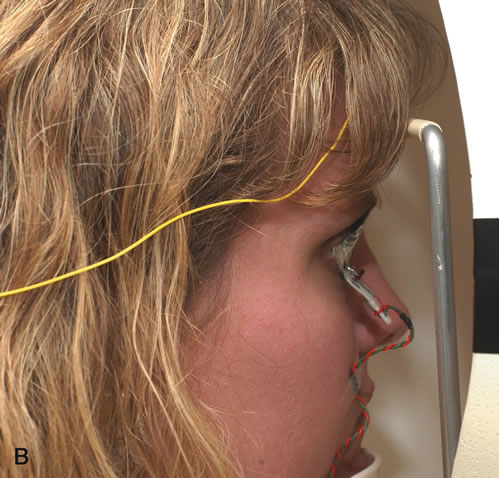
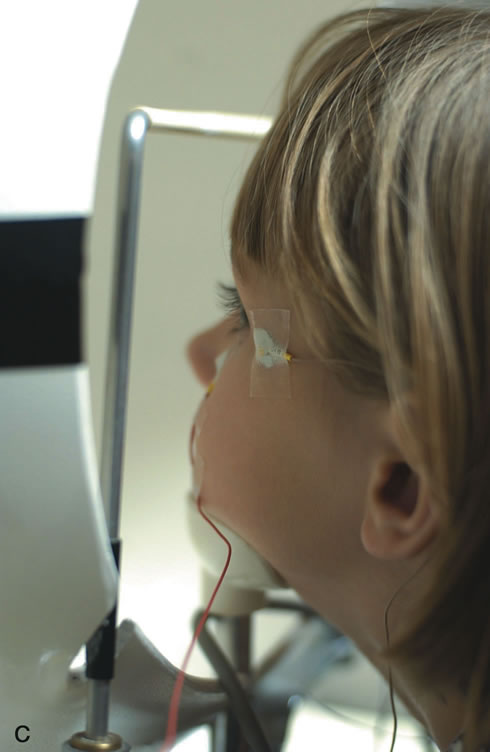
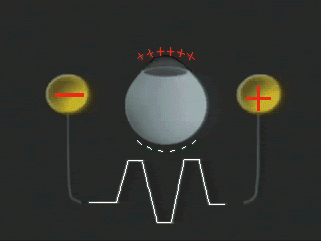
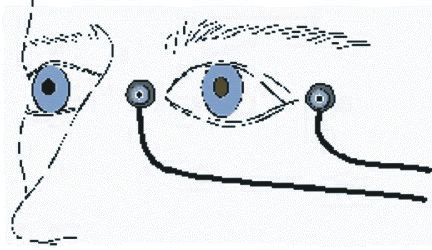
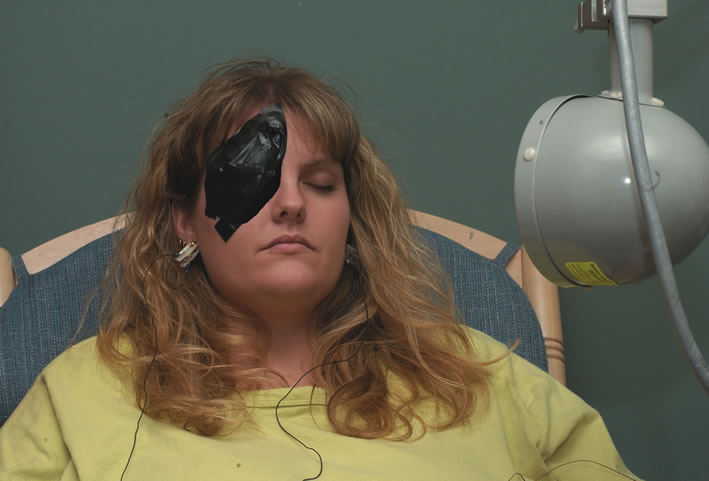
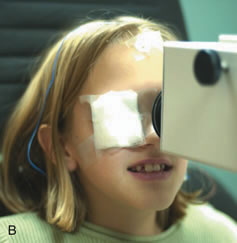
more certain of a marginally abnormal ERG. An example of a patient undergoing EOG testing in a cupola is presented in Figure 9. Electro-oculography is based on the standing potential of the eye (Fig. 10). Since the cornea is positive with respect to the posterior aspect of the eye, the eyeball acts as a dipole.92 Therefore, eye movements can be recorded by electrodes arranged in pairs on the skin (usually horizontally) (Fig. 11), so that changes in polarity can be recorded and amplified with shifts in gaze (Fig. 12). The amplitudes of the voltages generated by constant-amplitude eye movements in the light and in the dark are the basic measures obtained in the EOG.
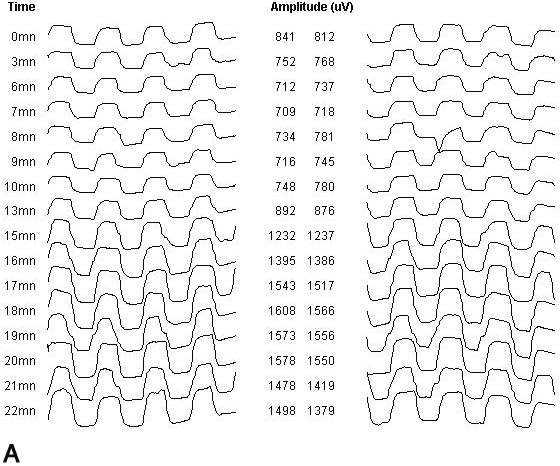
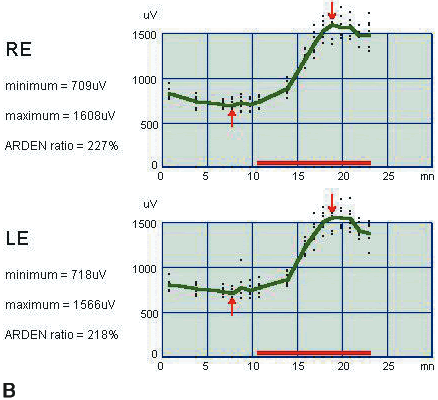
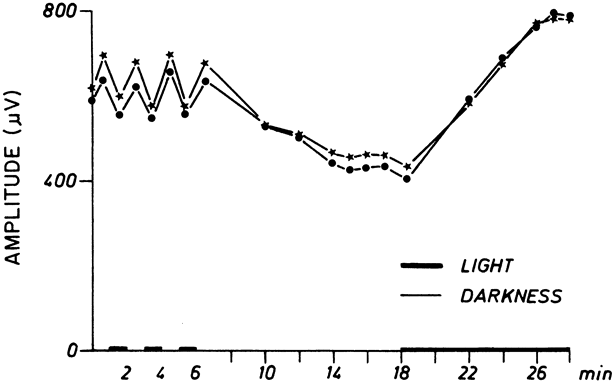
Two types of measurements may be obtained from the EOG—fast oscillations and slow oscillations—depending on the rate at which background light is changed (Fig. 13). In recording fast oscillations, the light is turned on for about 1 minute, then off for about 1 minute. The amplitude of the fast oscillations tends to increase in the dark and decrease in the light. However, if lights are turned off and remain off for about 40 or 50 minutes, the standing potential will first immediately increase in amplitude, then decrease in amplitude, reaching a minimum after about 12 minutes, and finally increase until it maintains a stable voltage at 30 to 40 minutes. When the light is turned on, a transient decrease in the standing potential is followed by an increase to a maximum level and a gradual return to baseline levels.
The amplitude of the standing potential decreases with dark adaptation and increases with light adaptation. It has been suggested that the maximum amplitude achieved in light adaptation be compared numerically with the minimum amplitude achieved in light adaptation, which is referred to as the EOG ratio.93 Normal ratios of 1.8 to 3.0 are found at most laboratories (Table 1). The normal fast oscillation ratio is usually about 1.18 and varies between 1.07 and 1.38.94 When the ratio is used, factors such as electrode placement, pupillary dilation, diurnal changes in the standing potential, and other inconstant factors tend to cancel each other out. Monitoring the amplitude of eye movements independently to ensure that they are constant may reduce further variation.95
Table 1. Ranges for Electro-Oculogram (EOG) Ratio
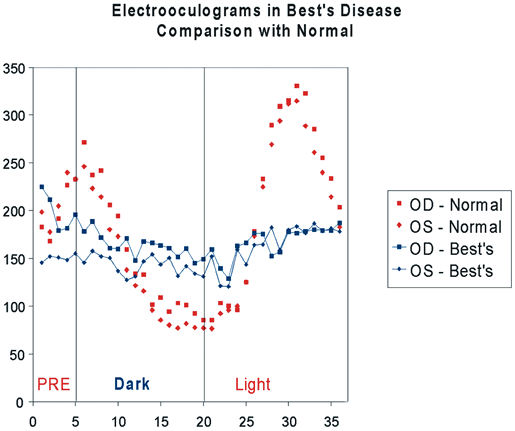
The fast and slow oscillations reflect different metabolic processes within the retinal pigment epithelium and choroid.96 Therefore, they may be dissociated in disease. Characteristically, the EOG ratio of the slow oscillations decreases in most retinal degenerations, which typically parallels the decrease in the ERG response (Fig. 13). In recording fast oscillations, the light is turned on for about 1 minute, then off for about 1 minute. The amplitude of the fast oscillations tends to increase in the dark and decrease in the light. However, if lights are turned off and remain off for about 40 or 50 minutes, the standing potential will first immediately increase in amplitude, then decrease in amplitude, reaching a minimum after about 12 minutes, and finally increase until it maintains a stable voltage at 30 to 40 minutes. When the light is turned on, a transient decrease in the standing potential is followed by an increase to a maximum level and a gradual return to baseline levels. The amplitude of the standing potential decreases with dark adaptation and increases with light adaptation. It has been suggested that the maximum amplitude achieved in light adaptation be compared numerically with the minimum amplitude achieved in light adaptation, which is referred to as the EOG ratio.93 Normal ratios of 1.8 to 3.0 are found at most laboratories (Table 1. The normal fast oscillation ratio is usually about 1.18 and varies between 1.07 and 1.38.94 When the ratio is used, factors such as electrode placement, pupillary dilation, diurnal changes in the standing potential, and other inconstant factors tend to cancel each other out. Monitoring the amplitude of eye movements independently to ensure that they are constant may reduce further variation.95 The fast and slow oscillations reflect different metabolic processes within the retinal pigment epithelium and choroid.96 Therefore, they may be dissociated in disease. Characteristically, the EOG ratio of the slow oscillations decreases in most retinal degenerations, which typically parallels the decrease in the ERG response (Fig. 14). However, in Best's disease (vitelliform macular degeneration), the EOG ratio is abnormal, even in carriers, whereas the ERG and fast oscillations are normal. In early retinitis pigmentosa, the fast oscillations and ERG may be abnormal, whereas the EOG ratio is normal.97 In retinopathy due to chloroquine and other antimalarial drugs, the EOG slow oscillations may show abnormalities earlier than the ERG. Supernormal EOGs have been noted in albinism and aniridia, in which the common factor seems to be chronic excessive light exposure with attendant retinal damage.98 In some systemic diseases affecting membranes, such as cystic fibrosis, EOG fast oscillations are abnormal even though visual function, EOG ratios, and ERGs are normal.
INTERNATIONAL STANDARDS FOR ELECTRO-OCULOGRAPHY ISCEV accepted a standard for the EOG in June 1992,18 which has not required revision. This standard requires that the adapting light be presented in a Ganzfeld (full-field) cupola with a retinal illuminance of 1000 to 3000 (3 to 3.5 log) trolands, which is equivalent to 400 to 600 cd·m-2 if the pupils are undilated or 50 to 100 cd·m-2 if the pupils are dilated. Two measures for the slow oscillations are accepted in the standard, either the light peak to dark trough EOG ratio or the light peak to dark baseline. Prior to dark adaptation, patients should be preadapted to room light levels (35 to 70 lux) for at least 15 minutes. A minimum of 15 minutes in the dark is required if one measures the light peak to dark trough; at least 40 minutes of dark adaptation is required if one is to measure the light peak to dark baseline. The light peak is recorded by measuring responses in the light until there is a clear downturn in the response, usually 12 to 15 minutes. The measure used and the normal values and their limits should be clearly indicated in reports and publications. In addition to the ratio, the time to the light peak (latency or implicit time) and the values of the dark trough or baseline should also be reported because abnormally small dark responses may have normal EOG ratios. Fast oscillations are not part of the standard. If fast responses are recorded, they should be recorded for at least six cycles. When recorded in the same session as the slow oscillations, the fast oscillations are recorded preferably prior to the measurement of the slow oscillations. When recorded prior to the slow oscillations, fast responses do not appear to affect the light/dark ratio94 (see Fig. 13). |
VISUALLY EVOKED POTENTIALS | |||||
The visually evoked potential (VEP, also referred to as the visually evoked response or the visual event–related potential) is produced by electrical activity in the visual cortex in response
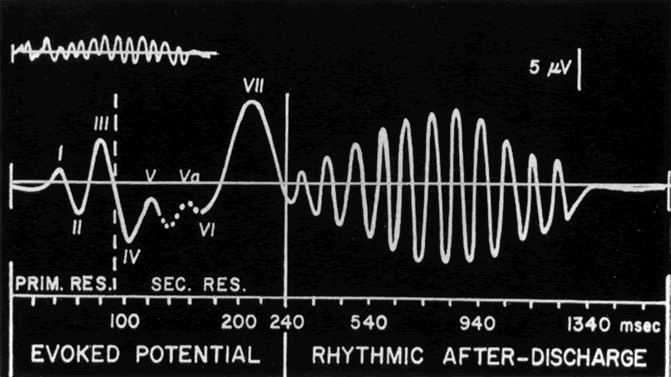
to stimulation of the eye (Fig. 15).99–103 The response is complex, incorporating electrical events that are related
to visually initiated reflexes and visual perception (Fig. 16). The entire visual cortex (areas 17, 18, and 19) contributes
to the VEP, but the portion of greatest interest to ophthalmologists
is the primary evoked response, attributed to area 17. Any changes
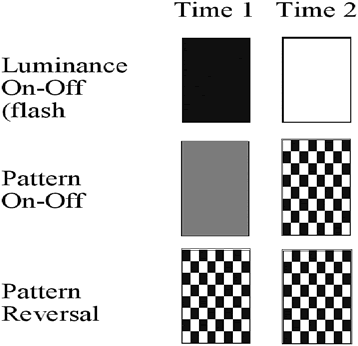
in visual stimulation may be used to elicit a VEP (Fig. 17).
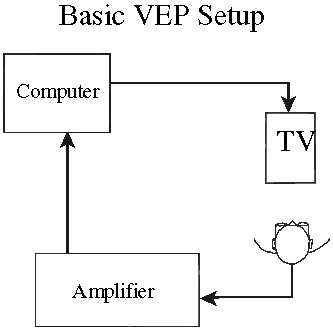
A disproportionately large cortical area represents the central retina as compared with the peripheral retina. Therefore, the VEP primarily reflects central visual function, especially overall visual acuity, which makes it of particular importance in the clinical evaluation of patients who cannot (or will not) cooperate for subjective testing. VEP recording begins with scalp electrodes over the occipital cortex (Fig. 18). The tiny (5 μV) responses to flash or patterned (e.g., checkerboard) stimuli are amplified, but may still be “buried” in the background electrical noise that is always present. Therefore, repeated stimuli are given and “time-locked” responses are obtained. These responses are stored and averaged electronically in a signal averager, and the responses may then be recorded (Fig. 19). The VEP represents cortical electrical activity in response to visual stimulation of the retina. As such, the VEP encompasses the entire visual system. In clinical settings, VEP recordings are made with scalp electrodes. These are usually surface rather than needle electrodes, eliminating patient acceptability as an issue in most cases.
|
VISUALLY EVOKED POTENTIALS ELICITED BY PATTERNED STIMULI | |
Patterned VEPs can be elicited by either pattern reversal (or counterphase
reversal) or pattern appearance/disappearance (onset/offset, or
on/off) using checkerboards, square wave gratings, or
sine wave gratings as pattern stimuli. Probably the most frequently
employed stimulus in clinical practice is a slow (one to five reversals
per second), square wave reversal of high-contrast
checkerboards with checks of 30 arc min or greater. Under these conditions, the
transient response waveform consists of an early positivity
at about 50 msec, a negative component at about 70 msec, a major positive
deflection at about 100 msec followed by a second negativity at about 140 msec, and
sometimes a second positivity at about 155 msec. The response parameters that are most frequently used clinically are the time from stimulus onset to peak (latency) of the largest positive component, the P100 or P2, and its amplitude. Defects of the optic nerve, such as those encountered in a variety of optic neuropathies, may produce prolonged latencies and/or decreased amplitude of this component (Fig. 20).
The pattern reversal evoked potential is a complicated response that reflects the summation of several underlying processes, depending on the exact stimulus parameters, such as check size, reversal rate, and mean luminance. These include the summation of local luminance and contrast responses, the summation of pattern appearance and disappearance responses, and the summation of movement and contrast responses. Given the multiple processes summated in pattern reversal VEPs, there are multiple cortical origins of pattern reversal VEPs. Responses elicited by reversal stimulation tend to be more affected by eye movement disorders, such as nystagmus. However, one possible advantage of the pattern reversal VEP is that its basic waveform remains constant as a function of age, unlike the pattern appearance VEP.104 The major change involves a reduction in the latency of the major positive component from about 200 msec in early infancy to about normal adult values by 2 to 3 years of age105. |
VISUALLY EVOKED POTENTIALS ELICITED BY LUMINANCE CHANGE | ||
If a luminance VEP is elicited
by a luminance pulse or flash, the typical waveform shows positive peaks
at about 45, 100, and 190 msec and negative peaks at about 65 and 150 msec,
followed by what has been termed after discharge, which represents
restitution of cortical electrical activities to prestimulus conditions
(see Fig. 16).106
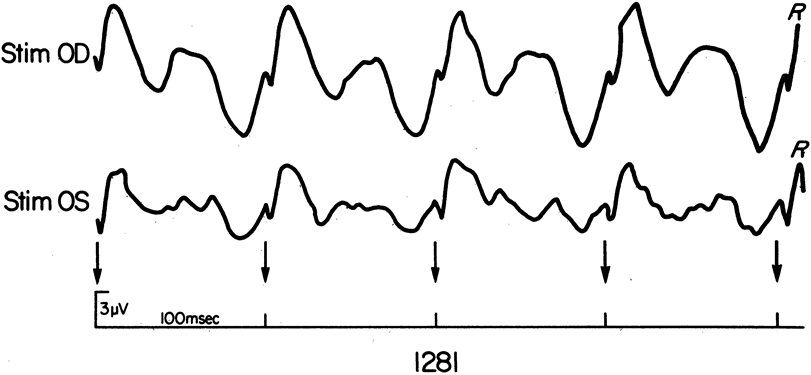
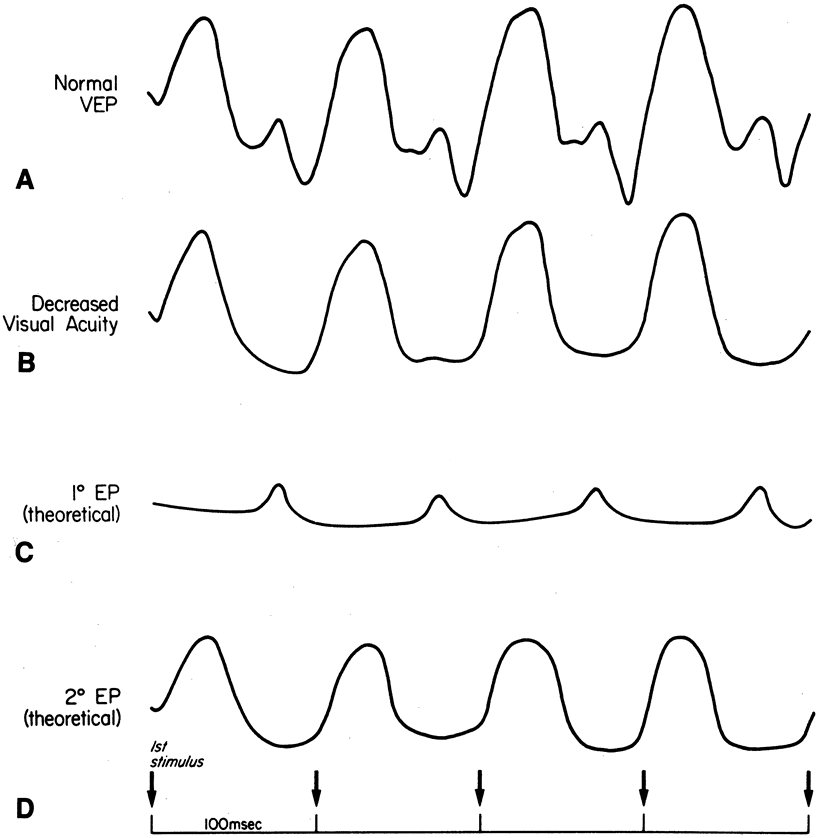
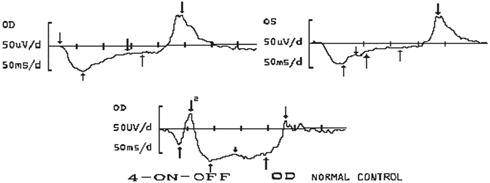
The initial period before about 100 msec, termed the primary evoked response, most likely represents activity in area 17 of the striate cortex and seems more closely related to central visual function because the fovea and macula are disproportionately displayed near the tip of the occipital cortex. The electrical activity after about 100 msec, termed the secondary evoked response, most likely represents spread of information to areas 18 and 19 as well as to other associational areas governing eye movements, visual memory, and other poorly understood activities.106,107 Periodic luminance stimulation (flicker) can be provided in one of several ways: xenon flashes or lights modulated with sine or square waves. Stimulation that is more rapid tends to collapse the major components of the VEP into a simpler waveform. There are three peaks in the function relating VEP amplitude to frequency of stimulation: one at about 10 Hz, one at about 20 Hz, and one at about 40 Hz. These three frequency regions have different functional properties, suggesting that they represent functionally separate neural systems.108 For example, scalp topography of the response suggests that VEPs elicited by stimulation of 30 Hz and higher are limited to the striate cortex and probably reflect the same mechanisms as those that generate the flash VEP negative-positive complex at about 40 to 70 msec. The 20-Hz peak appears to reflect the mechanisms present in the complex at about 100 msec and the 10-Hz peak appears to reflect the later, more diffuse activity of the transient luminance VEP. If patients are tested with closed eyelids at the rate of 10 Hz, the waveform becomes a double-peaked response (Fig. 20). Most likely, the smaller peak represents the primary evoked response and the larger peak represents the secondary evoked response (Fig. 21).38,39 Accordingly, a train of responses to 10-Hz stimulation usually places the smaller peak approximately 80 to 100 msec following the preceding flash, with the larger peak occurring between 110 and 130 msec following the preceding flash (Fig. 22). As with all VEPs, binocular stimulation produces larger responses if the visual system is otherwise normal. This occurs because most cortical neurons are binocularly innervated.
|
INTERNATIONAL STANDARDS FOR VISUALLY EVOKED POTENTIALS |
The current ISCEV VEP standards and their revision, which is in press,19recognize three types of stimuli: flash, pattern reversal, and pattern
onset/offset. All standard stimuli are transient with two or less flashes, reversals, or
appearances per second. A standard flash, as defined
in the ERG standards, should elicit the flash VEP, although a wide-field
flash is acceptable. The pattern reversal stimulus consists
of black and white checks or black and white gratings that abruptly
alternate without an overall change in luminance. At least two pattern
element sizes should be 10- and 15-minute checks, or 1.0 and 4.0 cycles
per degree gratings. The visual field stimulated should
exceed 15 degrees. The pattern onset/offset stimulus should abruptly
appear and disappear from a diffuse background, which has the same space-averaged
luminance as the pattern. The recommended pattern/blank
screen sequence is a 200-ms pattern separated by at least 400-ms
diffuse background. The analysis time should include both
onset and offset responses. All VEPs should be recorded with normal
pupils monocularly. Two general purposes are recognized for performing VEPs: assessment of prechiasmal lesions and assessment of postchiasmal lesions. For both purposes, pattern reversal is the preferred stimulus. Flash stimuli are preferred only in the presence of media opacities. Pattern onset/offset is mainly of benefit if one wishes to assess acuity. To detect prechiasmal dysfunction, it is essential that monocular stimulation be performed. Prechiasmal defects can be detected using a single channel with the active electrode placed over Oz; therefore, one channel is required. However, if a postchiasmal problem is present, it cannot be detected. Three channels are suggested as preferable, with electrodes placed at Oz, O4, and O3 and referred to Fz. To detect chiasmal or postchiasmal defects, recordings must be performed over both cerebral hemispheres. The active electrodes should be placed at locations Oz, O4, and O3 and should be referred to a common reference at Fz. Additional active electrodes at O1 and O2 are suggested as useful. Pattern reversal stimulation is preferred. |
BEYOND THE STANDARD VISUALLY EVOKED POTENTIAL |
As is the case of the ERG standard, the VEP standard represents a minimum
set of stimulus and response conditions that can be clinically useful. Numerous
variations on the VEP, however, can prove to be useful in
specialized clinical situations. These include, but are not necessarily
limited to, sweep VEPs, dichoptic VEPs, and channel-specific
VEPs. Sweep Visually Evoked Potentials Sweep VEPS are a special class of steady state VEPs in which some stimulus parameter is changed during the course of a recording period or sweep.109–111 Most frequently, the parameter varied is spatial frequency or contrast. Using a standard set of criteria, one can use this rapidly acquired information to determine a threshold. In patients who are nonverbal or preverbal, or whose verbal responses cannot otherwise be trusted, these responses can be a useful means of determining acuity or other thresholds. Dichoptic Visually Evoked Potentials Dichoptic VEPs are elicited when the stimuli presented to the two eyes differ in some parameter. In the most recent past, the stimulus parameters, which have been of greatest interest, have been temporal frequency or phase. When one stimulates each eye with a stimulus of different frequency (f1 and f2), intermodulation frequencies (f1 ± f2) are generated.108,112,113 These intermodulation frequencies depend on cortical interactions and are abnormal in many types of abnormal binocular interactions.114–116 Similarly, phase differences in input yield very different predictions of the type of response that will be generated, depending on the type of binocular interaction present.113,117,118 Dichoptic VEPs recorded in animal primate models also indicate their utility in understanding developmental processes of binocularity.119,120 Channel-Specific Visually Evoked Potentials Channel-specific VEPs are VEPs elicited by stimuli that are designed to stimulate primarily one channel or pathway. For example, isoluminant stimuli are presumed to stimulate primarily the parvocellular system121–123 and motion stimuli are presumed to stimulate primarily the magnocellular system.124–129 Similarly, patterns that appear by increasing in mean luminance and those that appear by decreasing mean luminance appear to stimulate the on and off pathways specifically.130,131 Although the separation of pathways is seldom, if ever, complete, the selective stimulation of one of several pathways permits a clearer identification of the mechanisms of some diseases and their more precise diagnosis.122,123,127 |
MULTIFOCAL TECHNIQUES IN ELECTROPHYSIOLOGY | |||||||||||||||||||||||||||||||||||||||||||||||||||||||||||||||||||||||||||||||||||||||||||||
For many years, clinical electrophysiologists attempted to develop an objective
map of visual function. There are many reasons for desiring an
objective map of visual function. A map of visual function should correlate
better with localized lesions than does the standard ERG and should
provide information about central retinal function, which the standard
ERG does not. A perfect example of this usefulness of the multifocal
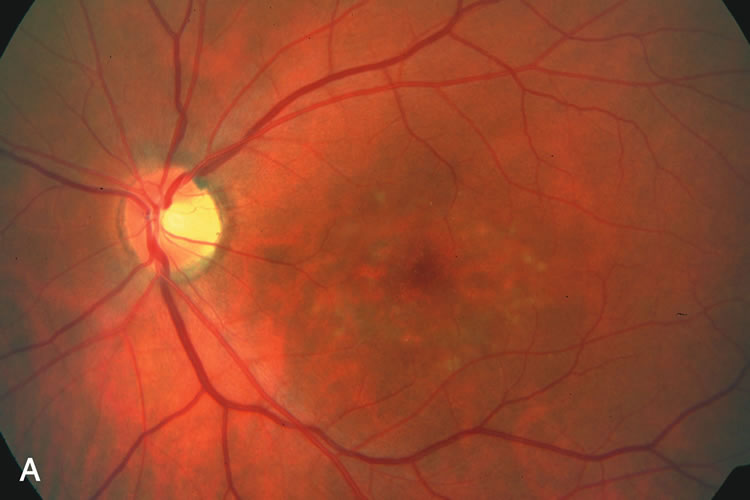
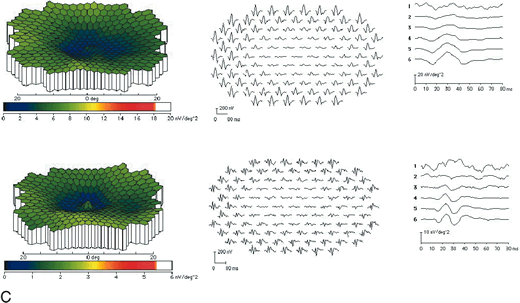
ERG (mfERG) is provided in Figure 23, in which a macular dystrophy is clearly visualized on the mfERG. Lastly, ophthalmologists
are familiar with looking at visual fields and thinking
of variations in function as correlating with specific diseases.
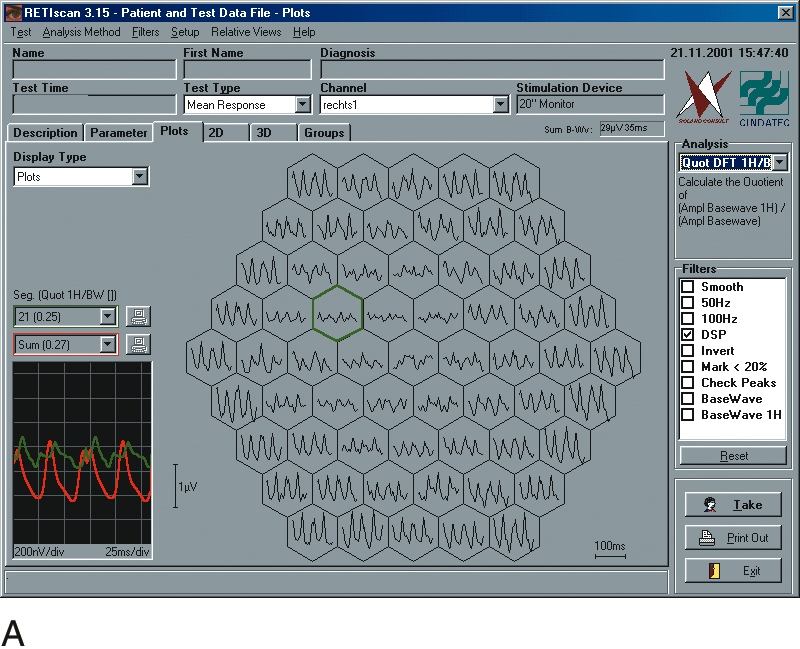
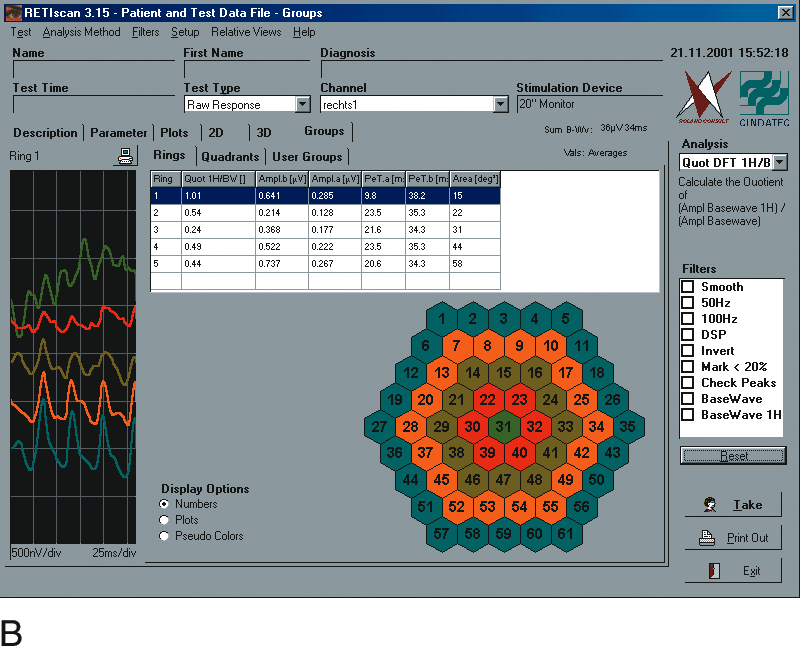
Initial efforts to create visual function maps using electrophysiology involved sequential stimulation of locations in the visual field and recording the response of each location in its turn. As one might imagine, such efforts were long and tedious for both the patient and the electrophysiologist. Tagging different locations in the visual field, usually by using a different frequency for each locus, improved the ability to gain information about several different areas of the visual field simultaneously.132 Technical limitations usually limited such efforts to two or four visual field regions. However, Erich Sutter133–135 clearly made true visual fields using electrophysiologic measures possible with his introduction of the multifocal electroretinogram in the 1990s, following almost a decade of developmental work. Once Dr. Sutter showed the way, several groups have followed his example and introduced their own versions of multifocal techniques. Presently, at least four systems are available internationally: two manufactured by Roland Consultant of Germany, one by Metrovision of France, and one by ObjectiVision of Australia. Each system uses a different approach. Although we present some information about each, the clear emphasis is on the visually evoked response imaging system (VERIS) manufactured by Dr. Sutter's company, Electro-Diagnostic Imaging (EDI). This is not intended as a commercial endorsement but an acknowledgment that more is known about the operation and performance of the VERIS than about the other systems. Readers interested in a more detailed but still basic account of kernel analysis, are referred to Odom, 1995,136 and those interested in a solid introduction to the interpretation of multifocal kernels and summary of the recent state of knowledge are referred to a review by Donald Hood.137 GENERAL PRINCIPLES OF MULTIFOCAL SYSTEMS At their most basic level, all multifocal systems have three basic components: a method of tagging multiple locations in the visual field by stimulating each location in a different manner; extraction of the response elicited at each location, using the tag as an identifier; and a system of displaying a field map of the extracted responses. Current systems differ largely in their strategy for tagging and extracting responses from different locations. There are two basic strategies: one based on frequency analysis and one based on time series analysis. The majority of current research and clinical activity using multifocal systems has been with the multifocal electroretinogram; however, the basic strategy may be used to map any visual function—namely, retinal, cortical, pupillary, or neuroimaging—with appropriate adjustments for the function. Similarly, most stimuli have involved luminance modulation; however, pattern or chromatic modulations are possible. PRINCIPLES OF FREQUENCY-BASED APPROACHES In frequency-based strategies, each location to be tested is modulated at a different temporal frequency. The recorded response is then Fourier analyzed and each frequency of stimulation is extracted. Although, theoretically, it should be possible to use a wide range of frequencies, practically different frequencies preferentially stimulate different visual subsystems; therefore, from a pragmatic point of view, it is preferable to use a set of stimuli that are close in temporal frequency. Roland Consult has constructed a system that consists of a set of spaced light-emitting diodes (LEDs) that are each modulated at a different frequency near 30 Hz. Responses are Fourier analyzed with a resolution of about 0.01 Hz, and the amplitudes and phases of the first and second harmonic are calculated. Waveforms and values can be displayed in a field map. An example of the display and traces are shown in Figure 24. At this point, we are unaware of published studies that have used the Roland Consult frequency-based system. In the absence of knowledge to the contrary, it seems reasonable to assume that the origins of these first and second harmonic responses are the same as those for the full-field ERG, namely, bipolar cell level for the first harmonic and ganglion cell and amacrine cell layer for the second harmonic (see Fig. 1).
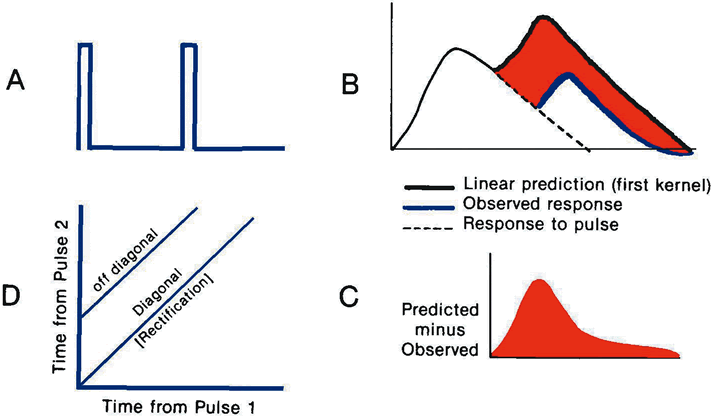
PRINCIPLES OF THE TIME SERIES–BASED APPROACHES The available time series–based systems employ pseudorandom binary sequences. The EDI system employs an m sequence (although modified m sequences are possible in the scientific version of the instrument). The Roland Consult and Metrovision systems also use m sequences, whereas the ObjectiVision uses a subset of an m sequence termed a Kasumi sequence. The precise algorithm varies between systems, but the general principle is that the sequences are constructed to be independent for each location stimulated. Responses, or kernels, are extracted for each location by cross-correlating the response with the pseudorandom stimuli. Most commonly, only a first- and a second-order kernel are extracted, although in theory it is often possible to extract even higher-order kernels and to extract “cross-kernels” that would describe the effects of one stimulus region on another. Kernels are calculated by cross-correlating the response with the stimulus; therefore, they themselves are not responses in the same sense that a standard ERG or VEP is a response. However, they do represent and predict responses. Figure 25 provides an illustration of what kernels represent. The first-order kernel represents the best approximation under the stimulation conditions of the linear response of the system. The second-order kernel represents an estimate of the deviation from the prediction of this linear approximation. As such, it represents the effect of one stimulus on another.
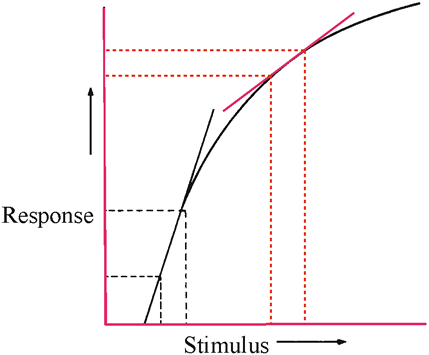
Interpretation of mfERGs and multifocal VEPs (mfVEPs) also requires an understanding of the visual system. Although the first-order kernel represents a best approximation of the linear behavior of a system, the visual system is highly nonlinear. Therefore, even a best approximation of linear behavior will contain nonlinear contributions (Fig. 26). When we think of the visual system, we recognize that it is highly nonlinear and that those nonlinearities are different for the retina and the cortex. For example, at the retinal level, one of the earliest nonlinearities is the fact that the visual response reveals considerable attenuation at higher luminance levels. Although there is considerable variation with eccentricity in retinal response, this inhomogeneity of the visual field is magnified at the cortical level because of cortical magnification. As a result, failure to maintain fixation has a more dramatic effect for cortical than retinal responses.
Knowing the stimulus is important in interpreting kernels and understanding multifocal results (Table 2). The most common implementation of the multifocal technique employs a video monitor running at 75 Hz, with a space averaged mean luminance of about 100 cd·m-2. The video frames are about 13.3 msec. Each lighted period is only a few milliseconds in duration and separated from the next frame by a dark remainder of the frame. There are several consequences of this stimulus arrangement. First, sequences that involve several lighted frames represent several sequential flashes rather than a continuous luminance onset period,138 which has implications for efforts to record scotopic ERGs139 or long-duration flash ERGs.140
Table 2. Effect of Binary Control Sequence
Adapted from Odom.136
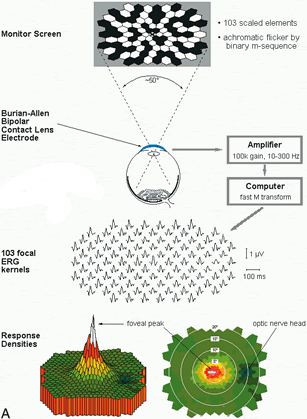
Similarly, the onset of a pattern from any stimulus other than black does not represent a response to a transition of a given mean luminance, rather the response of a pattern following a “flash” of a specified luminance. An imperfect means of overcoming this limitation is to repeat the same condition in multiple frames; one can still see the effects of the frame rate on the resulting kernels, but they more closely approximate similar standard conditions. Use of monitors also limits the range of luminances that can be employed in eliciting the mfERG or mfVEP.136 To use the pseudorandom stimulation, such as with mfERG to record truly dark-adapted ERGs or to record the equivalent of bright-flash ERGs, is difficult.139,141 Second, the fact that the mean luminance of the stimulus is in the photopic range and the frequency of stimulation is quite high suggests that the origins of the mfERG are not likely to be the same as those of the standard ERG. A number of studies appear to indicate that the origins of the mfERG are more like those of photopic fast flicker; that is, the first-order kernel involves little or no photoreceptor activity and is predominately determined by postreceptoral cells with some ganglion cell layer involvement in its generation, whereas the second-order kernel has some postreceptoral level activity and considerable inner retinal (amacrine and ganglion cell) input.142–148 To the best of our knowledge, no studies of the origins of mfERGs have occurred under conditions analogous to the standard ERG. DIFFICULTIES IN PRACTICE The uses of multifocal techniques are a trade-off between spatial resolution, recording time, and size of the signal. The finer the spatial resolution, the smaller the signal and the more recording time required. Using relatively fine resolution, as recommended in the current ISCEV guidelines (see below), one records signals that are typically in the nanovolt range using a recording time of at least 8 minutes per eye, divided into several much shorter “blocks.” Therefore, careful attention to recording details is essential. Otherwise, signals are overwhelmed by the numerous environmental and physiologic noise sources. Similarly, stable fixation is essential to obtain reliable mfERG recordings with relatively fine spatial resolution. These issues of stable fixation and small signal size may limit the utility of multifocal techniques in those who cannot be trusted to maintain stable fixation, such as children, patients with nystagmus, and malingerers. In patients with small central lesions, one can usually obtain satisfactory recordings with instructions to fixate on the center of the screen. In a few cases, it may be advisable to reduce the spatial resolution to decrease the recording time and the need for precise fixation. CURRENT ISCEV GUIDELINES FOR THE MULTIFOCAL ELECTRORETINOGRAM ISCEV approved guidelines for the basic mfERG in 2001.22 The basic mfERG is that elicited by the initial procedure implemented on the VERIS, which is the most widely known and implemented strategy. For the basic mfERG, the retina is stimulated with a device such as a cathode ray tube (CRT) with a 75-Hz frame rate that generates a pattern of hexagons scaled to approximate the distribution of cones in the retina, each of which has a 50% chance of being illuminated every time the frame changes. The default mfERG uses an m sequence to control the order of light/dark transitions of the stimulus elements. The pattern seems to flicker randomly, but each element follows a fixed, predetermined sequence so that the space- and time-averaged luminance of the screen over time is constant. The focal ERG signal associated with each element is calculated by correlating the continuous ERG signal with the on or off phases of each stimulus element. Different stimulus patterns and flicker sequences can be used for specialized applications. Figure 27 illustrates a typical multifocal setup.
The overall stimulus pattern should subtend a visual angle of 20 to 30 degrees on either side of fixation. Contrast between the lighted and darkened stimulus elements should be 90% or greater, with a mean luminance of 50 to 100 cd·m-2. The region of the CRT beyond the area of stimulus hexagons should have a luminance equal to the mean luminance of the stimulus array. Central fixation stimuli (dots or crosses) should cover as little as possible of the central stimulus element to avoid diminishing the response. Electrodes that contact the cornea are recommended for mfERG recording as for the full-field ERG. The optical opening must be clear to allow good visual acuity and refraction. The default response of the default mfERG is the first-order kernel, termed K1 or FOK. It is a biphasic wave with an initial negative deflection followed by a positive peak. A second negative deflection may occur after the peak. These three peaks are, respectively, N1, P1, and N2. The recommendations extend only to the most frequent default conditions and not to higher-order kernels. |
CLINICAL APPLICATIONS | |||||||||||
Electrophysiologic testing is most frequently used in five clinical situations: diagnosis
of retinal disease; diagnosis of optic nerve disease; determination
of organic versus functional visual loss and identifying
the locus of organic loss; determination of visual function in nonverbal
patients (mainly children); and assessing visual system
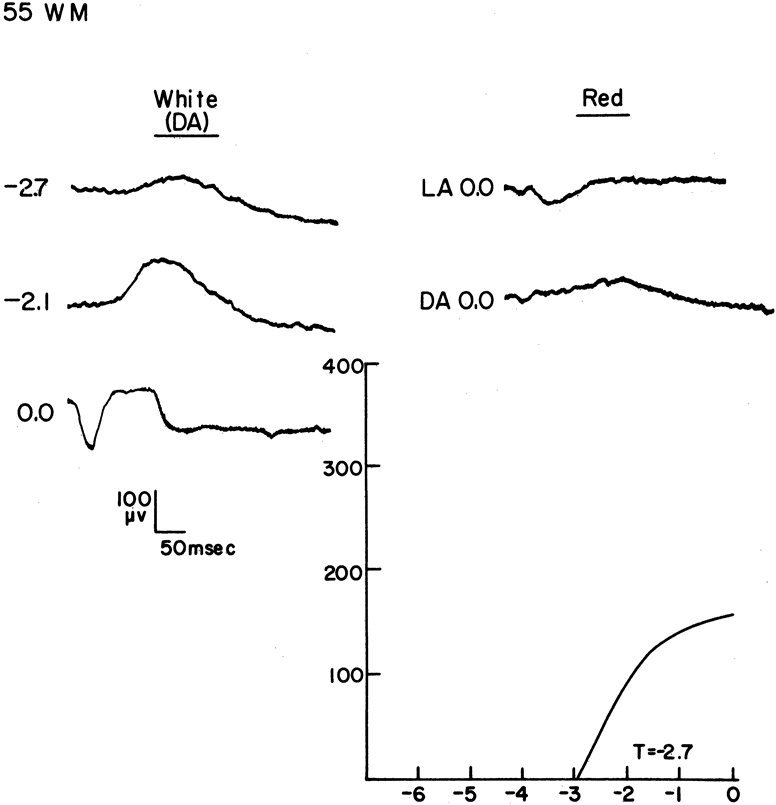
integrity behind medial opacities. DIAGNOSIS OF RETINAL DISEASE One of the most obvious applications of electroretinography is in the study of hereditary and constitutional disorders of the retina. These include partial and total color blindness (achromatopsia), night blindness, and retinal degenerations. In the past, electrophysiology diagnosed certain diseases, such as retinitis pigmentosa. Because these diseases were not treatable, electrophysiology was frequently used for diagnosis and genetic counseling. However, as our knowledge progresses, it is becoming increasingly clear that electrophysiology does not relate in a one-to-one manner with genetically defined diagnoses. In the relatively near future, many previously untreatable retinal diseases will become treatable. Correct diagnosis will then become crucial to the treatment. Diagnosis is likely to be dependent on genetic testing. This will not eliminate the need for electrophysiologic testing, however. Electrophysiology is likely to become an important initial tool in characterizing the phenotype of the disease so that appropriate genetic testing can be selected to provide a definitive, treatment-related diagnosis. Not all diseases will become treatable. Diagnosis of retinal diseases is important even though they often are untreatable. Correct diagnosis is essential for genetic counseling and for counseling patients on the likely progression of their disease. When a disorder involves primarily the rod system or primarily the cone system, the ERG shows corresponding abnormalities that may be important in counseling the patient (Fig. 28).
Nearly the first dictum to emerge with the development of clinical electroretinography was that the ERG was “extinguished” or nonrecordable in patients with retinitis pigmentosa. With improvements in recording techniques, however, small responses have often been revealed. These responses are due to the cones, which may still function even when all rod function has ceased (Fig. 29). Retinitis pigmentosa is not the only disorder in which the ERG is usually nonrecordable or greatly reduced in amplitude. Other chorioretinal degenerations or inflammations, such as choroideremia, Spielmeyer-Vogt disease, and luetic chorioretinitis, may also result in virtually complete destruction of the photoreceptors. This is also true in Leber's congenital amaurosis, which is due to dysgenesis of the rods and cones. Therefore, the nonrecordable ERG cannot be considered pathognomonic of any of these conditions, and it is not helpful in distinguishing between them. However, a consideration of the presenting symptoms and fundus appearance can usually distinguish between them.
In other degenerative states of the retina, the standard ERG may be normal; this is true in Tay-Sachs disease, in which the lesion is located in the ganglion cells. Use of the photopic negative response is too new to have proven useful in these cases. In patients with paraneoplastic disease, the on response may be significantly affected (Fig. 30).
Retinal vascular disorders may have profound effects on various ERG components. Retinal ischemia may result from many different disease processes, such as arteriosclerosis, giant cell arteritis, occlusion of a retinal artery or vein, and carotid artery insufficiency. All result in a diminished b wave and a proportionately larger a wave due to “unmasking” of the process (PIII) responsible for the a wave (Fig. 31). Changes related to the sensitivity of the dark-adapted ERG to light, such as latency of the b wave or 30-Hz flicker and the intensity that generates a half-amplitude b wave, are predictive of complications in central retinal vein occlusion. OPs are altered in diabetic retinopathy and may be a valuable predictor of proliferative changes.
Toxic states of the retina may be accompanied by ERG changes. Siderosis produces ERG responses larger than normal in its early stages; low-voltage responses are produced later in its course (Fig. 32). The ERG in patients with chalcosis does not appear to evolve through the early supernormal phase. Administration of many drugs that may produce retinal damage, such as chloroquine and quinine, results in a corresponding lowering of the ERG responses (Fig. 33). ERGs have been used to assess the extent of retinal damage in birdshot chorioretinopathy.149 In addition, measuring the initial level of functional retinal damage, ERGs may be used to monitor the need for and the effect of treatment.
Retinal detachment results in a lowered ERG response that is usually commensurate with the area of the detached retina (Fig. 34). Some evidence exists that indicates a lowered response, even in the presumably normal eye. However, it is not uncommon to find that the ERG completely “recovers” following surgical reattachment of the retina.
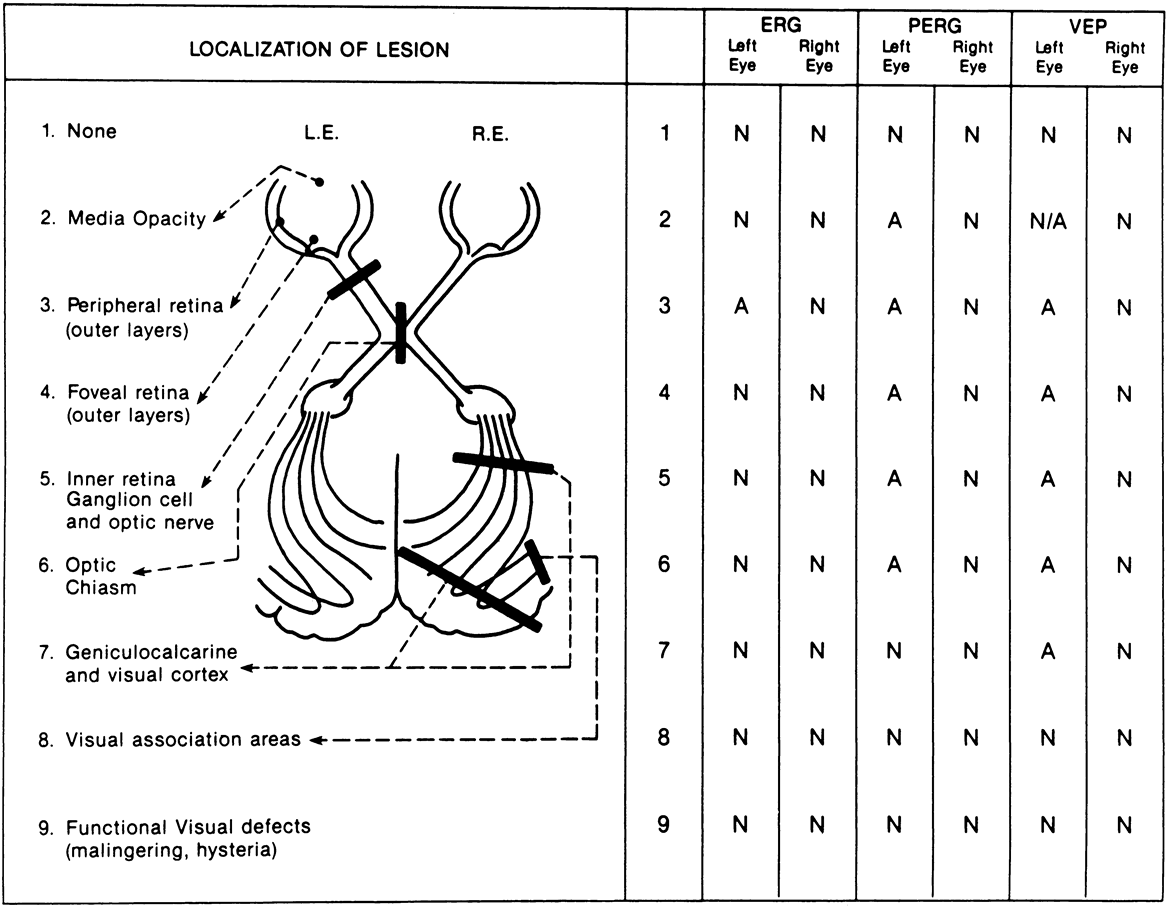
Systemic diseases associated with low-voltage ERG responses include vitamin A deficiency (in which the ERG may be restored to normal after treatment); mucopolysaccharidosis, such as Hurler's disease (in which the abnormal material is found in the outer segments of the receptor); hypothyroidism (in which altered retinal metabolism reflects that of the whole body); and the anemias (in which the lowering of the ERG is usually, but not always, proportionate to the hemoglobin level). mfERGs have begun to have their impact on retinal diseases as well. They have been used to identify subtle macular dystrophies that are not readily detected using standard ERGs and to follow the progression of more global retinal diseases. OPTIC NERVE DISEASE AND GLAUCOMA Electrophysiologic testing is used to identify a variety of optic nerve diseases, including optic nerve compression due to tumor, trauma, or subdural hematoma; optic neuritis, such as that associated with multiple sclerosis; and optic atrophy, either primary or secondary to long-standing inflammation, chronic papilledema, or toxic causes. Compressive lesions of the optic nerve, optic chiasm, and optic tract have distinct patterns of abnormality (Fig. 35). Lesions of one optic nerve alter VEPs over both hemispheres when the eye with the affected nerve is stimulated, as compared with VEPs elicited by stimulation of the other eye with the normal optic nerve. Lesions at the chiasm alter VEPs recorded from both hemispheres from both eyes (although an asymmetry may be observed). Postchiasmal lesions alter VEPs over one hemisphere compared with the other, irrespective of the eye stimulated.
In many studies, delay of the pattern reversal VEP P100 component is a useful indicator of optic nerve disease. The pattern reversal VEP is probably most useful in attempting to detect hidden visual loss in cases of suspected multiple sclerosis.150 If a patient has unilateral optic neuritis, evidence of abnormal VEPs in the normal eye indicates a subclinical lesion suggestive of multiple sclerosis. Similarly, if symptoms of multiple sclerosis are present in other neurologic systems with no history of optic neuritis, the presence of an abnormal VEP strongly suggests that a subclinical lesion of the visual pathway exists and that the patient has multiple sclerosis. Delayed-pattern VEPs are not specific for any optic neuropathy. Virtually all forms of optic neuropathy (except for acute papilledema) are associated with delays in optic nerve conduction, yielding an abnormal pattern reversal VEP. Moreover, delayed latencies are not specific to optic nerve disease. A variety of retinal disorders also produce delay of pattern reversal VEPs. Therefore, careful ophthalmoscopy should be performed to eliminate the possibility of retinal disease causing the delay. Additionally, flash, multifocal, and pattern electroretinography should be considered if the VEP is abnormal to rule out the possibility of a subclinical retinal lesion, as is sometimes observed with multiple evanescent white dot syndrome.151,152 Retinal disease or stimulus variables do not typically prolong latency to the same degree as optic nerve disease. However, lack of attention to these details adds to the variability of normal and patient values and can lead to failure to diagnose some patients with the disease (misses) and to incorrectly diagnose some patients as having optic nerve disease (false alarms). Although the clinical emphasis has often been on the use of P100 latency to detect optic nerve lesions, measuring parameters in addition to P100 latency can be useful. For example, P100 amplitude, the amplitudes and phases of steady state pattern reversal VEPs, the amplitudes of high-frequency components of transient VEPs, and the presence of an atypical waveform may be helpful in improving the sensitivity. Flash VEPs are also affected in optic nerve disease (Fig. 36).
In most optic neuropathies, flash electroretinograms are within the limits of normal because transsynaptic degeneration is extremely uncommon; even individuals with transection of the optic nerve may have normal flash ERGs many years after the incident. However, PERGs tend to be abnormal in optic neuropathy if optic nerve damage has been present for at least 3 to 6 months.153 Particularly the later negative component (N95) is affected.86–88 To the best of our knowledge, attention to the photopic negative response and the impact of optic nerve degeneration has been limited to studies of glaucoma.32–34,51 Similarly, the optic nerve head component of the mfERG has not been examined in cases other than glaucoma to our knowledge.142–145 Glaucoma is a somewhat difficult disease to categorize. However, it is clear that one of the consequences of glaucoma is ganglion cell death, especially of large-diameter fibers that project to the magnocellular layers of the lateral geniculate (i.e., M cells). Consequently, VEPs elicited by stimuli, which preferentially activate the M cells, are abnormal (e.g., rapid flicker154 or rapid reversal of low spatial frequency patterns).155 Optic neuropathy secondary to glaucoma of any type is also associated with abnormal PERGs,83,87,88,156 with N95 being more reduced in amplitude.83,87,157 Glaucoma patients also show anatomic evidence of outer retinal damage to the rods and blue cones.158,159 Electrophysiologic evidence is consistent with outer retina damage because dark-adapted flash ERGs and light-adapted flicker ERGs are abnormal (Fig. 37).57,160–162 Electrophysiologic tests currently are not included in the standard examination for glaucoma; however, as part of a battery of tests, electrophysiology may be useful in early glaucoma detection, especially in patients whose visual field tests are unreliable.163 Alternatively, efforts to make mfERG142–145,164,165 or mfVEP into viable tests of glaucoma are reasonable, as are efforts to further refine the diagnostic utility of the photopic negative response.32–34,51
ORGANIC VERSUS FUNCTIONAL VISUAL LOSS One of the most challenging problems the ophthalmologist can face is the differential diagnosis of organic versus functional visual loss in the case of the patient with minimal complaints. If the visual loss is functional, whether the patient suffers this condition because of psychiatric problems or malingering, the ophthalmologist is challenged to prove what is suspected during the history taking. The evaluation begins with careful history taking, and proceeds through a thorough neurologic, including neuro-ophthalmologic, evaluation. Ophthalmologic findings, such as pupillary responses and fundus evaluation, are critical. However, once all physical findings are determined to be normal (or cannot explain the type and degree of visual loss manifested by the patient), the logical next step is electrophysiologic testing. Both the ERG and VEP provide superb means for independent corroboration (or refutation) of a patient's symptoms. Abnormal ERG and/or VEP responses provide documentation for an abnormality in either the retina or the overall visual system, even in the absence of fundus abnormalities. Conversely, normal responses in conjunction with a fully normal examination strongly refute a patient's claims of visual disability. It is important to remember that a normal VEP in and of itself does not rule out a visual abnormality either in higher brain centers166or in the retina. Therefore, both the ERG and VEP are necessary to isolate the location of an organic defect if there is one (see Fig. 35. Addition of the mfERG, PERG, or photopic negative response may be particularly helpful in making the distinction between inner and outer retinal disease processes. Patient cooperation is essential for accurate test results. Uncooperative subjects who tamper with electrodes, refuse to maintain a steady position of head and/or body, or are otherwise noncompliant with the test procedures may leave the question unanswered. Nevertheless, such actions tend to further support the ophthalmologist's suspicions that the visual loss is functional rather than organic in nature. Standard stimuli (central visual field) and VEP recording procedures (occipital leads) are not particularly helpful in the differentiation of organic versus functional loss of a portion of the visual field. One must either use stimuli limited in the visual field and/or multiple electrodes and newer strategies of signal analysis.167 ASSESSMENT OF VISUAL FUNCTION IN NONVERBAL ADULTS AND CHILDREN The most frequent question for the ophthalmologist encountering an infant or nonverbal adult or child is whether the patient can see or recover vision. A variety of subjective tests are available to evaluate visual function in subjects that are unable to cooperate with visual sensory testing in the usual manner. For example, presentation of visual stimuli will produce responses such as blinking, head turning, cessation of random eye movements, or optokinetic nystagmus. Teller acuity cards and similar techniques have been adapted for clinical use to assess visual acuity in infants and children. However, these behavioral methods may be usefully supplemented by electrophysiolog testing. The infant or young child who appears blind or who has congenital nystagmus should be tested with flash electroretinography to determine if the disorder is in the outer retinal layers, such as in Leber's congenital amaurosis. In disorders such as optic nerve hypoplasia, which may be part of de Morsier's syndrome (together with agenesis of the corpus callosum, mental retardation, and hypopituitarism), both flash and pattern VEP should be considered. One might imagine that the various newer techniques discussed earlier—PERG, mfERG, and photopic negative response—might be of interest in pediatric cases. However, so far their use has been quite limited. PERG and mfERG techniques require greater attention on the part of the child. The photopic negative response has not been attempted with children. Flash-elicited VEPs are not useful if one is attempting to quantify visual acuity in a child with clear media, whereas pattern VEPs can provide such information. In assessing infant visual acuity, it is not sufficient to employ a single pattern size. By varying pattern element size, it is possible to assess the visual acuity of normal and neurologically impaired children.168 The difficulty of lengthy sessions can be partially overcome with the use of sweep VEPs or similar strategies (Fig. 38). Because of the variability of early neural development, absent or severely abnormal VEPs in cases of visually delayed or neurologically impaired children are not necessarily predictive of later visual development. Therefore, they must be interpreted cautiously and repeated over time.
Other important questions asked in pediatric ophthalmology are: Does this child have amblyopia? Do I need to patch? Do I need to alter patching therapy? Although several strategies related to the relative amplitude of VEPs elicited by monocular stimulation of the eyes have been proposed as means to examine the presence of amblyopia and to monitor patching therapy, they have not been widely used and have not proven themselves clinically. The better available strategy appears to be assessing visual acuity using sweep VEPs169or similar strategy.170 Finally, pediatric ophthalmologists may ask if a child has binocular vision. Several strategies have been proposed as means to examine the presence of normal binocular vision in infants and young children, including the presence of binocular summation, VEP components uniquely generated by binocular interaction, and stereo VEPs. None of the techniques has been widely used. EVALUATION OF VISUAL FUNCTION BEHIND MEDIA OPACITIES In most instances, the decision to operate in cases of corneal, lenticular, or vitreal opacities can be made without recourse to electrophysiologic testing. However, when the retina cannot be imaged, simpler techniques, such as the potential acuity meter, cannot be used. If the patient's history suggests a need for further evaluation, electrophysiologic testing may be useful in determining the functional status of the retina and later stages of visual processing. ERGs are useful in determining general retinal function, including whether the retina is attached. However, they are not particularly useful in evaluating macular function. ERG responses such as focal ERGs, mfERGs, or PERGs, which can be useful in evaluating macular function if media are clear are less useful with opaque media because the diffraction and absorption of light result in reduced certainty that appropriate stimulation is being delivered. Flash VEPs, particularly with 10-Hz stimulation, can be helpful in determining the integrity of the visual pathways and the normalcy of central retinal function.105,106 These procedures compare favorably to other methods in terms of accuracy,171,172 both in evaluating anterior105,106,173 and vitreal opacities.174,175 |
REFERENCES |
1. Carr RE, Heckenlively JR: Hereditary pigmentary degenerations of the retina. In Tasman W, Jaeger EA (eds): Clinical Ophthalmology. Philadelphia, Lippincott and Co, 1991 2. Cavender JC, Ai E: Hereditary macular dystrophies. In Tasman W, Jaeger EA (eds): Clinical Ophthalmology. Philadelphia, Lippincott and Co, 1991 3. Glaser JS, Goodwin JA: Neuro-ophthalmologic examination: The visual sensory system. In Tasman W, Jaeger EA (eds): Clinical Ophthalmology. Philadelphia, Lippincott and Co, 1991 4. Sanborn GE, Magargal LE: Arterial destructive disease of the eye. In Tasman W, Jaeger EA (eds): Clinical Ophthalmology. Philadelphia, Lippincott and Co, 1991 5. Gouras P, Charles S: Physiology of the retina. In Tasman W, Jaeger EA (eds): Clinical Ophthalmology. Philadelphia,Lippincott and Co, 1991 6. Carr RE, Siegel IM: Electrodiagnostic Testing of the Visual System: A Clinical Guide. Philadelphia, FA Davis Co, 1990 7. Fishman GA, Birch DG, Holder GE, Brigell MG: Electrodiagnostic Testing in Disorders of the Retina, Optic Nerve, and Visual Pathway. 2nd ed. San Francisco, American Academy of Ophthalmology, 2001 8. Brigell M, Celesia GG: Electrophysiological evaluation of the neuro-ophthalmology patient: An algorithm for clinical use. Semin Ophthalmol 7:65, 1991 9. Birch DG: Clinical electroretinography. Ophthalmol Clin North Am 2:469, 1989 10. Weinstein GW, Odom JV, Cavender S: Visually evoked potentials and electroretinography in neurologic evaluation. Neurol Clin 9:225, 1991 11. Heckenlively JR, Arden GB (eds.): Principles and Practice of Clinical Electrophysiology of Vision. St. Louis, Mosby–Year Book, 1991 12. Fulton AB: Intensity relations and their significance. In Heckenlively JR, Arden GB (eds): Principles and Practice of Clinical Electrophysiology of Vision. St. Louis, Mosby–Year Book, 1991 13. Weinstein GW, Weinberg RS, Hobson RR: Constant amplitude electroretinography for the determination of retinal sensitivity in normal and abnormal subjects. Am J Ophthalmol 69:836, 1970 14. Bocquet X, Charlier J, Zanlonghi X, Odom JV: A new method for recording cone electroretinogram: The fast sweep ERG. Invest Ophthalmol Vis Sci 30(Suppl):512, 1989 15. Marmor MF, Arden GB, Nilsson SEG, Zrenner E: Standards for clinical electroretinography. Arch Ophthalmol l07:8l6, 1989 16. Marmor MF, Zrenner E: Standard for clinical electroretinography (1999 update). Doc Ophthalmol 97:143, 1999 17. Marmor MF, Zrenner E: Standard for clinical electro-oculography. Doc Ophthalmol 85:115, 1993 18. Marmor MF: Standardization notice: EOG standard reapproved. Doc Ophthalmol 95:91, 1998 19. Harding GFA, Odom JV, Spileers W, Spekreijse H: Standard for visual evoked potentials. Vision Res 36:3567, 1996 20. Marmor MF, Holder GE, Porciatti V, et al: Guidelines for basic pattern electroretinography. Recommendations by the International Society for Clinical Electrophysiology of Vision. Doc Ophthalmol 91:291, 1996 21. Bach M, Hawlina M, Holder GE, et al: Standard for pattern electroretinography. Doc Ophthalmol 101:11, 2000 22. Marmor MF, Hood D, Keating D, et al: Guidelines for basic multifocal electroretinography (mfERG). Doc Ophthalmol, in press 23. Brigell M, Bach M, Barber C, et al: Guidelines for calibration of stimulus and recording parameters used in clinical electrophysiology of vision. Doc Ophthalmol 95:1, 1998 24. Galloway N, Arden G, Odom JV (committee members): Visual Electrodiagnostics: A Guide To Procedures Commissioned by the International Society for Clinical Electrophysiology of Vision (ISCEV), to assist practitioners and administrators. Web document http://www.iscev.org/standards 25. De Rouck AF: History of the electroretinogram. In Heckenlively JR, Arden GB (eds): Principles and Practice of Clinical Electrophysiology of Vision. St. Louis, Mosby–Year Book, 1991 26. Frishman L: The scotopic threshold response. In Heckenlively JR, Arden GB (eds): Principles and Practice of Clinical Electrophysiology of Vision. St. Louis, Mosby–Year Book, 1991 27. Granit R: The components of the retinal action potential and their relation to the discharge in the optic nerve. J Physiol 77:207, 1933 28. Bush RA, Sieving PA: Do photoreceptors alone contribute to the primate photopic ERG a-wave?Invest Ophthalmol Vis Sci 33:836, 1992 29. Sieving PA, Murayama K, Naarendorp F: Push-pull model of the primate photopic electroretinogram: A role for hyperpolarizing neurons in shaping the b-wave. Vis Neurosci 11:519, 1994 30. Sieving PA: Photopic ON- and OFF-pathway abnormalities in retinal dystrophies. Trans Am Ophthalmol Soc 91:701, 1993 31. Frishman LJ, Steinberg RH: Origin of negative potentials in the light-adapted ERG of cat retina. J Neurophysiol 63:1333, 1990 32. Viswanathan S, Frishman LJ, Robson JG, et al: The photopic negative response of the macaque electroretinogram: Reduction by experimental glaucoma. Invest Ophthalmol Vis Sci 40:1124, 1999 33. Viswanathan S, Frishman LJ, Robson JG, Walters JW: The photopic negative response of the flash electroretinogram in primary open angle glaucoma. Invest Ophthalmol Vis Sci 42:514, 2001 34. Colotto A, Falsini B, Salgarello T, et al: Photopic negative response of the human ERG: Losses associated with glaucomatous damage. Invest Ophthalmol Vis Sci 41:2205, 2000 35. Drasdo N, Aldebasi YH, Chiti Z, et al: The s-cone PHNR and pattern ERG in primary open angle glaucoma. Invest Ophthalmol Vis Sci 42:1266, 2001 36. Miller RF, Dowling JE: Intracellular responses of the Müller (glial) cells of mudpuppy retina: Their relation to b-wave of the electroretinogram. J Neurophysiol 33:323, 1970 37. Baron WS, Boynton RM, Hammon RW: Component analysis of the foveal local electroretinogram elicited with sinusoidal flicker. Vision Res 19:479, 1979 38. Odom JV, Reits D, Burgers N, Riemslag FCC: Flicker electroretinograms: A systems analytic approach. Optom Vis Sci 69:106, 1992 39. Bush RA, Sieving PA: Inner retinal contributions to the primate photopic fast flicker electroretinogram. J Opt Soc Am A 13:557, 1996 40. Kim SH, Bush RA, Sieving PA: Increased phase lag of the fundamental harmonic component of the 30 Hz flicker ERG in Schubert-Bornschein complete type CSNB. Vision Res 37:2471, 1997 41. Kondo M, Sieving PA: Primate photopic sine-wave flicker ERG: Vector modeling analysis of component origins using glutamate analogs. Invest Ophthalmol Vis Sci 42:305, 2001 42. Marmor MF, Jacobson SG, Foerster MH, et al: Diagnostic clinical findings of a new syndrome with night blindness, maculopathy, and enhanced S cone sensitivity. Am J Ophthalmol 110:124, 1990 43. Roman AJ, Jacobson SG: S cone-driven but not S cone-type electroretinograms in the enhanced S cone syndrome. Exp Eye Res 53:685, 1991 44. Hood DC, Cideciyan AV, Roman AJ, Jacobson SG: Enhanced S cone syndrome: Evidence for an abnormally large number of S cones. Vision Res 35:1473, 1995 45. Greenstein VC, Zaidi Q, Hood DC, et al: The enhanced S cone syndrome: An analysis of receptoral and post-receptoral changes. Vision Res 36:3711, 1996 46. Yamamoto S, Hayashi M, Takeuchi S: Electroretinograms and visual evoked potentials elicited by spectral stimuli in a patient with enhanced S-cone syndrome. Jpn J Ophthalmol 43:433, 1999 47. Marmor MF, Tan F, Sutter EE, Bearse MA Jr: Topography of cone electrophysiology in the enhanced S cone syndrome. Invest Ophthalmol Vis Sci 40:1866, 1999 48. Jacobson SG, Roman AJ, Roman MI, et al: Relatively enhanced S cone function in the Goldmann-Favre syndrome. Am J Ophthalmol 111:446, 1991 49. Kellner U, Foerster MH: Pattern of dysfunction in progressive cone dystrophies—an extended classification. Ger J Ophthalmol 2:170, 1993 50. Colotto A, Falsini B, Salgarello T, et al: Photopic negative response of the human ERG: Losses associated with glaucomatous damage. Invest Ophthalmol Vis Sci 41:2205, 2000 51. Drasdo N, Aldebasi YH, Chiti Z, et al: The s-cone PHNR and pattern ERG in primary open angle glaucoma. Invest Ophthalmol Vis Sci 42:1266, 2001 52. Severns ML, Johnson MA: The care and fitting of Naka-Rushton functions to electroretinographic intensity-response data. Doc Ophthalmol 85:135, 1993 53. Gangadhar DV, Wolf BM, Tanenbaum HL: Naka-Rushton equation parameters in electroretinogram analysis of daunomycin effects on retinal function. Doc Ophthalmol 72:61, 1989 54. Evans LS, Peachey NS, Marchese AL: Comparison of three methods of estimating the parameters of the Naka-Rushton equation. Doc Ophthalmol 84:19, 1993 55. Anastasi M, Brai M, Lauricella M, Geracitano R: Methodological aspects of the application of the Naka-Rushton equation to clinical electroretinogram. Ophthalmic Res 25:145, 1993 56. Massof RW, Wu L, Finkelstein D, et al: Properties of electroretinographic intensity-response functions in retinitis pigmentosa. Doc Ophthalmol 57:279, 1984 57. Wu LZ, Massof RW, Starr SJ: Electroretinographic intensity-response function in retinal disease. Chin Med J (Engl) 98:250, 1985 58. Sverak J, Peregrin J, Kralove H: Electroretinographic intensity-response curves in central retinal. Arch Ophthalmol 79:526, 1968 59. Hood DC, Birch DG: A quantitative measure of the electrical activity of human rod photoreceptors using electroretinography. Vis Neurosci 5:379, 1990 60. Hood C, Birch DG: The A-wave of the human electroretinogram and rod receptor function. Invest Ophthalmol Vis Sci 31:2070, 1990 61. Breton ME, Montzka DP: Empiric limits of rod photocurrent component underlying a-wave response in the electroretinogram. Doc Ophthalmol 79:337, 1992 62. Breton ME, Schueller AW, Lamb TD, Pugh EN Jr: Analysis of ERG a-wave amplification and kinetics in terms of the G-protein cascade of phototransduction. Invest Ophthalmol Vis Sci 35:295, 1994 63. Hood DC, Birch DG: Human cone receptor activity: The leading edge of the a-wave and models of receptor activity. Vis Neurosci 10:857, 1993 64. Hood DC, Birch DG: Phototransduction in human cones measured using the a-wave of the ERG. Vision Res 35:2801, 1995 65. Hood DC, Cideciyan AV, Halevy DA, Jacobson SG: Sites of disease action in a retinal dystrophy with supernormal and delayed rod electroretinogram b-waves. Vision Res 36:889, 1996 66. Hood DC, Birch DG: Abnormalities of the retinal cone system in retinitis pigmentosa. Vision Res 36:1699, 1996 67. Smith NP, Lamb TD: The a-wave of the human electroretinogram recorded with a minimally invasive technique. Vision Res 37:2943, 1997 68. Thomas MM, Lamb TD: Light adaptation and dark adaptation of human rod photoreceptors measured from the a-wave of the electroretinogram. J Physiol 518:479, 1999 69. Paupoo AA, Mahroo OA, Friedburg C, Lamb TD: Human cone photoreceptor responses measured by the electroretinogram a-wave during and after exposure to intense illumination. J Physiol 529:469, 2000 70. Friedburg C, Thomas MM, Lamb TD: Time course of the flash response of dark- and light-adapted human rod photoreceptors derived from the electroretinogram. J Physiol 534:217, 2001 71. Yoshimura Y, Onoe S, Takahashi Y, et al: Electroretinogram c-wave and slow PIII of the rabbit: Changes in peak time and amplitude under various stimulus durations. Doc Ophthalmol 69:187, 1988 72. Nagata M, Honda Y: Studies on focal electric response of the human retina. V. The effects of varying stimulus durations upon the macular response [in Japanese]. Nippon Ganka Gakkai Zasshi 74:582, 1970 73. Miyake Y, Yagasaki K, Horiguchi M, Kawase Y: On- and off-responses in photopic electroretinogram in complete and incomplete types of congenital stationary night blindness. Jpn J Ophthalmol. 31:81, 1987 74. Sieving PA: Photopic ON- and OFF-pathway abnormalities in retinal dystrophies. Trans Am Ophthalmol Soc 91:701, 1993 75. Sieving PA, Murayama K, Naarendorp F: Push-pull model of the primate photopic electroretinogram: A role for hyperpolarizing neurons in shaping the b-wave. Vis Neurosci 11:519, 1994 76. Quigley M, Roy MS, Barsoum-Homsy M, et al: On- and off-responses in the photopic electroretinogram in complete-type congenital stationary night blindness. Doc Ophthalmol 92:159, 1996 77. Alexander KR, Fishman GA, Peachey NS, et al: ‘On’ response defect in paraneoplastic night blindness with cutaneous malignant melanoma. Invest Ophthalmol Vis Sci 33:477, 1992 78. Alexander KR, Fishman GA, Barnes CS, Grover S: On-response deficit in the electroretinogram of the cone system in X-linked retinoschisis. Invest Ophthalmol Vis Sci 42:453, 2001 79. Shinoda K, Ohde H, Mashima Y, et al: On- and off-responses of the photopic electroretinograms in X-linked juvenile retinoschisis. Am J Ophthalmol 131:489, 2001 80. Odom JV, Maida TM, Dawson WW: Pattern evoked retinal responses (PERR) in human: Effects of spatial frequency, luminance and defocus. Curr Eye Res 2:99, 1982 81. Odom JV, Norcia AM: Retinal and cortical potentials: Spatial and temporal characteristics. Doc Ophthalmol Proc Ser 40:29, 1984 82. Sutter EE, Vaegan : Lateral interaction component and local luminance nonlinearities in the human pattern reversal ERG. Vision Res 30:659, 1990 83. Baker CL, Hess RR, Olsen BT, Zrenner E: Current source density analysis of linear and non-linear components of the primate electroretinogram. J Physiol 407:l55, 1988 84. Sieving PA, Steinberg RH: Contribution from proximal retina to intraretinal pattern ERG: The M-wave. Invest Ophthalmol Vis Sci 26:1642, 1985 85. Firshman LJ, Sieving PA, Steinberg RH: Contributions to the electroretinogram of currents originating in proximal retina. Vis Neurosci 1:307, 1988 86. Schuurmans RP, Berninger T: Luminance and contrast responses recorded in man and cat. Doc Ophthalmol 59:187, 1985 87. Viswanathan S, Frishman LJ, Robson JG: The uniform field and pattern ERG in macaques with experimental glaucoma; removal of spiking activity. Invest Ophthalmol Vis Sci 41:2797, 2000 88. Holder GE: The significance of abnormal pattern electroretinography in anterior visual pathway dysfunction. Br J Ophthalmol 71:166, 1987 89. Weinstein GW, Arden GB, Hitchings RA, et al: The pattern electroretinogram (PERG) in ocular hypertension and glaucoma. Arch Ophthalmol 106:923, 1988 90. Odom JV, Holder GE, Feghali JG, Cavender S: Pattern electroretinogram intrasession reliability: A two center comparison. Clin Vision Sci 7:263, 1992 91. Holder GE: Pattern electroretinography (PERG) and an integrated approach to visual pathway diagnosis. Prog Retin Eye Res 20:531, 2001 92. Reeser F, Weinstein GW, Feiock KB, Oser R: Electro-oculography as a test of retinal function: The normal and supernormal EOG. Am J Ophthalmol 70:505, 1970 93. Arden GB, Barrada A, Kelsey JH: New clinical test of retinal function based upon the standing potential of the eye. Br J Ophthalmol 46:449, 1962 94. De Rouck A, Kayembe D: A clinical procedure for the simultaneous recording of fast and slow EOG oscillations. Int Ophthalmol 3:179, 1981 95. Riemslag FCC, Verduyn Lunel HFE, Spekreijse H: The electrooculogram: A refinement of the method. Doc Ophthalmol 73:369, 1989 96. Steinberg RH, Linsenmeier RA, Griff ER: Three light-evoked responses of the retinal pigment epithelium. Vision Res 23:1315, 1983 97. Weleber RG: Fast and slow oscillations of the electro-oculogram in Best's macular dystrophy and retinitis pigmentosa. Arch Ophthalmol 107:530, 1987 98. Weinstein GW, Ward B, Hobson RR: The super-normal EOG: Evidence of light induced retinal damage?Doc Ophthalmol Proc Ser 22:77, 1973 99. Regan D: Human Brain Electrophysiology: Evoked Potentials and Evoked Magnetic Fields in Science and Medicine. New York, Elsevier, 1989 100. Previc FH: Visual evoked potentials to luminance and chromatic contrast in rhesus monkeys. Vision Res 26:1897, 1986 101. Schroeder CE, Tenke CE, Givre SJ, et al: Striate cortical contribution to the surface-recorded pattern-reversal VEP in the alert monkey. Vision Res 31:1143, 1991 102. Schroeder CE, Tenke CE, Givre SJ: Subcortical contributions to the surface-recorded flash-VEP in the awake macaque. Electroencephalogr Clin Neurophysiol 84:219, 1992 103. Schroeder CE, Mehta AD, Givre SJ: A spatiotemporal profile of visual system activation revealed by current source density analysis in the awake macaque. Cereb Cortex 8:575, 1998 104. Ossenblok P, Reits D, Spekreijse H: Analysis of striate activity underlying the pattern onset EP of children. Vision Res 32:1829, 1992 105. Moskowitz A, Sokol S: Developmental changes in the human visual system as reflected by the latency of the pattern reversal VEP. Electroencephalogr Clin Neurophysiol 56:1, 1983 106. Weinstein GW: Clinical aspects of the visually evoked potential. Trans Am Ophthalmol Soc 75:627, 1977 107. Weinstein GW: Clinical aspects of the visually evoked potential. Ophthalmic Surg 9:56, 1979 108. Spekreijse H, Estevez O, Reits D: Visual evoked potentials and the physiological analysis of visual processes in man. In Desmedt JE (ed): Visual Evoked Potentials in Man: New Developments. Oxford, Clarendon Press, 1977 109. Regan D: Speedy assessment of visual acuity in amblyopia by the evoked potential method. Ophthalmologica 175:159, 1977 110. Norcia AM, Tyler CW: Spatial frequency sweep VEP: Visual acuity during the first year of life. Vision Res 25:1399, 1985 111. Zemon V, Hartmann EE, Gordon J, Prunte-Glowazki A: An electrophysiological technique for assessment of the development of spatial vision. Optom Vis Sci 74:708, 1997 112. Regan MP, Regan D: Objective investigation of visual function using a nondestructive zoom–FFT technique for evoked potential analysis. Can J Neurol Sci 16:168, 1989 113. Zemon V, Pinkhasov E, Gordon J: Electrophysiological tests of neural models: Evidence for nonlinear binocular interactions in humans. Proc Natl Acad Sci U S A 90:2975, 1993 114. Baitch LW, Levi DM: Evidence for nonlinear binocular interactions in human visual cortex. Vision Res 28:1139, 1988. 115. Stevens JL, Berman JL, Schmeisser ET, Baker RS: Dichoptic luminance beat visual evoked potentials in the assessment of binocularity in children. J Pediatr Ophthalmol Strabismus 31:368, 1994 116. France TD, Ver Hoeve JN: VECP evidence for binocular function in infantile esotropia. J Pediatr Ophthalmol Strabismus 31:225, 1994 117. Odom JV, Chao GM: Models of binocular luminance interaction evaluated using visually evoked potential and psychophysical measures: A tribute to M. Russell Harter. Int J Neurosci 80:255, 1995 118. Suter S, Suter PS, Perrier DT, et al: Differentiation of VEP intermodulation and second harmonic components by dichoptic, monocular, and binocular stimulation. Vis Neurosci 13:1157, 1996 119. Baitch LW, Ridder WH 3rd, Harwerth RS, Smith EL 3rd: Binocular beat VEPs: Losses of cortical binocularity in monkeys reared with abnormal visual experience. Invest Ophthalmol Vis Sci 32:3096, 1991 120. Odom JV, Brown RJ, Boothe RG: Maturation of binocular luminance interaction in normal young and adult rhesus monkeys. Doc Ophthalmol 95:257, 1998 121. Porciatti V, Sartucci F: Normative data for onset VEPs to red-green and blue-yellow chromatic contrast. Clin Neurophysiol 110:772, 1999 122. Porciatti V, Di Bartolo E, Nardi N, Fiorentini A: Responses to chromatic and luminance contrast in glaucoma: a psychophysical and electrophysiological study. Vision Res 37:1975, 1997 123. Sartucci F, Murri L, Orsini C, Porciatti V: Equiluminant red-green and blue-yellow VEPs in multiple sclerosis. J Clin Neurophysiol 18:583, 2001 124. Spekreijse H, Dagnelie G, Maier J, Regan D: Flicker and movement constituents of the pattern reversal response. Vision Res 25:1297, 1985 125. Kubova Z, Kuba M, Hubacek J, Vit F: Properties of visual evoked potentials to onset of movement on a television screen. Doc Ophthalmol 75:67, 1990 126. Kuba M, Kubova Z: Visual evoked potentials specific for motion onset. Doc Ophthalmol 80:83, 1992 127. Kubova Z, Kuba M: Clinical application of motion-onset visual evoked potentials. Doc Ophthalmol 81:209, 1992 128. Bach M, Ullrich D: Motion adaptation governs the shape of motion-evoked cortical potentials. Vision Res 34:1541, 1994 129. Odom JV, De Smedt E, Van Malderen L, Spileers W: Visually evoked potentials evoked by moving unidimensional noise stimuli: Effects of contrast, spatial frequency, active electrode location, reference electrode location, and stimulus type. Doc Ophthalmol 95:315, 1998 130. Zemon V, Gordon J, Welch J: Asymmetries in ON and OFF visual pathways of humans revealed using contrast-evoked cortical potentials. Vis Neurosci 1:145, 1988 131. Harter MR: Visually evoked cortical responses to the on- and off-set of patterned light in humans. Vision Res 11:685, 1971 132. Regan D, Milner BA: Objective perimetry by evoked potential recording: Limitations. Electroencephalogr Clin Neurophysiol 44:393, 1978 133. Sutter RE: A practical nonstochastic approach to non-linear time-domain analysis. In Marmarelis VZ (ed): Advanced Methods of Physiological System Modeling. Vol 1. Los Angeles, Biomedical Simulations Resource, 1987 134. Sutter EE: Field topography of the visual evoked response. Invest Ophthalmol Vis Sci 29(suppl):432, 1988 135. Sutter EE, Dodsworth-Feldman B, Haegerstrom-Portnoy G: Simultaneous multifocal ERGs in diseased retinas. Invest Ophthalmol Vis Sci 27(suppl):300, 1986 136. Odom JV: Kernel Analysis. In Heckenlively JR, Arden GB (eds): Principles and Practice of Clinical Electrophysiology of Vision. St. Louis, Mosby–Year Book, 1991 137. Hood DC: Assessing retinal function with the multifocal technique [Review]. Prog Retin Eye Res 19:607, 2000 138. Keating D, Parks S, Evans A: Technical aspects of multifocal ERG recording. Doc Ophthalmol 100:77, 2000 139. Hood DC, Wladis EJ, Shady S, et al: Multifocal rod electroretinograms. Invest Ophthalmol Vis Sci 39:1152, 1998 140. Kondo M, Miyake Y: Assessment of local cone on- and off-pathway function using multifocal ERG technique. Doc Ophthalmol 108:139, 2000 141. Ogden TE, Larkin RM, Fender DF, et al: The use of non-linear analysis of the primate ERG to detect retinal dysfunction. Exp Eye Res 31:381, 1980 142. Hood DC, Bearse MA Jr, Sutter EE, et al: The optic nerve head component of the monkey's (Macaca mulatta) multifocal electroretinogram (mERG). Vision Res 41:2029, 2001 143. Hood DC, Bearse MA Jr, Sutter EE, et al: The optic nerve head component of the monkey's (Macaca mulatta) multifocal electroretinogram (mERG). Vision Res 41:2029, 2001 144. Hood DC, Frishman LJ, Viswanathan S, et al: Evidence for a ganglion cell contribution to the primate electroretinogram (ERG): Effects of TTX on the multifocal ERG in macaque. Vis Neurosci 16:411, 1999 145. Hood DC, Greenstein V, Frishman L, et al: Identifying inner retinal contributions to the human multifocal ERG. Vision Res 39:2285, 1999 146. Fortune B, Cull G, Wang L, et al: Factors affecting the use of multifocal electroretinography to monitor function in primate model of glaucoma. Doc Ophthalmol 105:151, 2002 147. Hare WA, Ton H: Effects of APB, PDA, and TTX on ERG responses recorded using both multifocal and conventional methods in monkey. Doc Ophthalmol 105:189, 2002 148. Viswanathan S, Frishman LJ, Robson JG: Inner-retinal contributions to the photopic sinusoidal flicker electroretinogram of macaques. Macaque photopic sinusoidal flicker ERG. Doc Ophthalmol 105:223, 2002 149. Priem HA, De Rouck AF, De Laey JJ, Bird AC: Electroretinographic studies in birdshot chorioretinopathy. Am J Ophthalmol 106:430, 1988 150. Leys M, Candaele CM, De Rouck AF, Odom JV: The detection of hidden visual loss in multiple sclerosis: A comparison of pattern reversal VEPs and contrast sensitivity. Doc Ophthalmol 77:255, 1991 151. Sieving PA, Fishman GA, Jampol LM, Pugh D: Multiple evanescent white dot syndrome. II. Electrophysiology of the photoreceptors during retinal pigment epithelial disease. Arch Ophthalmol 102:675, 1984 152. Leys A, Leys M, Jonckheere P, De Laey JJ: Multiple evanescent white dot syndrome (MEWDS). Bull Soc Belge Ophthalmol 236:97, 1990 153. Arden GB, Vaegan , Hogg CR: Clinical and experimental evidence that the pattern electroretinogram (PERG) is generated in more proximal retinal layers than the focal electroretinogram. Ann NY Acad Sci 388:580, 1982 154. Schmeisser ET, Smith TJ: High frequency flicker visual evoked potential losses in glaucoma. Ophthalmology 96:620, 1989 155. Towle VL, Moskowitz A, Sokol S, Schwartz B: The visual evoked potential in glaucoma and ocular hypertension. Effects of check size, field size and stimulation rate. Invest Ophthalmol Vis Sci 24:175, 1983 156. Trick GL: Pattern reversal retinal potentials in ocular hypertensives at high and low risk of developing glaucoma. Doc Ophthalmol 65:79, 1987 157. Odom JV, Feghali JG, Jin JC, Weinstein GW: Visual function deficits in glaucoma: Electroretinogram pattern and luminance nonlinearities. Arch Ophthalmol 108: 222, 1990 158. Millecchia LL, Nork TM, Lemley HL, Schochet TL: Regional damage to photoreceptors in human eyes with chronic glaucoma. Invest Ophthalmol Vis Sci 33:1093, 1992 159. Nork TM: Acquired color vision loss and a possible mechanism of ganglion cell death in glaucoma. Trans Am Ophthalmol Soc 98:331, 2000 160. Holopigian K, Seiple W, Mayron C, et al: Electrophysiological and psychophysical flicker sensitivity in patients with primary open-angle glaucoma and ocular hypertension. Invest Ophthalmol Vis Sci 31:1863, 1990 161. Velten IM, Korth M, Horn FK: The a-wave of the dark-adapted electroretinogram: Are photoreceptors affected. Br J Ophthalmol 85:397, 2001 162. Rosenshein JS, Cyrlin MN: Glaucoma multi-testing. Invest Ophthalmol Vis Sci 32:811, 1991 163. Bray LC, Mitchell KW, Howe JW, Gashau A: Visual function in glaucoma: a comparative evaluation of computerized static perimetry and the pattern visual evoked potential. Clin Vis Sci 7:21, 1992 164. Klistorner AI, Graham SS, Martins A: Multifocal pattern electroretinogram does not demonstrate localized field defects in glaucoma. Doc Ophthalmol 100:155, 2000 165. Hood DC, Zhang X: Multifocal ERG and VEP responses and visual fields: Comparing disease-related changes. Doc Ophthalmol 100:115, 2000 166. Bodis-Wollner I, Atkin A, Raab E, Wolkstein M: Visual association cortex and vision in man: Pattern-evoked occipital potentials in a blind boy. Science 198:629, 1977 167. Sutter EE, Tran D: The field topography of ERG components in man. I. The photopic luminance response. Vision Res 32:433, 1992 168. Odom JV: Amblyopia and clinical electrophysiology. In Heckenlively JR, Arden GB (eds): Principles and Practice of Clinical Electrophysiology of Vision. St. Louis, Mosby–Year Book, 1991 169. Gottlob I, Fendick MG, Guo S, et al: Visual acuity measurements by swept spatial frequency visual-evoked-cortical potentials (VECPs): Clinical application in children with various visual disorders. J Pediatr Ophthalmol Strabismus 27:40, 1990 170. Charlier J, Bocquet X, Zanlonghi X, et al: Analyse en temps réel des potentiels évoqués stationnaires: principes et methode. Revue Oto Neuro Ophthalmol 8:18, 1990 171. Weinstein GW, Odom JV, Hobson RR: Visual acuity and cataract. In Reinecke RD (ed): Ophthalmology Annual 1987. Norwalk, CT, Appleton-Century-Crofts, 1986 172. Odom JV, Chao GM, Weinstein GW: Preoperative prediction of postoperative visual acuity in patients with cataracts: A quantitative review. Doc Ophthalmol 70:5, 1988 173. Odom JV, Chao GM, Hobson R, Weinstein GW: Prediction of post cataract extraction visual acuity: 10 Hz visually evoked potentials. Ophthalmic Surg 19:212, 1988 174. Hutton WL, Fuller DG: Factors influencing final visual results in severely injured eyes. Am J Ophthalmol 97:715, 1984 175. Vadrevu VL, Cavender S, Odom JV: Predicting final visual acuity in diabetic eyes with vitreous hemorrhage: 10 Hz flicker VEPs. Doc Ophthalmol 79:371, 1992 |