Chapter 49
Visual Fields in Glaucoma
JODY R. PILTZ-SEYMOUR, ONECA HEATH-PHILLIP and STEPHEN M. DRANCE
Main Menu   Table Of Contents

Search

THE NORMAL VISUAL FIELD
METHODS OF MEASURING THE VISUAL FIELD
INTRODUCTION OF AUTOMATED PERIMETRY
EARLY VISUAL FIELD DEFECTS
HOW DO VISUAL FIELD DEFECTS PROGRESS?
DIFFERENTIAL DIAGNOSIS OF NERVE FIBER BUNDLE DEFECTS
AUTOMATED PERIMETRY: TESTING STRATEGIES
ACCURACY AND RELIABIILTY OF PERIMETRIC TESTING: HOW TO AVOID ARTIFACTS
IDENTIFYING THE ABNORMAL VISUAL FIELD
THE FUTURE OF PERIMETRY
REFERENCES

THE NORMAL VISUAL FIELD
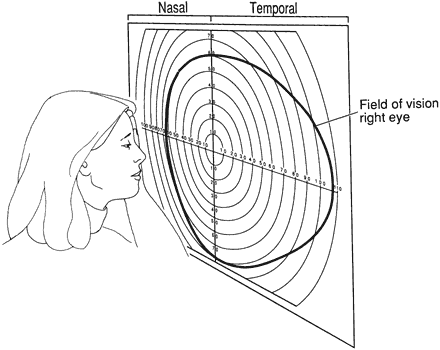
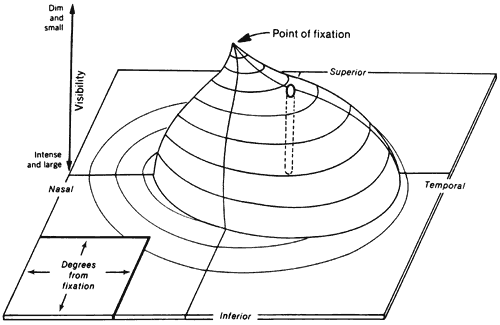
The field of vision is defined as the area that is perceived simultaneously by a fixating eye. The limits of the normal field of vision are 60 degrees into the superior field, 75 degrees into the inferior field, 110 degrees temporally, and 60 degrees nasally (Fig. 1). Traquair,1 in his classic thesis, described an island of vision in a sea of darkness (Fig. 2). The island represents the perceived field of vision, and the sea of darkness is the surrounding areas that are not seen. In the light-adapted state, the island of vision has a steep central peak that corresponds to the fovea, the area of greatest retinal sensitivity. From the peak, the island slopes downward toward the periphery, which represents regions of diminishing retinal sensitivity. The physiologic blind spot corresponds to the area of the optic nerve head. It is visualized as a deep well to sea level 15 degrees temporal to the peak of the island.

Fig. 1. Limits of the normal visual field, right eye: 60 degrees superiorly, 75 degrees inferiorly, 110 degrees temporally, and 60 degrees nasally.

Fig. 2. The normal island of vision. The hill is highest at fixation, where visual sensitivity is greatest. The height of the hill of vision declines toward the periphery as visual sensitivity diminishes. (Anderson DR: Perimetry with and without automation. 2nd ed. St Louis: CV Mosby, 1987.)

The contour of the island of vision relates to both the anatomy of the visual system and the level of retinal adaptation. The highest concentration of cones is in the fovea; most of these cones project to their own ganglion cell. This one-to-one ratio between foveal cone and ganglion cell results in maximal resolution in the fovea.

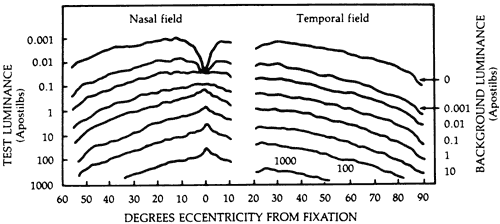
The sharp-peaked island of vision described by Traquair reflects the visual field in the light-adapted or photopic visual field. The contour of the island of vision changes greatly in the mesopic (twilight) and scotopic (dark-adapted) states. As one proceeds from a photopic to a scotopic state, overall retinal sensitivity increases as rod, rather than cone, vision predominates. In the dark-adapted island of vision, the contour is flatter than in the light-adapted state, and a central depression, rather than a central peak, exists in the area of the fovea. Thus, the level of retinal adaptation is crucial in defining the contour of the island of vision (Fig. 3).2

Fig. 3. Aulhorn's curves show the influence of background luminance on the differential light threshold. As the background luminance increases (lower curves) and the retina becomes light adapted (i.e., photopic adaptation), the overall retinal sensitivity decreases and the curve peaks centrally at the fovea. As the background luminance decreases (upper curves) and the eye becomes dark adapted (i.e., scotopic adaptation), overall retinal sensitivity increases and the curves develop a central depression. (Lynn JR, Fellman RL, Starita RJ: Exploring the normal visual field. In Ritch R, Shields MD, Krupin T [eds]: The Glaucomas. Vol 1. St Louis: CV Mosby, 1989.)

Back to Top
METHODS OF MEASURING THE VISUAL FIELD

KINETIC PERIMETRY

In kinetic perimetry, a stimulus is moved from a nonseeing area of the visual field to a seeing area along a set meridian. The procedure is repeated with the use of the same stimulus along other meridians, usually spaced every 15 degrees. In kinetic perimetry, one attempts to find locations in the visual field of equal retinal sensitivity. By joining these areas of equal sensitivity, an isopter is defined. The luminance and the size of the target are changed to plot other isopters. In kinetic perimetry, the island of vision is approached horizontally. Isopters may be considered the outline of horizontal slices of the island of vision (Fig. 4).3

Fig. 4. In kinetic perimetry, a stimulus of set size and intensity is moved from nonseeing to seeing areas of the visual field. The island of vision is approached horizontally, and isopters, depicting areas of equal retinal sensitivity, are plotted.

STATIC PERIMETRY

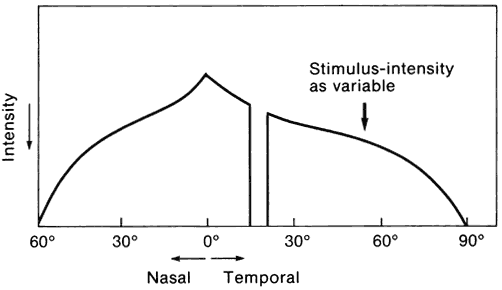
In static perimetry, the size and location of the test target remain constant. Retinal sensitivity at a specific location is determined by varying the brightness of the test target. The shape of the island is defined by repeating the threshold measurement at various locations in the field of vision (Fig. 5).

Fig. 5. In static perimetry, the intensity of a stationary target of constant size is varied to determine the sensitivity of specific locations in the field of vision.

MANUAL PERIMETRY: THE GOLDMANN VISUAL FIELD

The Goldmann perimeter is the most widely used instrument for manual perimetry. It is a calibrated bowl projection instrument with a background intensity of 31.5 apostilbs (asb), which is well within the photopic range. The size and intensity of targets may be varied to plot different isopters kinetically and determine local static thresholds.4

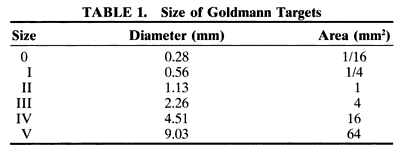
The stimuli used to plot an isopter are identified by a roman numeral, a number, and a letter. The roman numeral represents the size of the object, from Goldmann size 0 (1/16 mm2) to Goldmann size V (64 mm2) (Table 1). Each size increment equals a twofold increase in diameter and a fourfold increase in area.


The number and letter represent the intensity of the stimulus. A change of one number represents a 5-dB (0.5 log unit) change in intensity, and each letter represents a 1-dB (0.1 log unit) change in intensity (Table 2). The dynamic range of the Goldmann perimeter from the smallest/dimmest target (Ola) to the largest/brightest target (V4e) is greater than 4 log units, or a 10,000-fold change.


More than 100 combinations of size and intensity are available, but only a few isopters are needed to define the visual field. Size 0 generally is omitted because results of the plots are inconsistent.

The fine-intensity filter is usually set to the letter e, which eliminates the small-increment light filters.

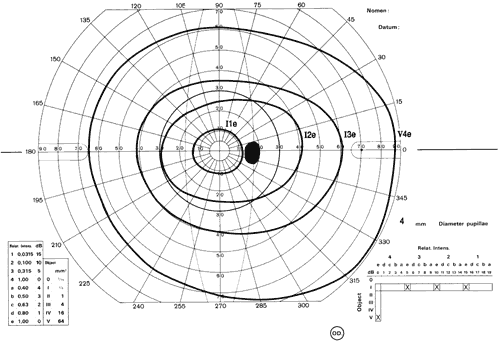
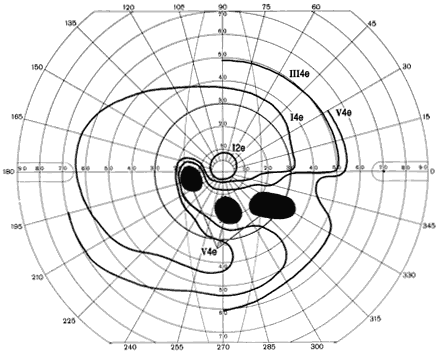
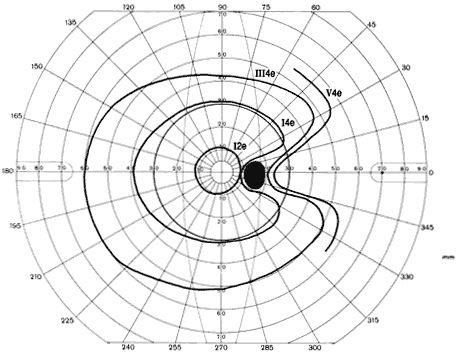
A change of one number of intensity is roughly equivalent to a change of one roman numeral of size. Isopters in which the sum of the roman numeral (size) and number (intensity) are equal can be considered equivalent. For example, the I4e isopter is roughly equivalent to the II3e isopter. The equivalent isopter combination with the smallest target size is usually preferred because detection of isopter edges is more accurate with smaller targets. One usually starts by plotting small targets with dim intensity (I1e) and then by increasing the intensityof the target until it is maximal before increasingthe size of the target. The usual progression thenis I1e→I2e→I3e→I4e→II4e→III4e→IV4e→V4e (Fig. 6).

Fig. 6. Standard isopters on the Goldmann perimeter for the right eye of a normal 43-year-old patient. The roman numeral identifies the stimulus size, and the arabic numeral and letter identify the stimulus intensity.

In addition to plotting isopters kinetically, static suprathreshold and threshold testing can be performed manually. After an isopter has been plotted, the stimulus used to plot the isopter is used to test statically within the isopter to look for localized defects. In this way, it acts as a suprathreshold stimulus. Static thresholds also can be determined along set meridians to obtain profile plots of the visual field, but like any multiple thresholding task, it is time consuming.

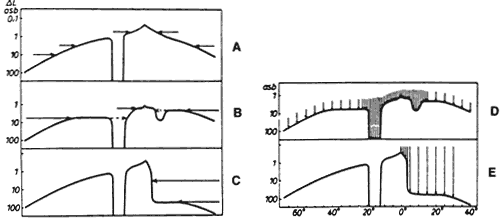
Manual kinetic perimetry allows fast, flexible, comprehensive evaluation of the entire visual field. However, shallow scotomas can be missed and isopters may be hard to define if the slope of the island of vision is not steep (Fig. 7). The quality of the field test is highly dependent on the skill of the perimetrist. Results from different perimetrists can vary greatly.

Fig. 7. Comparison of static and kinetic perimetry to detect shallow scotomas and determine the slope of the scotoma. A. Kinetic evaluation can clearly outline the normal visual field. B. Kinetic perimetry may miss shallow scotomas and poorly define the flat slope seen nasally. C. The edge of steeply sloped scotomas may be identified easily with kinetic perimetry, but the steepness of the slope may not be appreciated. D and E. Static perimetry readily detects shallow scotomas and can define the slope of both shallow and steep scotomas. (Aulhorn E, Harms H: Early visual field defects in glaucoma. In Leydecker W [ed]: Glaucoma Symposium. Basel: Karger, 1966.)

Back to Top
INTRODUCTION OF AUTOMATED PERIMETRY
Introduction of computers and automation heralded a new era in perimetric testing. Static testing can be performed in an objective and standardized fashion with minimal perimetrist bias. A quantitative representation of the visual field can be obtained more rapidly than with manual testing. The computer allows stimuli to be presented in a pseudorandom, unpredictable fashion. Patients do not know where the next stimulus will appear, so fixation is improved, thereby increasing reliability of the test. Random presentations also increase the speed with which perimetry can be performed by bypassing the problem of local retinal adaptation, which requires a 2-second interval between stimuli if adjacent locations are tested.

Computerized static perimetry provides an estimate of the reliability and variability of the test. Data storage is possible, and computer-assisted statistical analysis is available.5

The most widely used automated perimeters are manufactured by Humphrey Instruments. Other perimeters also provide comparable thresholding tests; testing strategies and statistical analyses vary between instruments. Most automated perimeters perform a wide variety of programs so that examinations can be tailored to the needs of individual patients.

DIFFERENTIAL LIGHT THRESHOLD

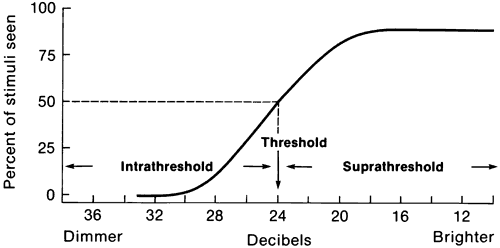
Static computerized perimetry measures retinal sensitivity at predetermined locations in the visual field. These perimeters measure the eye's ability to detect a difference in contrast between a test target and the background luminance. The differential light threshold is designated as the dimmest target seen 50% of the time. Suprathreshold stimuli are brighter than threshold stimuli, and they are seen more than 50% of the time. Infrathreshold stimuli are dimmer than threshold stimuli are seen less than 50% of the time.

Threshold at a specific retinal location can be measured directly from a frequency-of-seeing curve, which is generated by testing one retinal location multiple times with different stimulus intensities. The frequency-of-seeing curve is the graph of the percentage of stimuli seen at each intensity level. Threshold is read from the graph at the 50th percentile (Fig. 8).

Fig. 8. Frequency of seeing curve. Stimuli of varying intensities are presented multiple times at one retinal location. Threshold is designated as the dimmest stimulus seen 50% of the time.

Unfortunately, it is impractical to perform frequency-of-seeing curves at the large number of locations required to assess the visual field accurately for glaucomatous damage. Therefore, different perimeters use various strategies to estimate threshold. These strategies are described later in this chapter under Automated Perimetry: Testing Strategies: Threshold Programs.

APOSTILBS AND DECIBELS

In perimetry, luminance of test targets is measured in apostilbs. An apostilb is an absolute unit of luminance that is equal to 0.3183 candela/m2, or 0.1 millilambert.

The decibel scale is a relative scale created by the manufacturers of automated perimeters to measure the sensitivity of the island of vision. It is an inverted logarithmic scale. Zero decibels is set as the brightest stimulus that the perimeter itself can produce. The decibel scale is not standardized because the maximal luminance varies between instruments.

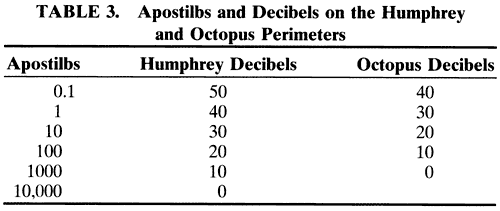
Table 3 shows the relationship between apostilbs and decibels in the Humphrey and Octopus perimeters. Zero decibels corresponds to 1000 asb in the Octopus perimeter and 10,000 asb in the Humphrey Field Analyzer (HFA). A change of 10 dB equals a 1 log unit or tenfold change in intensity, and 1 dB is equivalent to 0.1 log unit.


Does a threshold of zero mean that the patient is blind at that location? Not necessarily. It simply means that the patient was not able to distinguish the brightest spot that the machine projected from the background luminance.

SENSITIVITY VERSUS THRESHOLD

As one ascends the hill of vision toward the fovea, the sensitivity of the retina increases, dimmer targets become visible, and the brightness of the target at threshold decreases. Therefore, as retinal sensitivity increases, the differential light threshold measured in apostilbs decreases. This inverse relationship between retinal sensitivity and threshold holds true throughout most of visual psychophysics. In automated perimetry, however, threshold is recorded in the inverted decibel scale, and dimmer targets have higher decibel values. Therefore, threshold in decibels is directly proportional to retinal sensitivity.

GLAUCOMATOUS VISUAL FIELD DEFECTS

Any clinically or statistically significant deviation from the normal shape of the hill of vision can be considered a visual field defect. The classic glaucomatous defect is a localized scotoma that conforms to nerve fiber bundle patterns. Diffuse depressions of the visual field are also commonly seen in glaucomatous eyes, but often cannot be distinguished from other, nonglaucomatous causes.

LOCALIZED NERVE FIBER BUNDLE DEFECTS

Localized visual field defects in glaucoma result from damage to the retinal nerve fiber bundles. Because of the unique anatomy of the retinal nerve fiber layer, axonal damage causes characteristic patterns of visual field damage.

Anatomy of the Nerve Fiber Layer

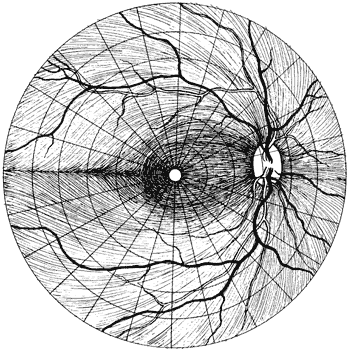
The nerve fiber layer of the retina is composed of ganglion cell axons that course from the ganglion cell body to the optic nerve head in a distinctive pattern (Fig. 9). The optic nerve lies 15 degrees nasal and slightly superior to the fovea. The retina temporal to the fovea is divided into superior and inferior halves by the horizontal raphe. Axons that originate in the superior half of the temporal retina arch above the fovea, whereas those that originate inferior to the raphe arch below the fovea. These arching temporal fibers form the arcuate nerve fiber bundles and enter the optic nerve head at the superior and inferior poles.6

Fig. 9. The retinal nerve fiber layer in the right eye. Damage to localized bundles of nerve fibers result in characteristic patterns of visual field loss in glaucoma. (Harrington DO, Drake MV: The Visual Fields: Textbook and Atlas of Clinical Perimetry. St Louis: CV Mosby, 1990.)

The papillomacular fibers from the central retina and the fibers from the nasal retina course directly from their cell bodies to the disc.

Nerve Fiber Bundle Defects

The superior and inferior poles of the optic nerve head are most vulnerable to glaucomatous damage. It has been postulated that these areas may be watershed areas at the junction of the vascular supply from adjacent ciliary vessels.7 Ultrastructural examination of the lamina cribrosa shows that the pores in the superotemporal and inferotemporal areas are larger. These larger pores may make these regions more vulnerable to compression.8

Damage to the inferior and superior poles of the nerve results in loss of the arcuate nerve fiber bundles. The resulting visual field defect types include paracentral, arcuate, and nasal step. The inferior pole of the optic nerve appears to be more vulnerable to damage than the superior poles, so that defects occur more commonly in the superior half of the visual field.

PARACENTRAL DEFECTS.

Circumscribed paracentral defects are an early sign of localized glaucomatous damage. These defects may be absolute when first discovered, or they may have deep nuclei surrounded by areas of less dense involvement. The dense nuclei often are numerous along the course of the nerve fiber bundle (Fig. 10). A relative disturbance often can be traced between a dense paracentral scotoma and the blind spot; it may vary in extent, but it shows the true arcuate nature of the scotoma. Paracentral defects often lie closer to fixation when they occur in the superior hemifield.

Fig. 10. Multiple dense paracentral defects in an arcuate nerve fiber bundle distribution.

ARCUATE SCOTOMAS.

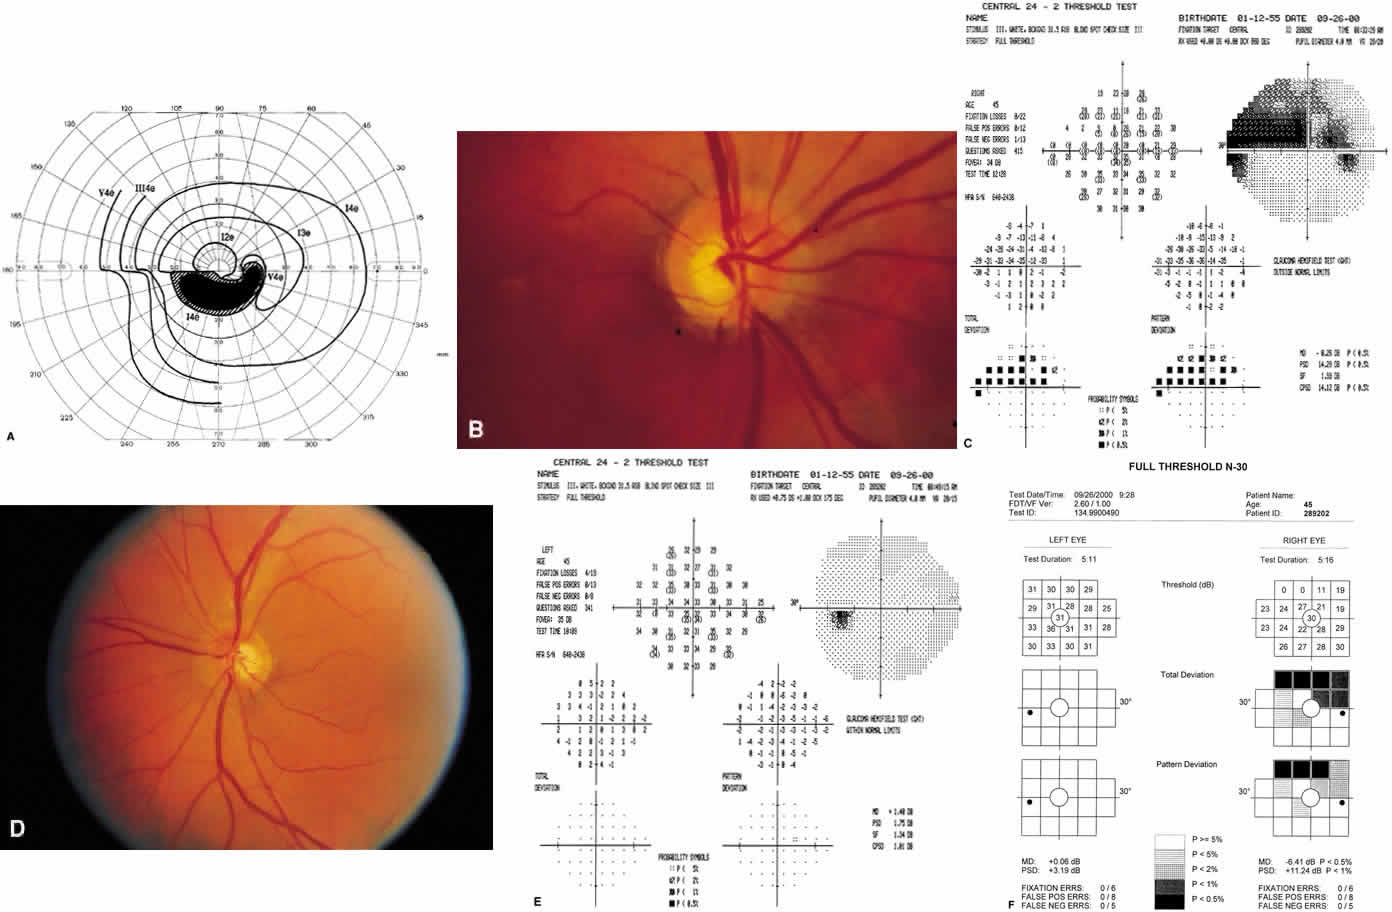
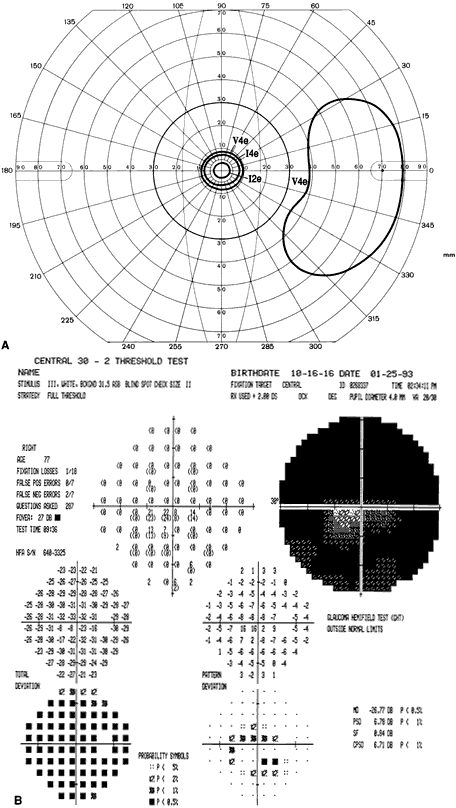
More advanced loss of arcuate nerve fibers leads to a scotoma that starts at or near the blind spot, arches around the point of fixation, and terminates abruptly at the nasal horizontal meridian (Fig. 11). An arcuate scotoma may be relative or absolute. In the temporal portion of the field, it is narrow because all of the nerve fiber bundles converge onto the optic nerve. The scotoma spreads out on the nasal side and may be very wide along the horizontal meridian. Arcuate scotomas may develop closer to fixation in myopes.

Fig. 11. Arcuate and nasal step defects. A. Goldmann kinetic perimetry. B. Right optic nerve with inferior notch. C. The corresponding full threshold visual field of the right eye with superior defect. D. Left optic nerve of the same patient with intact neural rim with inferior disc hemorrhage and early nerve fiber layer defect. E. The corresponding full threshold field did not pick up the early defect in the left eye. F. Frequency doubling technology field testing. Superior defect detected in the right eye. The early nerve fiber layer defect was not detected in the left eye.

NASAL STEP DEFECTS.

Because of the anatomy of the horizontal raphe, all complete arcuate scotomas end at the nasal horizontal meridian. A steplike defect along the horizontal meridian results from asymmetric loss of nerve fiber bundles in the superior and inferior hemifields.

Nasal step defects may be evident in some isopters but not in others, depending on which nerve fiber bundles have been damaged. The width of the nasal step also varies. Nasal steps frequently occur in association with arcuate and paracentral scotomas, but a nasal step also may occur in isolation. Approximately 7% of initial visual field defects are peripheral nasal step defects.

TEMPORAL WEDGE-SHAPED DEFECTS.

Damage to nerve fibers on the nasal side of the optic disc may result in temporal wedge-shaped defects (Fig. 12). These defects are much less common than defects in the arcuate distribution. Occasionally, they are seen as the sole visual field defect. Temporal wedge defects do not respect the horizontal meridian.

Fig. 12. Temporal wedge defect.

Back to Top
EARLY VISUAL FIELD DEFECTS
The appearance of a discrete, localized visual field defect may be preceded by inconsistent or fluctuating responses in that area.9,10 Initial localized visual field defects may be either relative or absolute. In 35 eyes with previously normal visual fields, Werner and Drance10 found that the earliest defects were paracentral scotomas with a nasal step (51%), isolated paracentral defects (26%), isolated nasal steps (20%), and sector defects (3%). Hart and Becker11 found the following initial visual field defects in 98 eyes: nasal steps (54%), paracentral or arcuate scotomas (41%), arcuate blind spot enlargement (30%), isolated arcuate scotomas separated from the blind spot (20%), and temporal defects (3%).

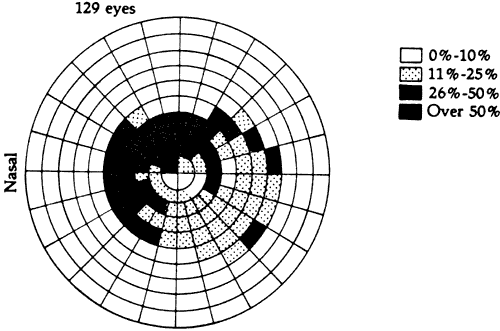
Phelps and colleagues12 reported the location of localized visual field defects in eyes with chronic open-angle glaucoma whose maximum intraocular pressure ranged from 22 to 34 mm Hg (Fig. 13). The superior field was involved more often than the inferior visual field, and the nasal periphery frequently was affected.

Fig. 13. Frequency distribution of visual field defects in eyes with chronic open-angle glaucoma. Maximum intraocular pressures ranged between 22 and 34 mm Hg. (Lynn JR, Fellman RL, Starita RJ: Exploring the normal visual field. In Ritch R, Shields MD, Krupin T [eds]: The Glaucomas. Vol 1. St Louis: CV Mosby, 1989.)

BLIND SPOT CHANGES

Enlargement

Vertical elongation of the blind spot may occur with the development of a Siedel's scotoma, an early arcuate defect that connects with the blind spot. β-Peripapillary atrophy, which frequently accompanies glaucomatous damage, particularly in elderly patients, also may cause enlargement of the blind spot.

Baring

Baring of the blind spot may be physiologic or pathologic. Physiologic baring of the blind spot is an artifact of kinetic perimetry. The inferior retina is less sensitive than the superior retina, so an isopter plotted at threshold in the inferior central retina may result in superior baring of the blind spot. Physiologic baring of the blind spot usually is confined to a single central isopter in the superior visual field (Fig. 14).

Fig. 14. Physiologic superior baring of the blind spot usually is limited to a single central isopter.

END-STAGE DEFECTS

In eyes with advanced glaucomatous damage, arcuate fibers are lost, leaving only papillomacular and nasal fibers. The typical visual field in advanced glaucoma shows preservation of a small central island of vision and a larger temporal island of vision (Fig. 15).

Fig. 15. A. A visual field exhibiting end-stage defects. Only a small central island and a temporal island of vision remain. B. Endstage visual field defect on 30-2. Advanced defects may cause the pattern deviation plot not to appear grossly abnormal. This artifact occurs when there are fewer than eight points with measurable thresholds and is the result of the statistical processing of the pattern deviation plots.

DIFFUSE DEPRESSION

Diffuse depression of the visual field results from an overall or widespread sinking of the island of vision and may reflect diffuse loss of nerve fibers of the retina. Diffuse depression is a nonspecific sign that can be caused by many etiologies other than glaucoma. By far the most common reason for a diffuse depression is lens opacity. Other factors include other media opacities, miosis, improper refraction, ocular anomalies, age and patient fatigue, inattentiveness or inexperience with the examination. It is difficult to attribute diffuse depression specifically to a glaucomatous process.

Hart and Becker12 found that of eyes that had localized visual field defects, 31% had constriction of the central isopters. Piltz and associates13 used automated perimetry and found that approximately 50% of eyes with localized visual field defects had generalized depression in the absence of lens opacity. They noted that it was rare to identify purely diffuse glaucomatous visual field loss in the absence of localized defects. Of 91 patients with chronic open-angle glaucoma, only two had purely diffuse visual field loss.13 Diffuse depression of the visual field is not commonly seen as the only sign of glaucoma, but diffuse loss often occurs in conjunction with localized visual field defects.

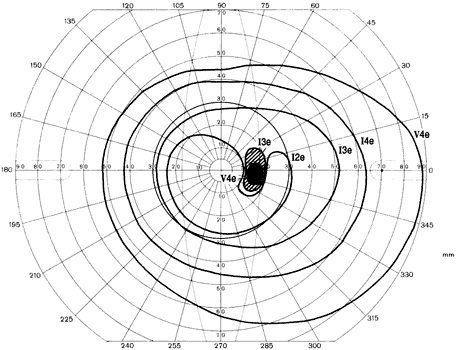
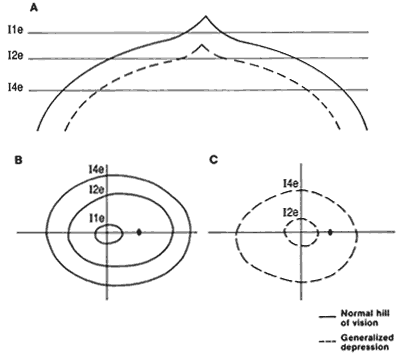
In manual perimetry, diffuse depression is manifested by contraction of the isopters. The isopters retain their normal contour. The most central isopters may disappear entirely as the peak of the island of vision sinks (Fig. 16).

Fig. 16. Diffuse visual field depression: manual kinetic perimetry. A. Profile plot showing a normal and depressed hill of vision. B. Isopter plot of the normal hill of vision. C. Isopter plot of a depressed hill of vision. Note the loss of the Ile isopter and the inward shifting of the 12e and 14e isopters in the field with generalized depression.

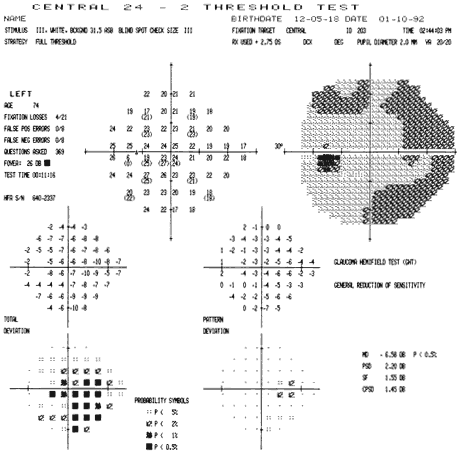
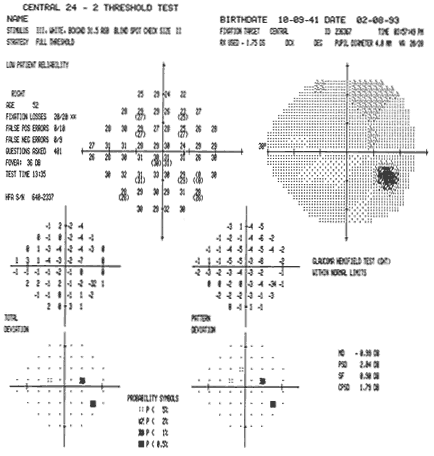
In automated perimetry, diffuse depression results in relative defects across the entire visual field (Fig. 17). Early diffuse depression often is difficult to detect because thresholds may remain within the normal range, but they may be depressed from previous examinations or the baseline status.

Fig. 17. Diffuse visual field depression: automated perimetry. Mild relative defects are seen across the visual field. Many probability symbols are seen in the total deviation map, and few probability symbols are seen in the pattern deviation map. The glaucoma hemifield test reports a generalized reduction in sensitivity. The mean deviation is flagged as significantly abnormal, and the corrected pattern standard deviation is within normal limits.

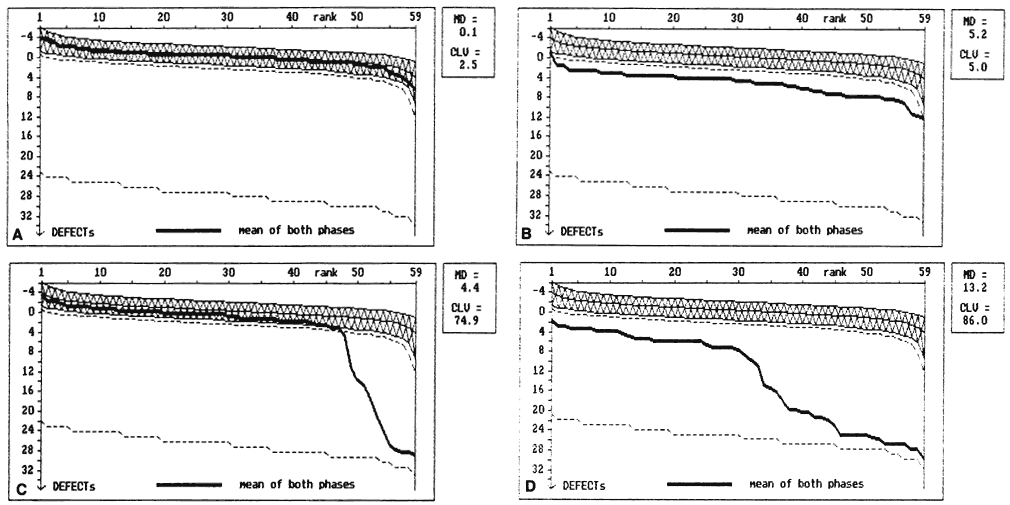
The use of Bebie curves or cumulative defect curves14 has greatly facilitated the identification of diffuse visual field loss (Fig. 18). At each location in the visual field, the measured threshold is subtracted from the expected normal threshold for that point. This value is called the defect. The Bebie curve is simply a graphic ranking of the defects from least to greatest defect. The Bebie curve for a given patient can be interpreted in light of the confidence intervals plotted.14

Fig. 18. Bebie curves. Bebie, or cumulative defect, curves are useful in detecting diffuse depression of the visual field. The curve is a graphic ranking of the defect (the difference between the measured threshold and the age-corrected normal threshold) for each point in the visual field. The x axis represents the rank of the defect from smallest (left side) to largest (right side). The y axis represents the magnitude of the defect. The normal range, between the 5th and 95th percentiles, is shaded. A. A normal Bebie curve. The curve lies completely within the normal shaded area. B. The Bebie curve of a patient with diffuse damage. The Bebie curve is shifted inferiorly, but parallels the normal range. C. The Bebie curve of a patient with purely localized damage. Most of the curve falls within the normal range; however, a sharp decline is measurable at the higher ranks. D. An example of combined localized and diffuse damage. The entire curve is depressed below normal range. The left side parallels the normal range and represents the diffuse loss. The decline on the right side represents the superimposed localized damage. (Courtesy of Balwantray C. Chauhan, PhD.).

If the Bebie curve is evenly depressed below the 95th percentile, depression of the visual field is generalized. If only the right side of the curve is depressed, visual field loss is localized. If the whole curve is depressed but in an uneven fashion, both localized and diffuse loss is present. Although they are useful in identifying the type of visual field loss present, Bebie curves cannot distinguish between glaucomatous and nonglaucomatous causes of localized or diffuse visual field loss.

Back to Top
HOW DO VISUAL FIELD DEFECTS PROGRESS?
Despite control of intraocular pressure, many eyes with glaucoma exhibit progression of visual field defects over time. Most eyes exhibit an increase in the density of the scotoma, and approximately 50% exhibit an increase in scotoma size or the appearance of a new scotoma.15 Progression of defects may occur in episodic bursts intermixed with stable periods of varying duration. If only one hemifield is involved, the defects remain localized to that hemifield for extended periods in 60% to 75% of eyes. Progression often occurs more rapidly when both hemifields are involved.12 The mean level of intra-ocular pressure does not differentiate glaucoma patients with progressive visual field loss from ones who remained stable.16
Back to Top
DIFFERENTIAL DIAGNOSIS OF NERVE FIBER BUNDLE DEFECTS
Arcuate nerve fiber bundle defects can be caused by pathologic conditions other than glaucoma, as shown in Table 4.17


Back to Top
AUTOMATED PERIMETRY: TESTING STRATEGIES

SCREENING PROGRAMS

Screening tests can quickly identify abnormal visual fields and provide information about the location of defects. Multiple-level tests also provide some data about the depth of defects. Shallow, subtle defects and early generalized depression may be missed by screening tests.

Single-Level Suprathreshold Test

A stimulus that is 2 to 6 dB brighter (suprathreshold) than the expected hill of vision is used to test multiple locations in the visual field. Results are recorded simply as seen (normal) or not seen (defect). On the Humphrey perimeter, this is called the threshold-related strategy.

Two-Level Suprathreshold Test

These tests often are referred to as three-zone screening tests because the visual field is classified into three categories: normal, relative defect, and absolute defect.

As in the single-level test, testing is performed initially with a mildly suprathreshold stimuli approximately 2 to 6 dB brighter than the expected threshold. Spots that are seen recorded as normal. If a spot is not seen, the brightest stimulus available for the apparatus is presented. If the brightest target is seen, a relative defect is recorded. If the brightest target is not seen, an absolute defect is recorded.

One-Level Suprathreshold Screen

With Quantification of Defects A one-level suprathreshold screen is performed. Then, thresholds are measured at the locations that are determined to be abnormal. Because defects within 6 dB of the expected hill of vision will not be identified, shallow defects and early progressive depression of the visual field may be missed. The test can be very time consuming if many points in the field of vision are abnormal.

THRESHOLD PROGRAMS

Most patients with glaucoma should undergo tests that measure the differential light threshold throughout the central 24 to 30 degrees. The following strategies are the most useful strategies on the HFA.18

Full Threshold

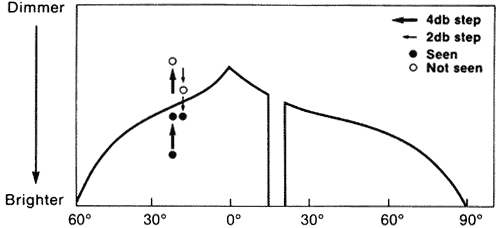
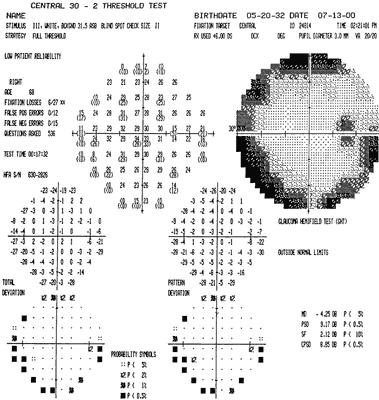
The full threshold strategy has been the most accurate way of evaluating and following the glaucomatous visual field, however, it is also the most time-consuming method (Fig. 19). The differential light threshold is determined at every point in the visual field using a 4-2 staircase or bracketing algorithm. In the 4-2 algorithm, testing starts with either a suprathreshold (seen) or an infrathreshold (not seen) stimulus. For a suprathreshold stimulus, the intensity of the stimulus is decreased in 4-dB steps until the stimulus is no longer seen (threshold is crossed). The stimulus intensity is then increased in 2-dB steps until the threshold is crossed a second and the stimulus is seen again (Fig. 20). The Humphrey perimeter uses the intensity of the last seen stimulus as threshold.

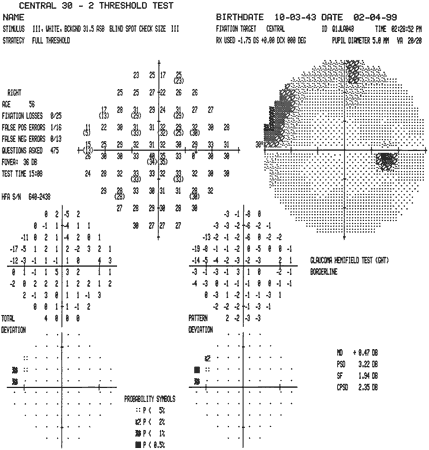
Fig. 19. A full thresholding examination of the central visual field using Humphrey program 30-2. An early superior nasal step defect is seen.

Fig. 20. The 4-2 bracketing strategy to determine threshold. Thestimulus intensity is varied so that threshold is crossed twice, first using 4-dB steps and then 2-dB steps. In this example, the initial stimulus presented was seen. The stimulus intensity was decreased by 4 dB. The second stimulus was also seen, so the intensity again was decreased by 4 dB. The third stimulus crossed the threshold (first crossing) and was not seen. The stimulus intensity was increased by 2 dB. The fourth stimulus was not seen, so the intensity was increased by 2 dB. The fifth stimulus crossed the threshold (second crossing) and was seen. Threshold is either the intensity of the last seen stimulus (Humphrey Field Analyzer) or the average of the last seen and unseen stimulus (Octopus). The profile of the hill of vision is represented by the threshold at each location.

How can test time be minimized? The closer the initial stimulus is to the actual threshold, the faster the test will be completed. Humphrey perimeters use a “region growing” technique to determine the starting level for each point. After testing the fovea and blind-spot location, threshold is measured at one point in each quadrant. The threshold level measured at these four cardinal points determines the stimulus intensity used to start testing adjacent. On the Humphrey perimeter, if thresholds are more than 5 dB from expected values, the location is retested. The second result is printed below the first in parentheses.

Fastpac

The differential light threshold is determined at every point in the visual field; however, the 4-2 bracketing strategy is not used. Instead, threshold is measured using 3-dB steps, and the threshold is crossed one time only. Fastpac examination variability was found to be independent of defect depth when analyzed on the basis of pattern deviation probability values and to be independent of the area of visual field loss.19

Swedish Interactive Threshold Algorithm

This new thresholding strategy is particularly useful because it decreases test time by about half. In a given time period, Swedish Interactive Threshold Algorithm (SITA)-Standard and SITA-Fast collect twice as much information as the Humphrey Full Threshold and the FastPac respectively. Testing of each location is started at a level that is near threshold, which shortens the time spent searching for the threshold.20 The time interval between responses is customized to each patient's reaction time. SITA calculates false-positive and false-negative catch trials from the threshold measurements, eliminating the need for separate testing of the false catch trials; this accounts for 6% of the decrease in test time in comparison to the full threshold strategy.

SITA uses artificial intelligence and computer modeling, incorporating probability models of normal and glaucomatous visual fields to provide more efficient testing of the visual field. Testing is interactive, using each response from a patient to help predict future responses. Information incorporated in the interactive testing includes comparison to reference fields in normal and glaucomatous eyes, normal age-corrected threshold values, patterns of glaucomatous damage, and multiple frequency of seeing curves in normal and abnormal states. At the end of the test, the threshold is recalculated based on all the available data. The time interval for each response is analyzed and those responses that were likely false are discarded.

The program estimates the threshold expected at each point on a continuous basis and stops testing when the estimated error is less than a predetermined value. The confidence limit is narrower for SITA standard than SITA fast, which is why SITA standard takes longer. The lower error in the SITA standard test decreases the variability of the examination and makes SITA standard more reliable than SITA fast for future comparisons.21

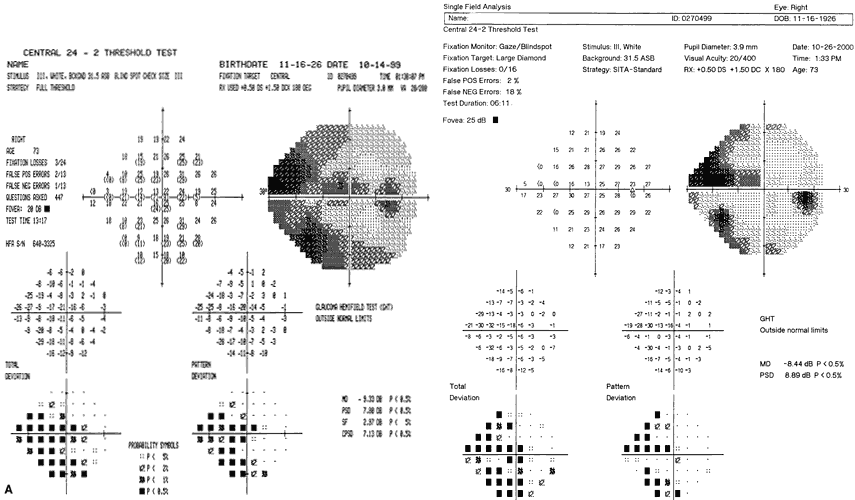
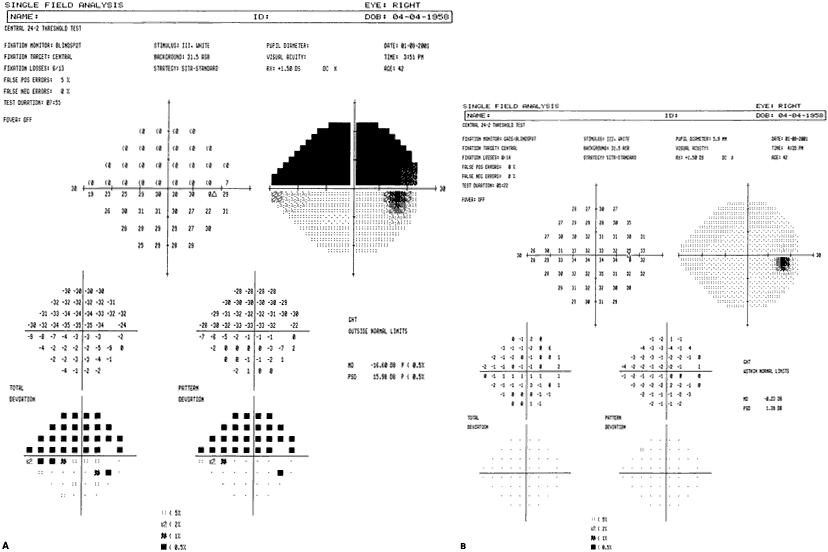
It is thought that SITA-Standard is at least comparable in repeatability to full threshold strategies. However, threshold values from full threshold and SITA standard tests are not directly comparable; defects appear shallower with SITA, which may in part reflect diminished patient fatigue. Software is currently under development to aid in the comparison of multiple tests from the two strategies (Fig 21).

Fig. 21. Comparison of full threshold with Swedish Interactive Threshold Algorithm (SITA)-Standard testing strategy, Humphrey program 24-2. Thresholds are typically lower and defects may appear more dense on full threshold compared with SITA-Standard. A. Full threshold strategy using Humphrey program 24-2. B. SITA-Standard strategy.

Short-Wavelength Automated Perimetry

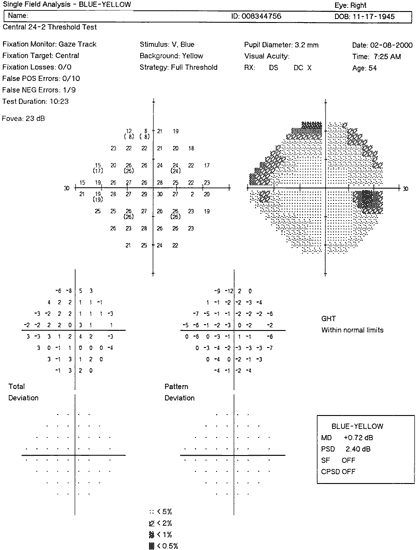
Short-wavelength automated perimetry (SWAP) is a static threshold perimetry test in which a blue stimulus (440 nm) is presented on a background of yellow illumination.20 The yellow background desensitizes the green and red cones, whereas the blue stimulus activates the blue cones. Overall, the blue cones and their ganglion cell connections are tested. SWAP detected glaucomatous field defects at a significantly earlier time than white-on-white perimetry and revealed a faster rate of progression.22 One concern is that the variability between testing sessions is greater using SWAP.23 It is unclear whether the success of SWAP in detecting early defects relates to identifying preferential damage to the blue/yellow cone system, or whether the testing of only a subset of the visual system enables earlier detection even if the damage is not selective.

SWAP testing takes 15% longer than full threshold testing. The blue cone system is slower and patients report that the test seems different. Even experienced field takers may not do well on their first SWAP test and may exhibit a learning effect between the first and second tests. The test is greatly affected by cataract. A size V stimulus is required (Fig. 22).

Fig. 22. Normal short wavelength automated perimetry (SWAP; blue on yellow) in a glaucoma suspect. SWAP perimetry may detect defects earlier than white-on-white perimetry.

The gray scale is not useful in interpreting SWAP visual fields; SWAPac on the Humphrey is required to correctly interpret the data.

Frequency Doubling Technology

Frequency doubling technology (FDT) tests the magnocellular pathway. These large diameter fibers make up about 3% to 5% of retinal ganglion cells. Full threshold FDT tests can be completed in less than 6 minutes per eye, and suprathreshold screening can be completed within 1 minute. Results are significantly correlated to testing done using the HFA20 (Figs. 23 to 25).

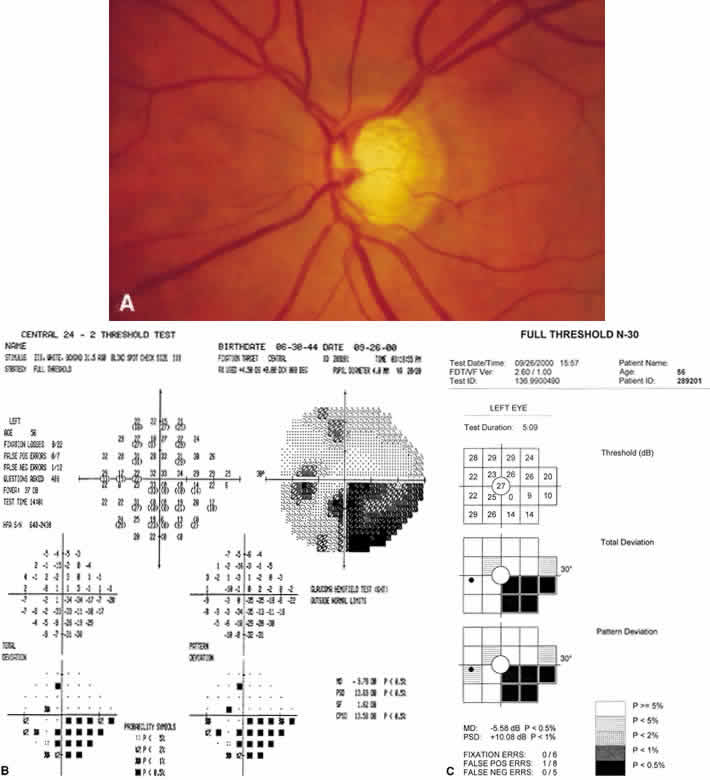
Fig. 23. Full threshold perimetry and frequency doubling technology. A. Disc photo of the left eye demonstrating a superior notch with inferior thinning. Both Humphrey visual field (B) and frequency doubling technology field (C) show predominantly inferior defects.

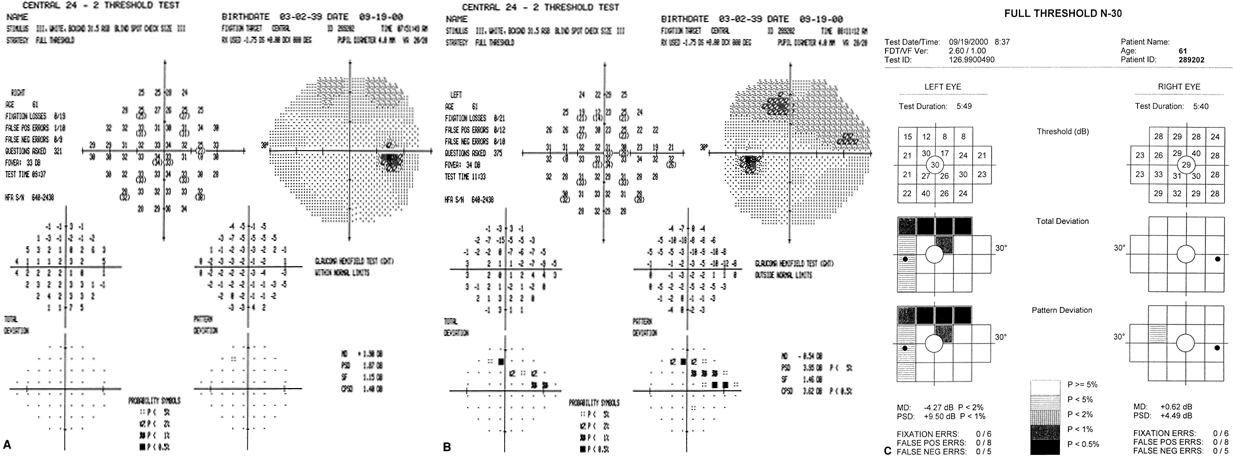
Fig. 24. Full threshold perimetry and frequency doubling technology. A. Right eye visual field that is relatively full. B. Left eye visual field with early arcuate and superior nasal step. C. Frequency doubling technology (FDT) fields of both right and left eyes. Note the excellent correlation between the two instruments. The FDT detected the defect in the left eye although it is early.

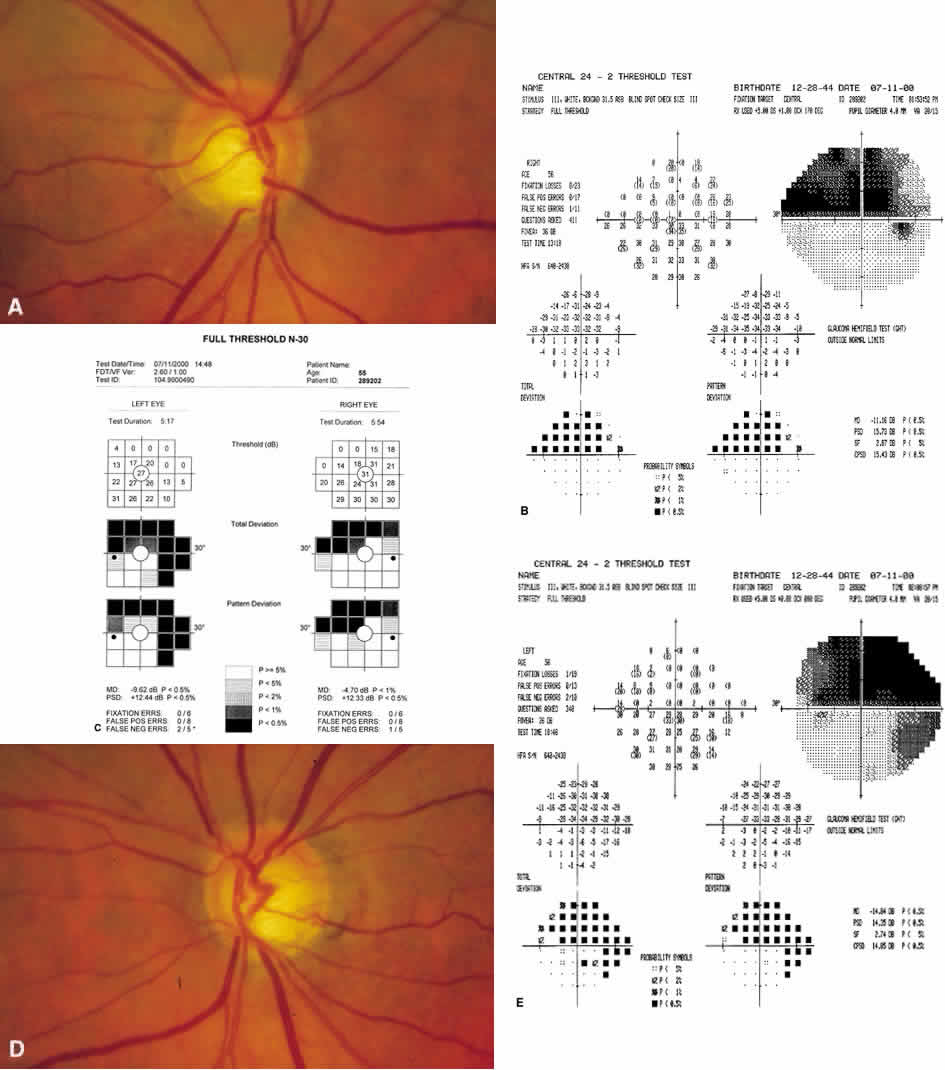
Fig. 25. A. Fundus photograph of right optic nerve. Note an inferior notch. Corresponding superior visual field defect on Humphrey Field Analyzer (HFA; B) andfrequency doubling technology (FDT; C). D. Left optic nerve with inferior notch and superior thinning. E. Visual fields of the left eye show a larger defect in the superior than inferior hemifield on both HFA and FDT.

In FDT perimetry, 17 regions are tested within the central 20 degrees of the visual field. Each stimulus is a series of black and white bands that flicker at 25 Hz. A normal eye perceives the illusion of twice the number of bands more closely spaced. Glaucomatous eyes have diminished contrast sensitivity as a result of preferential damage to the My cells and they thus require higher contrast to detect the frequency doubling illusion.24 FDT has been found to have up to 97% sensitivity and specificity for detecting glaucomatous defects.25

EVALUATING THE PATIENT WITH GLAUCOMA

Deciding which visual field test to order must be made on a case-by-case basis. The central 24 degrees or 30 degrees automated field test is the most useful test in most glaucoma patients, but it is not necessarily appropriate or ideal for every patient.

Central Thresholding Programs

Most field testing should concentrate in regions known to be defective. In glaucoma, most defects occur within the central 30 degrees. Defects respect the horizontal meridian, so that routine central programs have test locations positioned on either side of the horizontal meridian rather than on the meridian itself. Commonly used programs for glaucoma are the Humphrey models 24-2 and 30-2. A Humphrey program 30-2 is shown in Figure 19 and a program 24-2 is shown in Figure 17. These programs test the central 24 degrees or 30 degrees with 6 degrees of separation between locations. Humphreyprogram 24-2 eliminates the most peripheral ring of test locations from program 30-2, except in the nasal step region. This is advantageous because the peripheral ring of thresholds provides the least reliable data, and testing time can be shortened. Full threshold or SITA standard strategies can be used with either the Humphrey 24-2 or 30-2 programs.

Thresholding programs are essential for accurately detecting glaucomatous visual field defects and following patients for progressive damage. Thresholding programs can detect early diffuse depressions of the visual field. Thresholding programs can detect changes in scotoma depth, which is the most common mode of progression. Thresholding programs also permit calculation of the short-term fluctuation, which facilitates the interpretation of field defects. Full threshold or SITA standard canbe used. SITA standard has virtually replaced Fast-pac because it provides more reliable data in a shorter time.

Central 10 Degrees

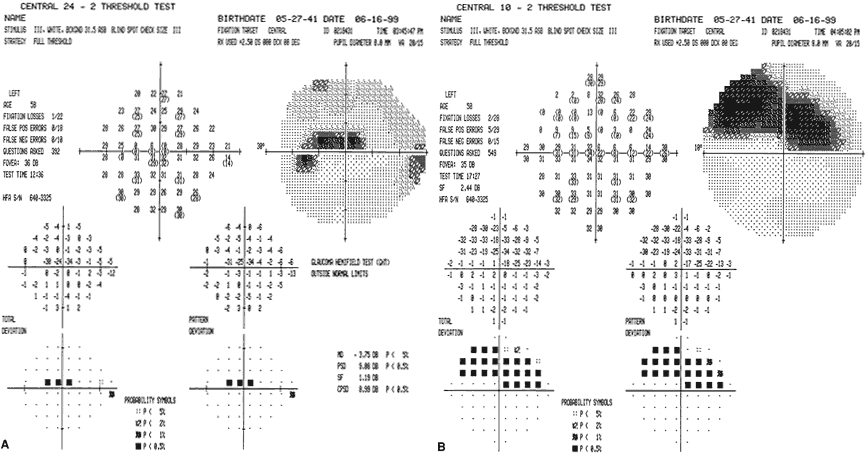
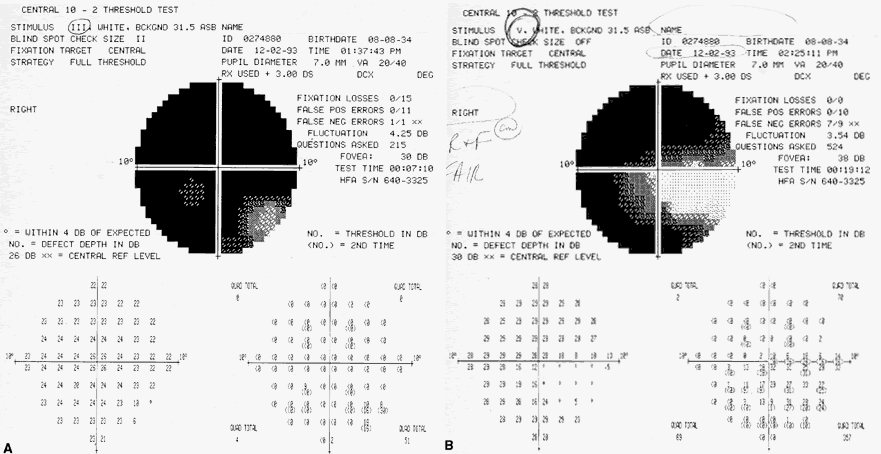
A program such as the Humphrey 10-2 that uses tightly spaced locations in the central 10 degrees is preferable to a 24- or 30-degree program in two situations. If a localized defect is detected within 10 degrees of fixation on a standard central test, a 10-degree program can help determine how close to fixation the defect extends (Fig. 26). If the patient has advanced defects, a small central island can be tested with a 10-degree program; the higher resolution provides more data points for follow-up and patient anxiety can be reduced by limiting testing to seeing areas.

Fig. 26. A. Program 24-2 with localized defects near fixation. B. Program 10-2 in the same eye. The central 10-degree program helps to define how close the defect is to fixation.

Size V Target

If there are advanced visual field defects with dense or absolute scotomas, the size of the target can be increased. Increasing target size increases spatial summation and may provide more data points to follow (Fig. 27). Typically, a size V stimulus is used in these cases.26,27

Fig. 27. Using a size V results in increased thresholds and allows more points to be followed. A. Program 10-2 using size III target. B. Program 10-2 using size V target in the same eye.

Screening Tests

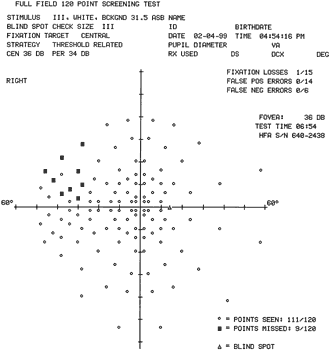
Screening programs are less useful now that SITA fast can provide rapid threshold estimates throughout the central 30 degrees. When testing outside of 30 degrees, a full field screener can be useful (Fig. 28).

Fig. 28. Screening programs, such as the Humphrey Field Analyzer full-field 120-point screening test, can help acquaint patients with perimetry while providing an initial overall assessment of the visual field status. They may also be useful in identifying visual field defects that fall outside of the central 30 degrees. This test shows the peripheral extension of the superior nasal step defect from the same eye as the 30-2 test in Figure 19.

Peripheral Programs

If the central visual field is normal in a patient suspected of having glaucoma, testing of the midperi-pheral visual field can be considered. About 2% to 11% of initial glaucomatous defects may occur outside of the central 30 degrees region.28 Both Octopus and Humphrey perimeters have screening and threshold examinations that include the area between 30 degrees and 60 degrees. Goldmann manual perimetry and automated full field screeners can also be used to test the peripheral visual field. Humphrey also has a short program that tests for nasal step defects along the peripheral nasal meridian.

Goldmann Manual Perimetry

Manual perimetry should not be overlooked, even though many automated programs are available. Manual perimetry is valuable for many patients who need repeated encouragement and rapid assessment.

Short-Wavelength Automated Perimetry

Short-wavelength automated perimetry testing is most useful in trying to detect early glaucomatousvisual field defects not detected by standard white-on-white perimetry.

Frequency Doubling Technology

Frequency doubling technology provides reliable, accurate measurement of the central 20 degrees. Patients do not seem to mind the test as much as standard perimetry. FDT will probably be used more commonly as the technology becomes more widespread.

Back to Top
ACCURACY AND RELIABIILTY OF PERIMETRIC TESTING: HOW TO AVOID ARTIFACTS
The purpose of perimetry is twofold: to identify an abnormality and to follow defects for progression over time. Both tasks require accurate perimetric technique to produce reliable fields.

Visual field defects may reflect glaucomatous abnormalities or manifest an artifact of the testing process. To distinguish artifact from true defect, it is important to understand the source of these potential artifacts and recognize the characteristic patterns of error. Standardization of the various equipment and patient variables is essential to produce accurate and consistent fields.

PATIENT VARIABLES

Uncorrected Refractive Errors

Uncorrected refractive errors cause defocusing of the test target and apparent depression of retinal sensitivity. Each diopter of uncorrected refraction causes a 1.26-dB depression of retinal sensitivity.29,30The proper near-add refraction, as determined by the patient's age and the diameter of the perimeter's cupola, must be used. Of note, the newer HFA II perimeter has a smaller, aspheric bowl in comparison to the HFA I's spheric bowl. The near-add must be adjusted accordingly. The near-add calculation is built into the perimeter's software.

Lens Rim Artifacts

If the eye is not centered in the corrective lens, an artifactual scotoma from the lens rim may be present. Alternatively, if the patient's head moves away from the lens, the rim can again obstruct the peripheral visual field (Fig. 29). Only corrective lenses with a large optic and thin rim should be used.

Fig. 29. Lens rim artifact. There are dense defects present in contiguous locations in the peripheral ring of test points.

Small Pupil Artifact

The amount of light that enters the eye is proportional to the pupillary area. Testing with pupillary diameters of less than 2.5 mm may result in generalized depression of the visual field by decreasing the light incident on the retina and by increasing diffraction at the pupillary margin. These factors may artifactually simulate the development or progression of glaucomatous visual field defects. Pupil diameters greater than 2.5 mm are not prone to small pupil artifact; however, the highly dilated pupils may exhibit mild peripheral distortions.

Cataracts and Other Media Opacities

Media opacities, such as cataracts, can cause generalized depression of the visual field. As cataracts become more dense, visual field defects may appear to worsen. It is important to check for changing acuity, worsening of cataracts, and other media opacities when analyzing visual fields for progression.31,32

Facial Structure

Ptosis of the upper lid is a common cause of depression of the superior visual field. Similarly, prominent facial features, such as a large nose or an overhanging brow, can lead to artifactual visual field defects. These defects can be minimized by proper placement of the patient at the perimeter or by taping of the upper lid (Fig. 30).

Fig. 30. A. Central 24-2 field of a patient with right upper lid ptosis. Note the superior defect. B. Repeat 24-2 field of the same patient with the right upper lid taped up. The superior defect has disappeared.

Learning Curve

A clear learning curve exists for perimetry. The learning effect is greatest between the first and second tests. It usually has little effect after the second examination. For this reason, a patient's first visual field should be interpreted with caution and should not be used as the sole baseline for future comparisons.33 SWAP seems to have a distinct learning curve even among experienced field takers.

Fatigue

Patient fatigue from prolonged testing may lead to decreased retinal sensitivity. Often, fatigue is the limiting factor when an attempt is made to increase accuracy by increasing test time.34,35 The SITA tests help diminish the effect of fatigue by decreasing test duration.

Psychological Factors

Proper instruction is essential to obtain reliable visual field results. Patients must be reassured that it is normal not to see many of the lights, that the background or fixation target may appear to change, and that they must continually fixate at the central target. It is comforting for patients to know that they can rest if necessary during the examination. Patient comfort, cooperation, and level of motivation strongly influence the differential light threshold. Stress, fear, and poor concentration can impair the accuracy and reliability of the examination.

Why do patients hate perimetry? If a visual field is done in an efficient manner, most of the test will be performed with stimuli at or near threshold. Threshold is defined as the stimulus intensity seen 50% of the time. This means that during most of the test, the stimuli are so dim that patients are not sure whether they see the target. SITA is tolerated somewhat better because it uses an interactive strategy to determine the brightness of test stimuli and because test time is significantly decreased. FDT also seems to be better tolerated by patients.

ASSESSING RELIABILlTY

False-Positive Catch Trials

In full threshold perimetry, a sound cue is given before each stimulus is presented. Periodically, the sound cue is given but no test stimulus is presented. A false-positive result occurs if the patient responds to the sound cue alone. SITA calculates a false-positive rate by analyzing the test results throughout the examination.

Elevated false-positive catch trials are the most important indicator of an unreliable visual field. Tests with high false-positive results often have abnormally high threshold values seen on the numeric plots; “white scotomas” on the gray scale and the glaucoma hemifield test will list “abnormally high sensitivity” (Fig. 31). The only useful place for these fields is in the trash.

Fig. 31. High false-positive results produce a “superfield.” There are characteristic falsely elevated threshold measurements, “white scotomas” on the gray scale, and many probability symbols in the pattern deviation map with a normal total deviation map.

False-positive results can be decreased by reexplaining the testing to the patient. Explain to the patients that they cannot respond fast enough to actually press the button while the spot is illuminated, and that the faster they respond, the faster the next spot is presented. Encourage them not to rush, but to let the spot flash on and off, and to press the button only if a spot was seen. This advice often helps minimize the problem of elevated numbers of false-positive results.

False-Negative Catch Trials

In full threshold perimetry, a false-negative catch trial is recorded if a patient does not respond to a brighter stimulus than had previously been seen at that location earlier in the examination. As with false-positive results, SITA calculates false-negative results by analyzing the test results throughout the examination. A high number of false-negative catch trials may indicate patient inattentiveness and an unreliable visual field. Alternatively, false-negative responses may indicate that the visual field is pathologic.

The false-negative response rate is higher in eyes with extensive visual field defects than in those with normal visual fields.35,36 If the location at the edge of a dense scotoma is tested, small changes in fixation can cause the location to shift in and out of the scotoma. As a result, a false-negative response may occur. Increased short-term fluctuation and fatigue may increase the false-negative rate in patients who have early glaucomatous damage. In the presence of reliable fixation, elevation of the false-negative rate may not necessarily mean that a field is unreliable; it may simply indicate that the field is abnormal.37 The method SITA uses to determine false-negatives may improve its ability to act as a reliability indicator, rather than a measure of glaucoma damage.

Fixation Losses

Steady fixation is crucial to the production of accurate visual fields. Fixation is improved by minimizing stimulus duration and testing at random sites throughout the visual field.

The HFA I and II have a video device that allows the perimetrist to monitor the patient's fixation. HFA use the Heijl-Krakau method of determining fixation losses. After the fovea is tested at the beginning of the test, an attempt is made to locate the blind-spot. Stimuli are presented in the usual location for the blind-spot. If these stimuli are seen (i.e., did not fall into the patient's blind-spot), the blind-spot is then mapped. Periodically during the test, stimuli are presented within the previously located or mapped blind-spot. If the patient sees the stimulus, it is considered fixation loss (Fig. 32). This system is not continuous, and it cannot edit out unreliable presentations.18

Fig. 32. Fixation was not changed from the diamond target used to test the fovea to the central target used for the remainder of the test. There is inferior displacement of the blind spot and 20 of 20 fixation losses.

The HFA II uses an eye tracker to monitor fixation. Examples of tracings from the eye tracker are presented in Figures 22 and 33.

Fig. 33. Poor eye-tracker tracing with high false-positive results and high fixation losses.

The Goldmann perimeter uses a telescope to monitor fixation. In general, technicians are more likely to follow fixation with a video monitor than with a telescope.

Short-Term Fluctuations

In kinetic perimetry, the isopter edge varies somewhat when retested multiple times. This variability is called scatter. In static perimetry, repeated threshold measurements at a single location vary and cause fluctuation of threshold responses. A fluctua-tion of measured thresholds within a visual field examination is called short-term fluctuation. A fluctuation of measured thresholds between examinations is called long-term fluctuation.

Short-term fluctuation is calculated by the Humphrey and Octopus thresholding programs. It iscalculated from the variance of multiple readings performed at selected locations in the visual field. In a normal visual field, short-term fluctuation is between 1 and 2 dB; fluctuations greater than 2 dB may indicate poor reliability.

In some cases, elevation of the short-term fluctuation may reflect glaucomatous damage rather than poor patient reliability.9,38 Short-term fluctuation may be elevated as an early sign of glaucomatous damage, even in the face of an otherwise normal visual field.10 Short-term fluctuation is higher in disturbed visual fields.

Long-term fluctuations generally are larger than short-term fluctuations, and they are increased in pathologic visual fields.39,40 Long-term fluctuations are more difficult to measure, and standard printouts do not include a value for them.

Back to Top
IDENTIFYING THE ABNORMAL VISUAL FIELD
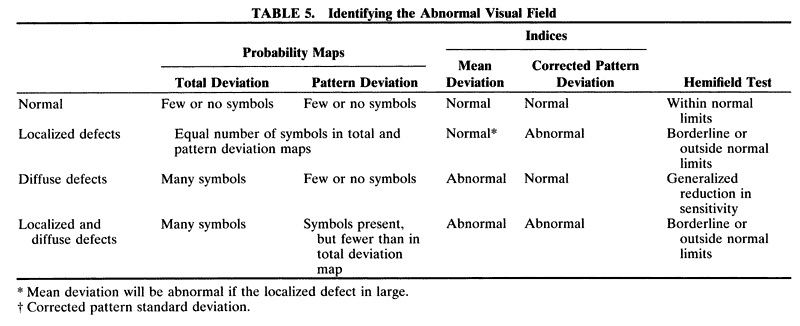
No generally accepted standards exists to determine whether a visual field is normal or abnormal. Visual field interpretation requires the use of judgment with a knowledge of the variables that contribute to perimetry, the expected patterns of loss, and the expected fluctuations of responses. Generally, a composite of the following methods can be used (Table 5).


NUMERIC PRINTOUTS

Even if a sophisticated data analysis program is used, one should always inspect the numeric printout. Gray scales provide only a semiquantitative assessment of the visual field, with interpolated values printed between tested points, and they are insufficient for full analysis. Most programs present numeric data in two forms: the actual thresholds plot and the difference plot. The actual thresholds plot shows the differential light sensitivity at each location measured. The numbers in the difference plot represent the difference between the measured threshold and the age-corrected normal value for each point in the visual field.

Statistically, a few isolated points that deviate more than 4 dB from values for age-matched controls can occur in a normal visual field without necessarily indicating an abnormality. A defect is more likely to represent an abnormality when a large number of contiguous points are involved, the depression is dense, and the defect is reproducible on subsequent perimetry. Defects are more likely to represent a glaucomatous abnormality if they fit into a known nerve fiber bundle pattern. Points at the edge of the test area (rim points) may be abnormal in otherwise normal visual fields and may not indicate glaucomatous damage. Testing of the peripheral visual field may allow one to differentiate a peripheral artifact from a true visual field defect.

The difference plot detects deviations from age-matched controls, but they occasionally may miss early subtle defects, particularly if the baseline retinal sensitivities for a patient are greater than average. Therefore, raw threshold plots should be scrutinized for shallow defects by looking for small clusters of points that are surrounded by points of higher thresholds. Particular attention should be given to the paracentral and nasal step regions.

PROBABILITY PLOTS

Humphrey Statpac software provides two types of numeric difference plots: the total deviation plot and the pattern deviation plot, each with a corresponding probability map (Fig. 34). The pattern deviation plot highlights localized defects by correcting for diffuse changes in the hill of vision. The probability plots for both the total and pattern deviation maps indicate the statistical significance of the deviation for each point tested. The darker the symbol, the less likely it is that a point depressed by that amount would occur in a normal population.41,42

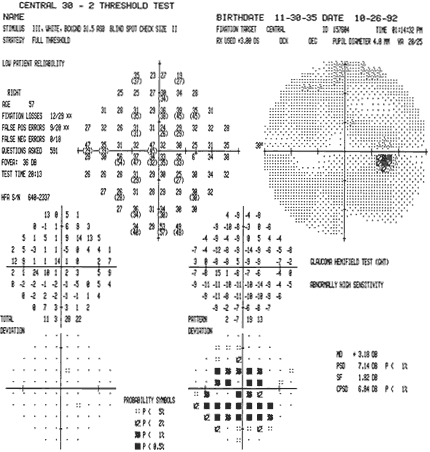
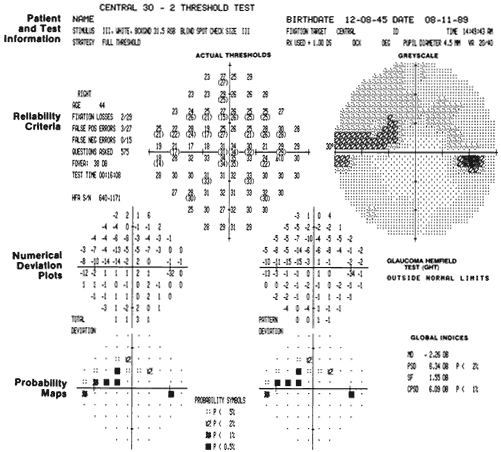
Fig. 34. Statpac printout for Humphrey program 30-2. The actual threshold plot and the corresponding gray scale are shown at the top. Below on the left is the total deviation plot with its probability map. Below on the right is the pattern deviation plot with its probability map. The total deviation maps display all defects from age-corrected normal values. The pattern deviation maps highlight localized loss. The results of the glaucoma hemifield test are shown below the gray scale. Patient and test information, reliability criteria, and global indices are labeled. The probability symbols are similar in the total and pattern deviation maps indicating localized loss. Note that the normal mean deviation and abnormal corrected pattern standard deviation (p < 1%) are also consistent with a purely localized defect.

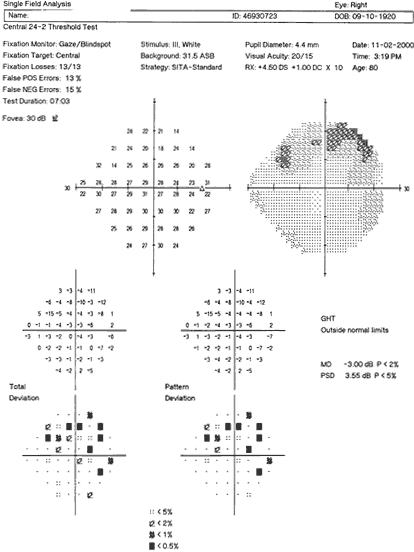
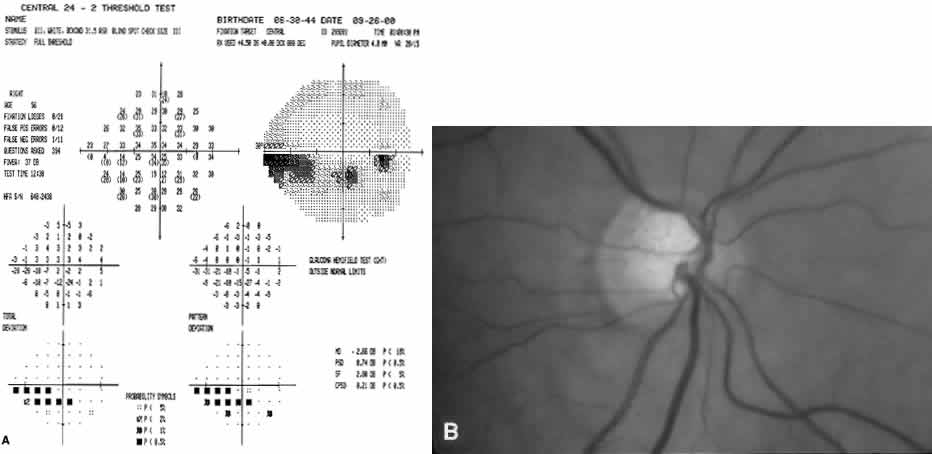
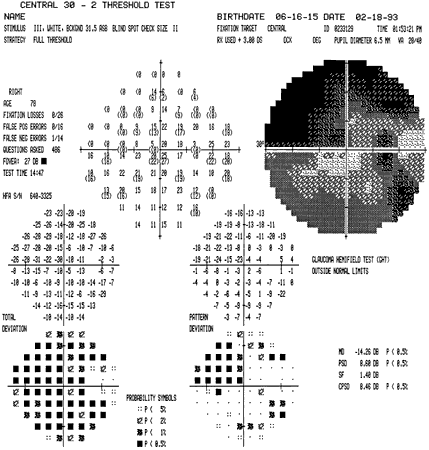
If the probability symbols in the total and pattern deviation maps are similar, the defect is predominantly localized (Fig. 35). If there are many probability symbols in the total deviation map but few in the pattern map, the defect is mainly diffuse (see Fig. 17). If both maps have probability symbols but many more symbols are found in the total deviation map, there is mixed localized and diffuse damage (Fig. 36).

Fig. 35. A. Pure localized loss. There is an inferior visual field defect with similar number of probability symbols in both the total and pattern deviation maps. There is a very significant corrected pattern standard deviation with a borderline significant mean deviation. Note that the mean deviation becomes significant even with pure localized defects when the defect is extensive. B. Photograph of this patient's right optic nerve shows thinning superiorly causing the inferior field defect.

Fig. 36. Mixed localized and diffuse loss. There are significant probability symbols in both the total and pattern deviation plots. However, there are more symbols in the total deviation plot compared with the pattern deviation. The mean deviation and corrected pattern standard deviation are significantly abnormal.

GLOBAL INDICES

An enormous amount of information is generated by automated perimetry. Calculation of the global indices is a form of computer-assisted data reduction. Global indices depict the overall characteristics of the visual field that are clinically important43,44

Mean deviation reflects the overall depression or elevation of the visual field. The deviation from the age-matched normal value is calculated at each location in the visual field. Mean deviation is the weighted average of the deviation values for the locations tested. Although influenced by any type of visual field defect, it is most sensitive to diffuse changes in the visual field and is relatively insensitive to smaller localized defects.

Short-term fluctuation has already been described. It measures the intratest variability.

Irregularities of the smooth contour of the hill of vision are reflected by an elevated pattern standard deviation. Such irregularities can be due to a localized visual field defect or to patient variability. The corrected pattern of standard deviation provides a measure of the irregularity of the contour of the hill of vision that is not accounted for by patient variability (short-term fluctuation). It is increased when localized defects are present (see Fig. 35).

The Humphrey program provides probability values for results that lie outside the normal limits. The Octopus program provides analogous indices in some of its printouts. Mean defect, loss variance, and corrected loss variance are equivalent to mean deviation, pattern standard deviation, and corrected pattern standard deviation, respectively, on the HFA. Octopus calculates the mean sensitivity that is the average of the threshold values for all test locations. Age-corrected normative data are not used in calculating the mean sensitivity.

HEMIFIELD ANALYSIS

Localized glaucomatous loss typically occurs asymmetrically and often involves only one hemifield. Therefore, comparing the differential light sensitivity of corresponding regions of the two hemifields may highlight an early abnormality of the visual field.45 One available hemifield comparison test is Humphrey Statpac 2 software. The Statpac 2 hemifield test compares the probability values from the pattern deviation map at five regions in each hemifield. Fields are classified as normal, borderline, or outside normal limits. The Statpac 2 hemifield test also indicates when significant generalized reduction of sensitivity or abnormally high sensitivity is present.46

INTEREYE COMPARISONS

The difference in the mean sensitivity between a patient's two eyes is less than 1 dB 95% of the time and less than 1.4 dB 99% of the time. Intereye differences greater than these values are suspicious if they are unexplained by nonglaucomatous factors, such as unilateral cataract or miosis.47

ASSESSING PROGRESSION OF VISUAL FIELD DEFECTS

It can be difficult to determine whether a new visual field examination shows progressive glaucomatous damage. The large amount of data generated by automated perimetry and the confusion caused by the large fluctuations of threshold response complicate interpretation.

To show that progressive damage is present, the observed change must be greater than the expected fluctuations. Short-term fluctuation only measures the fluctuation within a single field test, and it is smaller than the fluctuations that occur across serial field examinations. Currently, there is no clinically practical method of measuring the total fluctuation of serial visual fields.

Fluctuations may be large in glaucomatous visual fields.40,48 The fluctuations of individual locations in the visual field increase as the mean sensitivity decreases into the low teens. The fluctuations of thresholds in the low teens are so great that they span the entire dynamic range of the perimeter.49,50

It is not possible to distinguish between progression and fluctuation when comparing results of two visual field examinations. The key to detecting progressive loss is to look for trends over a series of visual fields. Only when test conditions are consistent can trends across the series be determined. In particular, the proper refraction must be used for each examination, and changes in visual acuity should be checked. Pupillary diameters of less than 2.5 mm should be noted because they can influence test results. Consistency of the testing strategy and of the target size used is necessary.

POINT-BY-POINT COMPARISONS

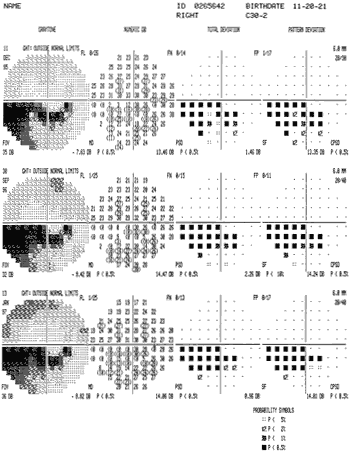
Sensitivities at individual locations and clusters of locations can be compared with the use of raw thresholds, difference plots, or Humphrey probability plots (Fig. 37). It is important to look for a change in the depth and size of scotomas and to check for the development of new scotomas, particularly in the arcuate and nasal step regions. The overview program from Statpac II enables comparisons of serial visual fields by printing a reduced version of multiple tests on a single page.

Fig. 37. The overview printout for the Humphrey Field Analyzer allows up to 10 examinations to be printed sequentially. This feature facilitates looking for trends in the gray scales, actual thresholds, total deviation probability maps, and pattern deviation probability maps. In this example, the inferior defect remains stable over the series of examinations.

DATA REDUCTION AND STATISTICAL ANALYSIS

Many statistical programs have been developed in an attempt to reduce the amount of data and to present it in a manner that facilitates interpretation. Some programs provide tabular or graphic displays of data for multiple visual fields. Others perform statistical tests in an attempt to identify statistically significant changes. A statistically significant change does not necessarily mean that clinically significant glaucomatous progression has occurred, so that each finding must be interpreted in the context of the remainder of the patient's status.

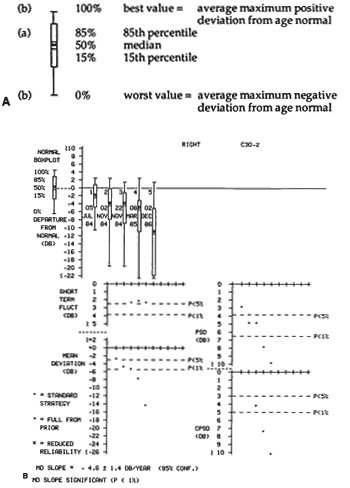
The box plots in the Humphrey Statpac program graphically highlight the median and spread of the defect values for sequential examinations (Fig. 38).42 Linear regression analysis can identify changes across serial visual fields.51 Regressions can be performed on individual threshold locations, clusters of locations, or the visual field indices; however, the clinical significance of this form of analysis has been questioned.52 The Statpac and Statpac 2 software perform linear regression analysis of the mean defect.

Fig. 38. The change analysis printout of the Humphrey Statpac software. A. A normal box plot. B. Visual field progression has occurred over a series of five examinations performed within a period of 2.5 years. The box plots elongate and descend on the graph. The mean deviation and corrected pattern standard deviation decline. The mean deviation slope is negative and significant, indicating a statistically significant overall decline. (Haley MJ: The Field Analyzer Primer. San Leandro, CA: Humphrey Instruments, 1987.)

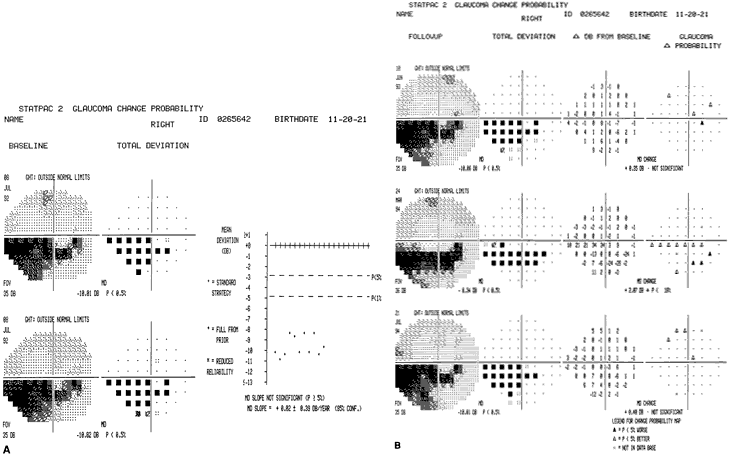
Humphrey Statpac 2 change probability analysis provides a useful means of assessing serial visual fields (Fig. 39). Rather than analyzing data for statistical change or for differences from age-corrected normal values, this program assesses changes from the patient's own baseline and compares the changes with a database of empiric data from patients with stable glaucoma. The program compares each location of a new visual field with a designated baseline test or pair of tests while incorporating knowledge of the typical intertest fluctuations seen in patients with stable glaucoma. Changes that are significant at the 5% level are identified. One limitation of this program is that moderately to severely disturbed fields with mean defects greater than or equal to 15 dB cannot be analyzed. In addition, changes at individual locations in which the thresholds are moderately to severely depressed are not assessed because the fluctuations of these points are too great.46,53,54

Fig. 39. Glaucoma Statpac 2 change probability printouts. A. Baseline examinations. Two tests are averaged to obtain a baseline. B. Follow-up examinations. Subsequent tests are compared with the baseline at each point in the visual field. Using information about the normal variability of threshold measurements in patients whose glaucoma is stable, the test evaluates whether each point has changed significantly from the baseline. The results are shown in the plots on the right side of the printout. Closed triangles represent significant depression of the threshold, and open triangles represent significant improvements. An x indicates a value that is too depressed to evaluate. In this example, there is no significant change in the inferior defect.

The visual field must not be analyzed in isolation from the rest of the patient's status. Intelligent interpretation of visual fields can be performed only in the context of the patient's history, risk factors, and findings at clinical examination. New and progressive visual field defects should be correlated with the appearance of the optic nerve head.

Back to Top
THE FUTURE OF PERIMETRY
The recent past has brought great new developments in the field of perimetry, and it has opened up areas for the development of new testing and analysis programs. A large empiric database for patients with glaucoma has improved the accuracy and detectability of glaucomatous visual field defects. Introduction of the SITA strategy may improve patient compliance with perimetry while improving data acquisition. New psychophysical perimetric methods, such as SWAP and FDT, are adding additional functionality to our armamentarium. Despite new advances in computerized optic nerve analysis, perimetry continues to remain the mainstay of glaucoma diagnosis and management.
Back to Top
REFERENCES

1. Traquair HM: Perimetry in the study of glaucoma. Trans Ophthalmol Soc UK 51:585, 1931

2. Aulhorn E, Harms H: Visual perimetry. In Jameson D, Horvich CM (eds): Handbook of Sensory Physiology. Vol 7. Berlin: Springer-Verlag, 1972

3. Hattington DO, Drake MV: The Visual Fields: Textbook and Atlas of Clinical Perimetry. St Louis: CV Mosby, 1990

4. Anderson DR: Perimetry With and Without Automation. 2nd ed. St Louis: CV Mosby, 1987

5. Drance SM, Anderson DR: Automatic Perimetry in Glaucoma: A Practical Guide. New York: Grune & Stratton, 1985

6. Minkler DS: The organization of nerve fiber bundles in the primate optic nerve head. Arch Ophthalmol 98:1630, 1989

7. Hayreh S: Blood supply of the anterior optic nerve. In Ritch R, Shields MD, Krupin T (eds): The Glaucomas. Vol 1. St Louis: CV Mosby, 1989

8. Quigley HA, Addicks EM: Regional differences in the structure of the lamina cribrosa and their relation to glaucomatous optic nerve damage. Arch Ophthalmol 99:137, 1981

9. Flammer J, Drance SM, Zulauf M: Differential light threshold: Short and long term fluctuation in patients with glaucoma, normal controls and patients with suspected glaucoma. Arch Ophthalmol 102:704, 1984

10. Werner EB, Drance SM: Early visual field defects in glaucoma. Arch Ophthalmol 95:1173, 1977

11. Hart WM, Becker B: The onset and evolution of glaucomatous visual field defects. Ophthalmology 89:268, 1982

12. Phelps CD, Hayreh SS, Montague PR: Visual fields in low tension glaucoma, primary open angle glaucoma and anterior ischemic optic neuropathy. Doc Ophthalmol 35:113, 1983

13. Piltz JR, Drance SM, Douglas GR et al: The relationship of peripheral vasospasm, diffuse and localized visual field defects and intraocular pressure in glaucomatous eyes. In Perimetry Update 1990/91: Proceedings of the IX International Perimetric Society Meeting. Amsterdam: Kugler & Ghedini, 1991:465

14. Bebie H, Flammer J, Bebie H: The cumulative defect curve: Separation of local and diffuse components of visual field damage. Graefes Arch Clin Exp Ophthalmol 227:9, 1989

15. Mikelberg F, Drance SM: The mode of progression of visual field defects in glaucoma. Am J Ophthalmol 98:443, 1984

16. Martinez-Bello C, Chauhan BC, Nicolela MT et al: Intraocular pressure and progression of glaucomatous visual field loss. Am J Ophthalmol 129:302, 2000

17. Hoskins HD, Kass M: Becker-Shaffer's Diagnosis and Therapy of the Glaucomas. St Louis: CV Mosby, 1989

18. The Field Analyzer Primer. San Leandro, CA: Humphrey Instruments, 1986

19. Spry PGD, Henson DB, Sparrow JM et al: Quantitative comparison of static perimetric strategies in early glaucoma: Test-retest variability. J Glaucoma 9:247, 2000

20. Humphrey Field Analyzer II User's Guide. Dublin, CA: Humphrey Systems, 1998

21. Sekhar GC, Naduvilath TJ, Lakkai M et al: Sensitivity of Swedish Interactive Threshold Algorithm in Humphrey visual field testing. Ophthalmology 107:1303, 2000

22. Johnson CA, Adams AJ, Casson EJ et al: Blue-on-yellow perimetry can predict the development of glaucomatous visual field loss. Arch Ophthalmol 111:645, 1993

23. Blumenthal EZ, Sample PA, Zangwill L et al: Comparison of long-term variability for standard and short-wavelength automated perimetry in stable glaucoma patients. Am J Ophthalmol 129:309, 2000

24. Kelly DH: Nonlinear visual responses to flickering sinusoidal gratings. J Opt Soc Am A 71:1051, 1981

25. Cello KE, Nelson-Quigg JM, Johnson CA: Frequency doubling technology perimetry for detection of glaucomatous visual field loss. Am J Ophthalmol 129:314, 2000

26. Fellman RC, Lynn JR, Starita RJ et al: Clinical importance of spatial summation in glaucoma. In: Perimetry Update 1988/89: Proceedings of the VIII International Perimetric Society Meeting. Amsterdam: Kugler & Ghedini, 1989

27. Wilensky JT, Metmelstein JR, Sietel HG: The use of different sized stimuli in automated perimetry. Am J Ophthalmol 101:710, 1986

28. Stewart WC, Shields MB: The peripheral visual field in glaucoma: Reevaluation in the age of automated perimetry. Surv Ophthalmol 36:59, 1991

29. Weinreb RN, Perlman JP: The effect of refractive correction on automated perimetric thresholds. Am J Ophthalmol 101:iO6, 1986

30. Goldstick BJ, Weinreb RN: The effect of refractive error on automated global analysis program Gel. Am J Ophthalmol 104:229, 1987

31. Drance SM, Betty V, Hughes A: Studies on the effects of age on the central and peripheral isopters of the visual field in normal subjects. Am J Ophthalmol 63:1667, 1967

32. Jaffe GJ, Alvarado JA, Juster RP: Age-related changes of the normal visual field. Arch Ophthalmol 104:1021, 1986

33. Heijl A, Lindgren G, Olsson J: The effect of petimettic experience on normal subjects. Arch Ophthalmol 107:81, 1989

34. Heijl A, Drance SM: Changes in differential threshold in patients with glaucoma during prolonged perimetry. Br J Ophthalmol 67:512, 1983

35. Katz J, Sommer A, Witt K: Reliability of visual field results over repeated testing. Ophthalmology 98:70, 1991

36. Katz J. Sommer A: Reliability indexes of automated petimetric tests. Arch Ophthalmol 106:1252, 1988

37. Bengtsson B, Heijl A: False-negative responses in glaucoma perimetry: Indicators of patient performance or test reliability? Invest Ophthalmol Vis Sci 41:2201, 2000.

38. Flammer J, Drance SM, Fankhauser F et al: Differential light threshold in automated static perimetry: Factors influencing short-term fluctuations. Arch Ophthalmol 102:876, 1984

39. Flammer J. Drance SM, Schulzer M: Covariates of the long-term fluctuation of the differential light threshold. Arch Ophthalmol 102:880, 1984

40. Starita RJ, Piltz JR, Lynn JR et al: Total variance of serial Octopus visual fields in glaucomatous eyes. Doc Ophthalmol 49:85, 1987

41. Heijl A, Asman P: A clinical study of perimetric probability maps. Arch Ophthalmol 107:199, 1989

42. Statpac Users Guide. San Leandro, CA: Allergan Humphrey Instruments, 1987

43. Flammer J, Drance SM, Augustiny L et al: Quantification of glaucomatous visual field defects with automated perimetry. Invest Ophthalmol Vis Sci 26:176, 1985

44. Hirsch J: Statistical analysis in computerized petimetry. In Whalen WR, Spaeth GL (eds): Computerized Visual Fields: What They Are and How to Use Them. Thorofare, NJ: Slack, 1985:309

45. Duggan C, Sommer A, Auer C et al: Automated differential threshold perimetry for detecting glaucomatous visual field loss. Am J Ophthalmol 100:420, 1985

46. Introducing Statpac 2. San Leandro, CA: Humphrey Instruments, 1989

47. Brenton RS, Phelps CD, Rojas P et al: Interocular differences of the visual field in normal subjects. Invest Ophthalmol Vis Sci 27:799, 1986

48. Werner EB, Petrig B, Krupin T et al: Variability of automated visual fields in clinically stable glaucoma patients. Invest Ophthalmol Vis Sci 30:1083, 1988

49. Heidl A, Lindgren A, Lindgren G: Test-retest variability in glaucomatous visual fields. Am J Ophthalmol 108:130, 1989

50. Piltz JR, Starita RJ: Test-retest variables in glaucomatous visual fields [letter]. Am J Ophthalmol 109:109, 1990

51. Holmin C, Krakau CET: Regression analysis of the central visual field in chronic glaucoma cases: A follow-up study using automated perimetry. Acta Ophthalmol 60:267, 1982

52. Chauhan BC, Drance SM, Douglas GR: The use of visual field indices in detecting changes in the visual field. Invest Ophthalmol Vis Sci 31:512, 1990

53. Heijl A, Lindgren G. Olsson J et al: Visual field interpretation with empiric probability maps. Arch Ophthalmol 107:204, 1989

54. Anderson DR: Automated Static Perimetry. St Louis: Mosby-Year Book, 1992

Back to Top