Chapter 19A
Molecular Biology and Genetics of the Retina
JOHN M. NICKERSON and J. FIELDING HEJTMANCIK
Main Menu   Table Of Contents

Search

OVERVIEW OF TERMS AND TECHNIQUES
INHERITED DISEASES OF THE RETINA FOR WHICH THE UNDERLYING MOLECULAR DEFECT IS KNOWN
CONCEPTS OF LINKAGE
ACKNOWLEDGEMENTS
APPENDIX I
APPENDIX II
APPENDIX III
REFERENCES

The reference material presented in this chapter provides the resident and clinical ophthalmologist with an adequate knowledge base to follow the exciting advances in the field of molecular biology of the retina and other structures of of the eye. Many of these advances are now the definitive genetic tests for certain ophthalmic diseases. The clinical practitioner needs to be not only familia with these tests But also aware of some caveats associated with them. Thus, the function of this chapter is to provide a primer for the fundamentals of molecular biology, examples of the application of molecular biology to fundamental research on the basics of the retina and visual system, applications to specific retinal diseases and degenerations, and finally a discussion of the powerful techniques underlying the world of genetic linkage tests. This chapter is not intended to replace a survey course in molecular biology or to provide detailed protocols for carrying out these techniques (several excellent texts1,2 and laboratory manuals3,4 provide thorough treatment of these topics). Also, this chapter is not meant to be encyclopedic on all the current topics of retinal molecular biology. In the following section, we only touch on a comparative handful of these, beginning with a few definitions.
Back to Top
OVERVIEW OF TERMS AND TECHNIQUES

MOLECULAR BIOLOGY

Molecular biology is the detailed study in detail of polymers of nucleic acids (DNA and RNA) that encode gene products, largely proteins. It also is the study of the control and regulation of gene expression. “Molecular biology is a discipline, a level of analysis, a kit of tools—which is to say, it is unified by style as much as by content. The style is unmistakable. The style is bold; it is simplifying; it is unsparing; often it is extremely competitive. The style is also, sometimes, subtle and sophisticated.”5

DNA

DNA is the fundamental genetic material that encodes genes. In almost all forms of life, DNA is replicated and passed from one generation to the next. Information is stored in DNA by the sequence of the bases in the molecule: adenine (A), guanine (G), cytosine (C), and thymine (T). By convention the sequences from left to right are the 5' to 3' orientation of the sense strand of the DNA molecule, where “5'” is the fifth position on the deoxyribose and the “3'” refers to the third carbon atom of deoxyribose. Information about a gene product is stored in groups of three bases. The genetic code decodes the triplets of bases, translating the DNA sequence through its messenger RNA (mRNA), an RNA copy of the DNA sequence, into an amino acid sequence. The amino acid sequence folds into a three-dimensional structure, forming a protein that is capable of some biologic function. For the most part proteins, rather than DNA or RNA, constitute the physiologic cellular machinery. Recent developments suggest that small RNAs play important roles in metabolism and that small RNAs may be used therapeutically to interfere with the expression of some genes.6

RESTRICTION ENZYMES

The discovery of restriction enzymes by microbiologists studying Escherichia coli and other bacteria provided a foundation for modern molecular biology. These enzymes, which are found in a variety of prokaryotes, cut the DNA double helix at specific base sequences, or sites. These sites are short but specific DNA sequences, usually four to eight bases in length. The natural function of a restriction enzyme is to degrade the DNA of invading viruses in order to protect the bacterium from infection. For example, the restriction enzyme EcoRI recognizes the sequence GAATTC in DNA and cleaves the DNA between the G and the first A. Over 500 different restriction enzymes, each recognizing a different DNA sequence, are now commercially available. They usually recognize sequences that are palindromic (reading the same forward and backward).

When these enzymes cut the DNA strands in the middle of their recognition sequence, blunt ends are formed. When the strand scissions are offset, overlapping single-stranded ends of two or four bases are created. These “sticky ends” can occur with an overhang of the 3' strand (e.g., as produced by the restriction enzyme, Pst I) or with the 5' strand (e.g., as with EcoRI). Because any sticky ends created by digestion with the same restriction enzyme can reanneal readily under the proper conditions, these enzymes provide a powerful tool for inserting foreign DNA fragments into many vectors or other constructions. This allows virtually all sequences from the human genome to be cloned (inserted into plasmid or bacteriophage vectors and replicated in bacteria), so that large amounts can be isolated in pure form.

One way in which a bacterium protects its own DNA from digestion with its own restriction endonuclease is with a methylase that recognizes and adds a methyl group to the given sequence. This sequence, once methylated, is no longer a target for some restriction endonucleases. Other restriction endonucleases are not inhibited by methylation, and these can recognize exactly the same sequences as the homologs that are inhibited. Two restriction enzymes that recognize the same base sequence but are isolated from different organisms are called isoschizomers. Just as isoschizomers may or may not react similarly to methylation, they may not cut the DNA strands at the identical site within the recognition sequence, and thus they may not produce identical ends.

Although these differences are of more central concern to cloning and rearranging DNA fragments, they also can be important in gene mapping. For example, the use of a methylation-sensitive restriction endonuclease for analysis of restriction fragment length polymorphisms (RFLPs) might suggest genetic (DNA sequence) polymorphism when none exists. Methylation plays a role in gene expression in higher eukaryotes, and the use of pairs of isoschizomers, one of which is inhibited by methylation, is a means of assessing gene inactivation. Usually a gene that is not expressed in a given tissue is methylated, whereas the same gene is not methylated in a tissue where the gene's expression is needed.

RECOMBINANT TECHNOLOGY

Recombinant DNA technology is the set of techniques and tools used by molecular biologists to manipulate DNA molecules. Recombinant DNA technology allows the preparation of large amounts of a pure and homogeneous DNA sequence. Figure 1 illustrates the fundamentals of the technology with a procedure called subcloning. This procedure begins with a DNA sequence of interest, for example, part of a gene or cDNA that will be “inserted” into a second, usually larger, piece of DNA, called a “vector,” which is used to propagate the gene fragment. Vectors usually are derived from bacterial viruses (bacteriophages) or bacterial plasmids, small double-stranded DNA circles commonly found in bacteria that replicate autonomously from the bacterial DNA. The vectors usually have been manipulated to delete parts of the parental plasmid or virus and frequently have had other genes added to them depending on their specific application. To subclone the gene fragment into a different vector, some sequence information or knowledge of the positions of restriction enzyme recognition sites is required. The sequences of the vectors are usually known. Using a desktop computer and DNA sequence analysis software, restriction enzyme sites in sequences can be identified readily. The choice of the enzymes depends on the availability of compatible ends that border the insert to be subcloned, the absence of extra internal sites in the insert, and compatible sites in the vector. Once the gene fragment has been cleaved with a restriction enzyme, the DNA fragments of DNA can be purified by any of several techniques, including electrophoresis, differential precipitation, and chromatography. The purified DNA fragment can be introduced into a specialized vector that has a compatible restriction enzyme site in an appropriate location. The two DNA molecules are mixed in roughly equimolar amounts, and the enzyme T4 DNA ligase is added. This enzyme will join covalently the 5' phosphate from the end of one DNA molecule to the 3' hydroxyl of another DNA fragment. When both ligations (one from each end of the two molecules) have been completed, we will have created a circular DNA molecule bearing a copy of the vector and the insert. By judicious choice of conditions in the previous ligation reaction, the fraction of aberrant molecules can be minimized but not totally eliminated. Important examples of these unwanted circular molecules include a single copy of the vector with two or more inserts and others that have no insert.

Fig. 1. Subcloning of a DNA fragment, in this case containing a putative promoter fragment, from one clone into another vector. Judicious selection of an appropriate restriction enzyme yields a recombinant plasmid containing the inserted promoter fragment in the recombinant plasmid. Drug resistance markers are located on each of the plasmids, allowing selection of the appropriate plasmid after bacterial transformation. The plasmids contain enough markers so that it is easy to discriminate among the three plasmids shown in the figure. The expression vector contains the β-lactamase gene, which allows bacteria containing this plasmid to grow in the presence of ampicillin. This plasmid also contains the gene for β-galactosidase. In the presence of a substrate called X-gal, colonies containing this gene will turn blue. The restriction enzyme (RE) site for RE #1 is within this gene, and when a fragment is successfully cloned into this site, the gene is interrupted and is no longer capable of functioning to convert the substrate, X-gal, into the blue product. Thus, colonies with the insert in the expression vector will be white. Bacterial colonies which are TetR and AmpR (tetracycline resistant and ampicillin resistant, respectively) result from the original plasmid containing the promoter fragment. Neither of the other plasmids (the expression vector or the recombinant vector) contain the TetR gene, and they will be TetS (sensitive to tetracycline), so colonies containing these plasmids will fail to grow on plates containing tetracycline. To select the appropriate colonies, we plate the initial transformants on Amp plates containing X-gal. One day later we will pick the white colonies. We will replate them on Amp plates in an ordered pattern and on Tet plates in the same ordered pattern. Those that are AmpR, white, and TetS will be the colonies that contain the appropriate plasmid. We will verify the legitimacy of the plasmid by preparing a small amount of the plasmid from these colonies and digest the plasmid with RE #1, the restriction enzyme that we used to make the construct. Valid constructs should give us the two identically sized fragments that we used to make the recombinant plasmid.

The next step, bacterial transformation, introduces the vector-insert recombinant plasmid into bacterial cells. This can be done by chemical treatment or by electroporation, both of which open small pores in the bacterial plasma membrane, allowing the DNA to enter the cell. Once in the bacterium, the plasmid replicates independently of the host cell DNA and continues to do so long after the cell stops growing. Depending on the particular plasmid, each bacterial cell might contain several to hundreds of copies of the plasmid. Usually the vector DNA contains an antibiotic resistance gene, such as β-lactamase, that allows a transformed bacterial cell harboring the recombinant plasmid to grow in media containing an antibiotic, ampicillin in this case. By plating the bacteria on Petri dishes containing a rich medium including ampicillin, only resistant bacteria (those carrying the plasmid) will grow enough to form appreciable colonies in a day or so. The transformation events are rare enough so that individual colonies can be chosen, selected with a sterile loop or toothpick, and replated. Thus, in only 1 to 2 days, a single bacterial colony can be purified to homogeneity that bears a single pure plasmid. A milligram of the plasmid can be purified readily from a 1-liter culture of the isolated bacterium. This quantity is usually sufficient to last for 1 year.

SOUTHERN BLOT ANALYISIS

Digestion of a small plasmid (e.g., pBR322, which is 4,362 bp in size) with a restriction endonuclease produces a small number of fragments of discrete size. By subjecting the digested DNA to agarose gel electrophoresis, these fragments can be separated by their sizes and then detected visually with ethidium bromide staining. Ethidium bromide binds to DNA, and when bound, it fluoresces quite intensely. In electrophoresis, the electric field moves DNA fragments through the meshwork of agarose fibers. Because the agarose matrix impedes larger DNAs more than smaller fragments, small DNAs migrate faster than the larger fragments. After electrophoresis and staining, the resulting DNA fragments appear as an array of bands on the agarose gel, with the larger fragments near the starting point and smaller fragments progressively nearer the anodal end of the gel. The set of bands is a fingerprint characteristic of the plasmid that was digested with the one restriction enzyme. It is easy to compare different plasmids digested with the same enzyme by running the digests on adjacent lanes of an agarose gel.

To learn whether a DNA sample, e.g., the insert of a plasmid, contains some or all of a gene or to learn whether the insert is a faithful representation of the gene in a human being, it is often necessary to evaluate human DNA on an agarose gel. When DNA isolated from humans or other higher eukaryotes is digested with a restriction enzyme, the result appears as a broad smear from top to bottom of the gel. This is because the human genome contains 3 × 10⁹ base pairs (the number of unique nucleotides present in a haploid set of human chromosomes). For a restriction endonuclease recognizing a sequence of six nucleotides, assuming recognition sites are randomly distributed approximately once every four kilobase (kb) pairs in the genome, resulting in roughly 7.5 × 10⁵ different DNA fragments. The individual fragments lie so close together that they appear as a smear on an ethidium bromide–stained gel. Clearly, if an individual fragment is to be identified, a means other than ethidium bromide staining is required to locate the band on the gel.

The double-stranded nature of DNA, with Watson-Crick base pairing between the two strands containing complementary sequences, provides an ideal means to identify specific DNA fragments. After being run on an agarose gel, the DNA fragments are denatured to separate the complementary strands and then transferred from the agarose gel onto a support membrane, either nitrocellulose or more commonly nylon (Fig. 2). The transfer can occur by capillary action (the classic Southern blot), vacuum, pressure, or electric current. While the initial binding of the DNA to the membrane is reversible (unless the transfer is performed in alkaline buffer), the fragments are covalently attached by baking, ultraviolet irradiation, or sometimes merely drying.7 The DNA fragments are immobilized on the membrane in a denatured state and in a position precisely corresponding to their locations on the agarose gel.

Fig. 2. Southern blot analysis. To identify a specific genomic DNA fragment among the hundreds of thousands of restriction enzyme fragments in the human genome, we use the Southern blot technique.7 This approach consists of several steps illustrated above. Genomic DNA is prepared and digested with any of several restriction enzymes. The DNA fragments are separated by size on agarose gel electrophoresis. The smaller fragments migrate faster through the agarose fiber meshwork. The fragments of interest can be identified by hybridization with a labeled probe. The DNA bands are first transferred out of the agarose onto a nitrocellulose or nylon membrane by capillary action. The DNA fragments can be permanently attached to the membrane by heat or ultraviolet light treatment. A radiolabeled DNA probe (e.g., a denatured cDNA) in single-stranded form can anneal by base pairing to its counterpart on the membrane. Excess probe DNA is washed off the filter, and by autoradiography of the filter we can visualize the specific DNA band or bands matching the probe. The Southern blot procedure allows us to detect and measure the size of one or a few DNA fragments out of the millions of different genomic DNA fragments produced by digestion with a given restriction enzyme.

Specific DNA fragments are identified by annealing with a probe that has been labeled with radioactive phosphorus or fluorescent nucleotides. The probe is usually a piece of cloned DNA isolated from its vector. The probe is denatured into its two strands just before application to the membrane. This allows each strand of the probe to anneal to the denatured DNAs bound to the membrane. Radioactive nucleotides are incorporated into probes in several ways. Nick translation involves nicking one strand of the DNA double helix with DNase I and then elongating from this point by E. coli DNA polymerase I replacing one strand with radioactive nucleotides. In random priming, a mixture of many different oligonucleotides, usually hexamers, is annealed to denatured DNA strands to serve as a primer for elongation of the templates. This technique has the advantage of giving very high specific activities (usually greater than 109 cpm (counts per million) per μg with 32P-labeled nucleotides) and can be used to label DNA fragments in low melting point agarose directly after excision from an electrophoretic gel. Various alternative means to label probes, including production of a single-stranded probe with M13 phage or riboprobes (labeled RNA probes), are useful in special circumstances. When oligonucleotides are used as probes, they are simply end-labeled with polynucleotide kinase, which transfers the γ-phosphate (usually bearing radioactive 32P) from adenosine triphosphate (ATP) to a 5' hydroxyl group in DNA.

The probe, if initially double stranded, is denatured thermally or by adjustment to an alkaline pH before hybridization. It is added to a suitable hybridization medium and allowed to anneal to the target DNA immobilized on the blot. Annealing or hybridization takes place best at approximately 5° C below the melting temperature (Tm) of the probe-target complex. The Tm can be influenced by the hybridization solution in several ways: it will increase in proportion to the logarithm of the ionic strength of the solution, and it will decrease in the presence of formamide or other denaturant. The Tm is influenced by the length of the probe and the percentage of bases that are G and C. G:C base pairing is more stable than A:T base pairing. A general formula for the melting temperature of a hybrid is:


Tm = 81.5° C - 16.6(log10[Na+]) + 0.41(% G + C)– 0.63(% formamide) – (600 / probe length)

where [Na+] is the sodium ion concentration in molar dimension, and probe length is in base pairs. In addition, the Tm of a hybrid is decreased by 1 × to 1.5 × for each percent of mismatch between the probe and its target sequence. Hybrids formed by RNA are slightly more stable, so an RNA-DNA hybrid might melt at a temperature as much as 10° C above the corresponding DNA-DNA hybrid. Finally, short oligonucleotides follow a different rule:


Tm = 2(A + T) + 4(G + C)

where each letter represents the number of that particular base in the oligonucleotide. For example, the Tm of a 20-mer with four A's, six G's, five C's, and five T's is 62° C. There are several protocols for hybridization in common use, each of which works well if used appropriately. These protocols have several ingredients in common. Ionic strength (Na+ concentration, other monovalent cations) and denaturants such as formamide influence the stability of specific hybrids. A second group of components including detergents (especially sodium dodecyl sulfate) and charged species (such as bovine serum albumin, polyvinyl pyrolidone, and ficoll in Denhardt's solution) tend to decrease nonspecific binding of the probe to the membrane, which is usually dependent on charge phenomena. Finally, components such as herring sperm DNA are designed to decrease nonspecific binding of repetitive elements in the probe to target DNA. Probes that contain repetitive elements also can be preannealed for several hours to a low Cot value with sheared human DNA so that these sites in the probe are “protected” and cannot recognize repetitive DNA on the membrane immobilized target DNA. This preannealing step blocks the repetitive elements in the probe so that only unique sequences of the probe are available to hybridize to DNA bound on the membrane. This decreases nonspecific binding when the probe is used for hybridization. Dextran can be included to increase the rate of hybridization. Usually the probe is incubated with a filter overnight to assure the specific hybridization of the probe to the filter-bound DNA reaches equilibrium.

After hybridization of the probe to filter-bound DNAs, excess nonspecifically bound probe is rinsed off by a series of incubations in large volumes of buffer. Initially, nonstringent washes are performed. These buffers are usually approximately 300 mM salt and near room temperature. These preliminary washes remove most excess radioactive probe and are followed by stringent washes that are conducted at elevated temperatures, near the Tm of the probe. The buffer for a stringent wash contains about 15 mM salt, and the wash temperature is set at 52° to 68° C for 20 minutes. There are two to four changes of the stringent buffer. Under these conditions only tightly and specifically bound probe remains attached to the filter. Afterward, the membrane with the specifically bound probe is wrapped in Saran Wrap or sealed in a plastic pouch, placed in a light-tight cassette on a piece of x-ray film (autoradiography), and left to expose the film for 1 to 2 days. Usually two intensifying screens are placed in the cassette to shorten exposure time. To reduce reciprocity failure of the film, the exposure is normally carried out at -80° C. This low temperature reduces thermal decay of the first of the two interactions required for a latent image to form on the film. The image on the developed film identifies the hybridizing DNA bands. The comparison of cloned gene fragments with authentic human DNA can validate the cloning process and show whether the entire gene was cloned. Also, Southern blot analysis7 can show differences among individuals at particular genetic loci, which can be used in linkage analysis, as discussed later, or in the identification of mutations that cause inherited diseases.

Besides the classic agarose gel electrophoresis method, other techniques for separating large fragments of DNA have been devised. Pulsed-field and field inversion gel electrophoresis allow separation of extremely large DNA fragments. These electrophoretic techniques are discussed later. Once these tests are run, a similar Southern blot technique can be used to identify a specific large DNA fragment. These combined approaches have been useful in analyzing bacterial artificial chromosome (BACs) and yeast artificial chromosome (YACs) clones, both of which contain large DNA inserts.

cDNA LIBRARIES, GENOMIC LIBRARIES, AND LIBRARY SCREENING

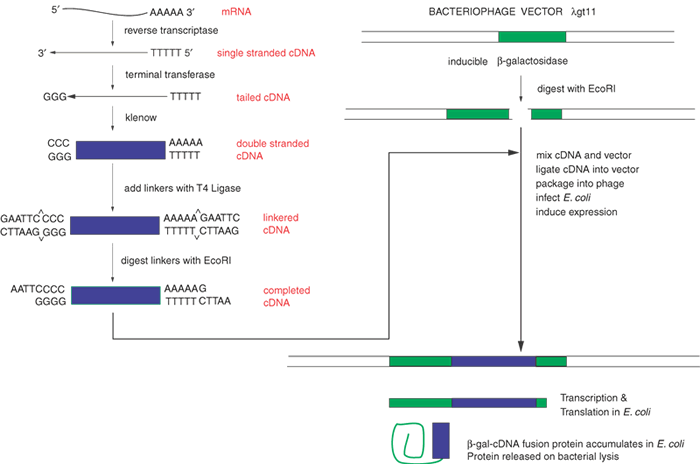
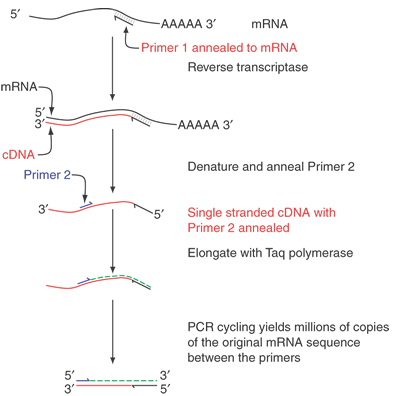
Within a given tissue, only a small fraction of the genes of the whole genome is expressed. In the retina, opsin mRNA makes up about 2% of the total mRNA, and interphotoreceptor retinoid-binding protein (IRBP) mRNA accounts for approximately 0.1%. Perhaps as few as 10,000 different mRNAs are expressed in the retina, whereas there are approximately 35,000 genes expressed in the body at different times. Ideally, cDNA libraries are complete collections of DNA copies of these mRNAs that have been cloned in an appropriate vector. The process of constructing such a library is shown in Figure 3. The key step is the conversion of RNA to DNA by the enzyme reverse transcriptase. Reverse transcriptase requires a double-stranded region to initiate synthesis of DNA. A synthetic DNA oligonucleotide can serve as a primer for the reverse transcriptase. This primer anneals to the mRNA providing the necessary double-stranded region. In many cases the primer used is oligo(dT). This primer can base-pair to a poly(A) stretch at the 3' end of most mRNAs, and poly(A):oligo(dT) provides the double-stranded region that reverse transcriptase needs. The initial DNA copy of the RNA is converted to double-stranded DNA by the Klenow fragment of DNA polymerase I. Several alternatives can be used to modify the ends of the cDNA to make it compatible with cloning vectors. Here we illustrate the use of tailing reactions with terminal deoxynucleotidyl transferase. The remaining reactions are similar to the subcloning strategy shown in Figure 1. The main difference is that we are now treating a mixture of thousands of different cDNAs in the same way that we previously treated the single homogeneous DNA insert. Because of the greatly increased number of different inserts, the steps of ligation into the vector and transformation must be efficient to ensure that no mRNA molecule or its corresponding cDNA is lost from the library.

Fig. 3. Construction of a cDNA Library. To clone a large group of cDNAs from a given tissue, such as the retina, we begin with a few milligrams of RNA. Only approximately 0.5% to 5% of the total RNA represents mRNA; the bulk of the RNA is ribosomal and tRNA. Reverse transcriptase copies the mRNA into single-stranded DNA, complementary DNA (cDNA). This is converted to double-stranded DNA by the Klenow fragment of DNA polymerase I. Linkers are ligated to the ends of the cDNA. When digested with a restriction enzyme, such as EcoRI, these give sticky ends compatible with similarly digested vector. The thousands of different cDNAs are mixed with an excess of the digested vector, and T4 ligase is added. In suitable conditions only one cDNA will be ligated into each vector molecule. The recombinant vector, λgt11 with a cDNA, is packaged to reconstitute viable bacteriophage and can be grown on agar plates seeded with enough Escherichia coli to form a uniform lawn of cells over the surface of the plate. Because of the design of the vector, the infected E. coli will produce some protein derived from the cDNA. This protein also contains some amino acid sequences from the vector, and the protein is a hybrid of bacterial galactosidase and the polypeptide from the cDNA. This is called a fusion protein. The group of bacteriophage resulting from the insertion of the individual cDNAs into the vector molecules is called a cDNA library.

Another way to minimize these losses is to make very large cDNA libraries, with 107 or more clones. Such a large library is redundant, containing many copies of the same mRNAs, but these libraries should be relatively complete, hopefully with greater than 95% of all possible mRNAs represented in them. The ligation of the cDNA to the vector usually allows for only one cDNA per vector molecule. Thus, colony isolation and purification produces one pure cDNA from one pure bacterial colony or phage plaque. Although the clones in most cDNA libraries directly reflect the frequencies of various mRNAs in the tissue of origin, special techniques allow the construction of libraries containing sequences unique to a specific tissue or developmental stage (subtraction libraries) or with roughly equal representation of all mRNAs found in a tissue (normalized libraries).

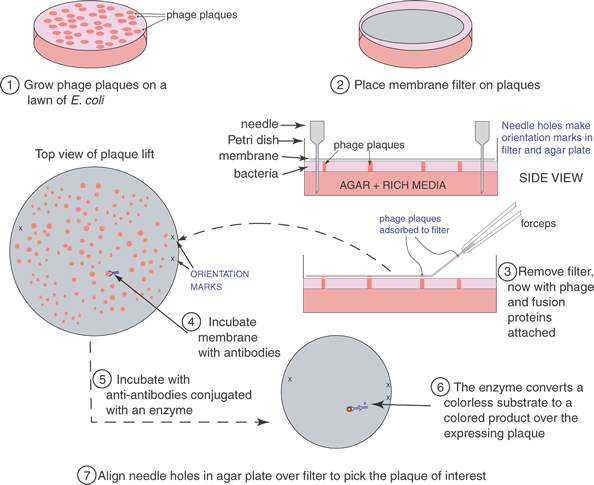
To find a cDNA clone among the thousands or millions of other clones represented in a library requires ingenuity and hard work. The first clone is always the hardest to find; after that it can be used as a hybridization probe to obtain longer clones or to walk to either end of the mRNA. One classic method to identify a cDNA clone coding for a specific protein is illustrated in Figure 4. Antibodies produced against the protein for which a cDNA is sought may bind to antigens that are produced on a protein that is expressed in E. coli as a fusion protein. The fusion protein is encoded by the cDNA that has been inserted into an expression vector, here λgt11. (Parts of the fusion protein are also encoded by the vector.) The antibody-antigen reaction can be detected by a color reaction, which generates a spot on a replica of the surface of a Petri dish covered with plaques. The location of the recombinant phage that contains the cDNA we want to isolate is the area where a colored spot coincides with a plaque. Multiple rounds of plaque purification ensure that the clone is homogeneous. Other schemes and strategies that also yield the desired clones including the following.

Fig. 4. The cDNA library screening process. cDNA libraries contain millions of different bacteriophage particles. To find the one bacteriophage out of the millions that contain the cDNA of interest requires an efficient and rapid technique to simultaneously analyze (nondestructively) all of these different cloned molecules. The procedure begins with the library plated on petri dishes. Typically, up to 500,000 phages might be grown on each 10-cm plate. A nitrocellulose filter is placed on top of the plate. This adsorbs some of the material on the surface of the dish, including bacteria, phage, and debris from lysed bacteria. This adsorbed material also includes some of the fusion protein expressed by bacterial cells before lysis kills an infected cell. This fusion protein leaks out of the bacterial cell, and some of the fusion protein will absorb onto the nitrocellulose filter where the plaque is located. For orientation purposes, marks are made in the filter and the petri dish with a syringe needle. These are needed to align the processed filter and the master plate to pick out the phage plaque with the positive signal on the filter. To detect the positive plaque, we incubate antibodies raised against the protein for which we want the cDNA clone.181,182 These antibodies bind to the fusion protein containing antigenic determinants common to it and the protein. Excess antibodies are rinsed off, leaving only the antibodies bound to the specific fusion protein. Again, these are located on the filter positioned directly over the spot where the plaque producing the fusion protein is on the plate. Second antibodies (anti-antibodies) conjugated with an enzyme such as alkaline phosphatase are incubated with the filter. After rinsing off excess antibodies, a substrate, which produces a colored product, is added, and a colored spot develops on the filter corresponding to the plaque producing the fusion protein. We align the filter and the plate, and with a glass pipet excise the plaque(s) corresponding to the signal. The phage from this plug of agar are replated, and the procedure is repeated until the phage are 100% positive for the antibody reaction, indicating that the bacteriophage is pure. Each of the several methods described previously has been used successfully, but the most effective has been the first, the use of antibodies and an expression cDNA library.

  1. Expression of pooled cDNA clones followed by functional biologic tests of the expressed proteins. The pools are then broken down into smaller and smaller pools until a unique clone is identified. This strategy is similar to the one discussed previously, except that in place of an antigenic reaction, a biologic function of the expressed protein is used in its place.
  2. The use of a degenerate oligonucleotide probe. By reversing the genetic code, a set of potential oligonucleotides can be obtained that might encode the protein for which we seek the cDNA. This strategy depends on the prior determination of at least some amino acid sequence of the protein that we want.
  3. Hybrid—selection. Groups of cDNA clones are used to select specific mRNAs from the total mRNA (the mixture of thousands of different mRNAs isolated from a tissue such as the retina) by hybridization of the mRNA to pools of cDNAs bound to a nitrocellulose filter. Specific mRNAs bind to the filter-bound cDNA clones, whereas the bulk of the mRNAs wash through; the specifically bound mRNAs can then be eluted later in purified form. These selected mRNAs can be translated to identify which proteins they produce. Similar strategies include the production of mRNA from individual clones (in suitable vectors) with T3 or T7 RNA polymerase and 7-methylguanosine Cap analogues. The resulting RNAs can be translated and analyzed.
  4. Subtraction screening. When there is little information available about the properties of the protein, it may be necessary to resort to this strategy, which has been applied very successfully, especially if the expression of a gene can be identified in a first tissue and shown to be absent from a second similar tissue. RNA from the first tissue is hybridized to an excess of cDNA from the second. The RNA that does not hybridize to the cDNAs is separated from the bound RNA and should contain a greatly enriched preparation of the mRNA that we want to clone. Several variations of this strategy have been used successfully; for example, the mouse rd1 (retinal degeneration 1) gene was first isolated by this strategy. Wild-type retinas contain photoreceptors, but rd1 retinas selectively lose theirs. Bowes and associates applied subtraction strategies to isolate the rd1 cDNA.8 Similarly, Travis and co-workers used subtraction screening to obtain the rd2 (rds; retinal degeneration slow) cDNA.9 The rd1 gene is now known to be the β-subunit of cGMP (cyclic guanosine monophosphate) phosphodiesterase,10 and rd2 is the peripherin/rds gene.11

Technical advances have made possible the analysis of large cDNA libraries. DNA sequencing technology has become rapid enough that large numbers of clones can be sequenced. The function of many of these cDNA clones remains unknown, but DNA and protein databases are large enough so that the function of many clones can be identified by comparing their sequences to those already in databases. Adams and colleagues, who were among the first to adopt this strategy, employed brain tissue cDNA libraries and accumulated more than 2500 unique expressed sequence tags (ESTs).12,13

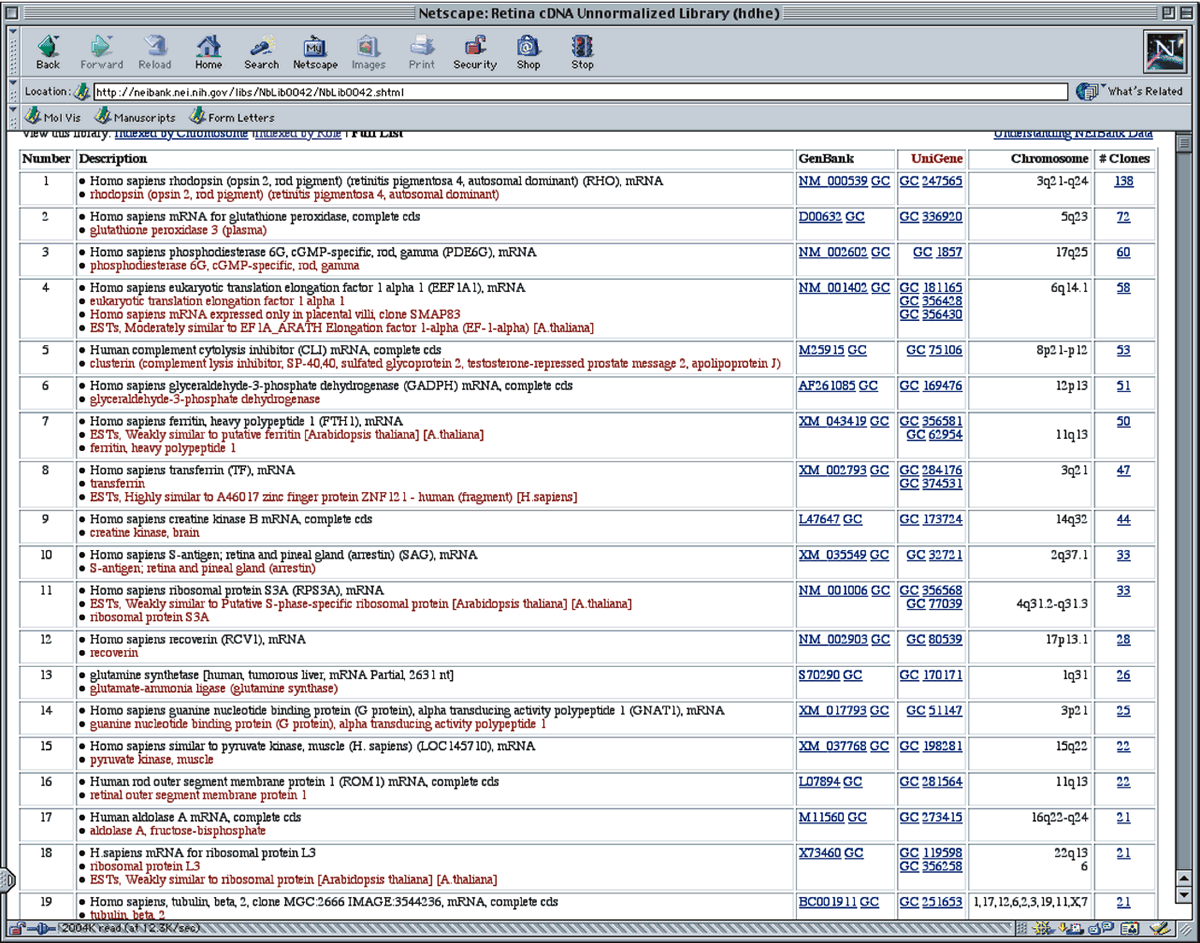
Many genes and cDNA copies of mRNAs expressed in the retina and other eye tissues have now been cloned and sequenced. Groups such as the IMAGE consortium14 have sequenced large numbers of cDNA clones from a variety of tissues including retina, lens, cornea, optic nerve, and trabecular meshwork. These sequences have been entered into the National Center for Biotechnology Information (NCBI) database and are accessible through Unigene; the clones from which these sequences are derived are available through Open Biosystems (Huntsville, AL). In addition, some of these ocular expressed genes are stored as subsets of the complete genome in a separate database archived and maintained at a site called NEIBank.15–19 A consequence for ophthalmology is that large numbers of new eye-expressed genes have been discovered. Each of these genes is a candidate for a cause of inherited eye diseases, with the potential for highly accurate diagnoses. As these lesions are characterized and as the functions of these genes are discovered, the expectation is that potential therapies will be developed.

Genomic libraries are constructed in much the same way as cDNA libraries, except that the insert DNA originates from genomic DNA. Genomic DNA is isolated from any tissue from the body, either germline or somatic tissues. Because this DNA should be large, special care should be taken not to shear it during its isolation. To produce fragments approximately 20,000 bases in size, usually the DNA is partially digested with a frequent cutting restriction enzyme, such as Sau3A, a “four-base cutter” that recognizes GATC and digests or “cuts” before the first G. A vector, frequently based on bacteriophage lambda, is digested with a compatible restriction enzyme, in this case, BamHI, which recognizes GGATCC, cutting between the first and second G. The sticky ends of the genomic DNA and vector match and anneal when mixed together. The insert genomic DNA fragment is ligated into the vector, and the recombinant DNA is packaged into bacteriophage lambda with extracts containing phage components that can reassemble themselves very efficiently into an infectious particle. The particle infects E. coli, grows to produce more infectious phage particles and lyses the host cell, and the daughter phage continue the cycle. A phage particle is plated onto a lawn of E. coli growing uniformly over the surface of a Petri dish, and after a few hours a clear dot (a phage plaque) appears as a hole in the otherwise turbid lawn of bacterial growth. Each plaque (an aggregate of approximately 106 phage particles), which is generated from a single infection by one bacteriophage, is distinct and separate and represents a single recombinant genomic clone. Because there are approximately 3 × 10⁹ base pairs (bp) per human haploid genome, millions of recombinant phages are required to achieve a complete representation of the genome. For some applications, clones containing larger inserts are needed. Cosmid vectors (40 kb inserts) and BACs and YACs (150-kb to 1-mb inserts), which are discussed later, fulfill this need.

Usually a cDNA clone is obtained before a genomic clone is sought. Thus, the cDNA clone is the most frequently used probe to screen a genomic library.

Positional cloning is the next most prevalent strategy used to find a specific genomic clone. Linkage analysis (described later ) provides the location, usually to within approximately 1 to 5 million bases of the gene. To move closer to the gene, several techniques are applied. This approach, formerly called “reverse genetics” and now known as “positional cloning,” simply refers to a strategy using the known chromosomal position of the disease locus to isolate the corresponding gene. This is discussed in detail below.

MICROARRAYS

Northern blot and reverse transcriptase polymerase chain reaction (RT-PCR) assays are powerful tools in the analysis of gene expression levels. These techniques are straightforward, fast, and easy, provided that only a handful of genes need to be analyzed at one time. But what if an expression level analysis of many or even all genes needs to be conducted? A technique has been developed to analyze the abundance of thousands of mRNAs simultaneously. The principle of this technique, called microarray or GeneChip analysis, relies on the specificity of annealing a single mRNA type to a pure DNA sequence. Thousands of different DNA sequences are spotted individually onto a two-dimensional surface where each clone is bound irreversibly. This can be accomplished by spotting each cDNA clone onto a chemically modified glass microscope slide. Each spot contains picoliter volumes of a single pure cDNA. Another way to create the array of pure DNAs is to synthesize oligonucleotides directly onto the glass surface, using photolithographic processes similar to those employed for creating computer chips. Two commercially available chips prepared in this fashion represent over 33,000 genes, approaching the entire repertoire of the human genome. A third variant is to create a macroarray by spotting much larger spots onto nitrocellulose filters.

Once the array of the thousands of different cDNAs is created, the second step is to probe the array with labeled mRNA from the tissue or sample of interest. Several alternatives are available to tag the mRNA. Usually the marker is a fluorescent tag, providing excellent signal sensitivity. A key point is that two or more different probes are prepared. One probe is derived from an experimental condition, and the second probe serves as a control condition, which can be mock, sham, or vehicle treated. Many other experimentally different conditions may be used.

The labeled probe is actually a concoction of thousands of different labeled mRNAs. Each mRNA differs in abundance from the next, and the abundance of each reflects its relative abundance in the sample. The probe is incubated on the surface of the chip in a conventional hybridization mix. Under these hybridization conditions, usually about 52° C and 6X SSC, each different labeled mRNA will hybridize specifically to the fixed amount of DNA on the correctly mated spot on the array. The amount of label bound to the spot reflects the abundance of the mRNA in the sample. Any unbound probe mRNA is removed by washing, much as in Northern or Southern blot analyses. The array is “read” in an instrument capable of detecting the specific label being used in the experiment. The levels of each mRNA are compared in the experimental sample versus those in an identically processed control sample. Thus, in one experiment, which usually takes only about a day, the levels of mRNA accumulation for many thousands and even all genes can be measured.

The utility of this approach is twofold: First, the analysis of genome expression is encyclopedic, as virtually all known genes can be analyzed; second, the work need not be hypothesis driven. Although many National Institutes of Health (NIH) initial review groups find this frightening, horrifying, and appalling, a fishing expedition sometimes can be useful. That is, the global capabilities of microarray analysis may unlock hidden processes that the scientist had not previously envisioned. Microarray results may radically change hypotheses about the mechanism(s) of drug action and disease etiology and may uncover previously unknown metabolic or mechanistic pathways.

Along these lines, Friend and colleagues20 employed microarray analyses to predict clinical outcomes among patients with breast cancer. They analyzed the gene expression patterns of thousands of mRNAs derived from biopsies of primary breast tumors from 117 women. They obtained a “signature” (a pattern of expression from 70 different cDNA clones) from the overall collection of about 25,000 genes. This signature was strongly predictive of a short length of time before distant metastases occurred among patients who were lymph-node negative at the time of diagnosis. The optimized signature contained genes regulating the cell cycle, invasion, metastasis, and angiogenesis. This classifier outperforms the currently used traditional clinical indicators that include histopathology grade, tumor size, angioinvasivenss, and estrogen receptor expression status. The signature is relatively large (70 genes) and remarkably does not include some markers that, by hypothesis-driven notions, one would expect to be included, such as HER/Neu, c-myc, ER-α, and so forth. One important element of this study is in the prediction of which patient will benefit from treatment; the gene expression signature is at least as effective as existing clinical guidelines. The signature is much more effective in finding patients for whom adjuvant chemotherapy would have no benefit. Thus, the signature is currently the best way to prevent unnecessary treatment, which can cause harm in itself. Another implication of the study is that a tumor's decision to spread is cast early, while the tumor is very small. Last, the several genes that are highly overexpressed in the poor prognosis signature may be excellent targets for chemotherapy for breast cancer patients in the “poor prognosis” category.

Expectations are that in retinal and macular degenerations, even when the precise lesion remains unknown, similar microarray analyses may provide signatures of genes indicative of severe or rapid visual loss. The identified genes in the signature may provide analogous targets for drug therapy that might slow or reduce loss of visual function. Although it is clear that the retina should not be biopsied, the results from developing these signatures should be helpful. Also, in animal models of retinal degenerations, across many diseases, we may identify common metabolic pathways that are responsive to drug treatment.

There are a number of potential problems with microarrays:

  1. The labeling technique may selectively favor one mRNA over another, thus distorting the mRNA expression pattern.
  2. Low-abundance mRNAs may not be detected, either because the mRNA is not in the sample or because the minute amount of the label when bound to the spot is below the level of detection.
  3. Microarray analysis requires large amounts of starting mRNA. In some schemes, to make large amounts of probe, the mRNA is amplified by an RT-PCR step. This may cause a misrepresentation of one mRNA for another because of different levels of efficiency in the RT-PCR steps.
  4. An important cDNA may not be present on the microarray. Thus, accidentally, the gene and mRNA cannot be analyzed even though the experimenter thought the gene was present.
  5. Artifacts in the cDNAs. Unwittingly, two cDNAs may be fused and spotted onto the array. Thus, what should be two different signals are combined into one.
  6. Surface effects of the chips. Most chips are flat, two-dimensional solid surfaces with the clone or oligonucleotide bound directly to the surface. Because of steric hindrance at the surface of the chip, the mRNA may be unable to bind to the DNA, and this may result in artifacts. Long cDNAs, long oligonucleotides, or the use of spacers can reduce this type of artifact. Also, a three-dimensional surface can allow for a solution-based hybridization and avoid the steric effects.
  7. Mishybridization. The wrong mRNA may adhere to an incorrect DNA. Increasing the stringency of chip washing conditions can reduce nonspecific binding. Also, the selection of probes that lack partial homologies can reduce misbinding. Mutating the DNA can help to identify improper hybridization. Stringent controls for the preparation of probes is the first line of defense against improper hybridization.
  8. Dynamic range. Only a small amount of DNA is spotted onto an array, and it is possible that the mRNA is in very high concentration relative to the amount of DNA on the spot and saturates it. To circumvent this problem, it may be necessary to run the experiment with two different doses of mRNA, a high probe concentration and a low one.
  9. mRNA splice variants. Many genes can be alternatively spliced, and different tissues may favor one splice variant over another. One way to work around this problem is to employ two different DNAs on the chip, one specific for one splice variant and a second specific for the other variant.
  10. mRNA expression levels are useful, but often the critical information may be the level of enzymatic activity or the amounts of protein present. mRNA microarrays measure steady-state mRNA levels, not levels of protein, enzyme activity, or even the rate of transcription of RNA. Thus, it is critical to know exactly the question being asked in order to decide whether microarrays for measuring mRNA levels are the appropriate technique. The correlation between mRNA level and protein level is about 70%.21
  11. Replication. Because of the expense of microarrays, and because they cannot be re-used, there is the temptation to cut corners on controls and numbers of replicates. The same scientific standards apply to microarray analyses as to any other procedure. Because of the exceedingly large numbers of genes being analyzed, random coincidence may explain why some clones exhibit changes in expression during treatment.
  12. Last, there are potential problems with analysis techniques, data storage and documentation, and standardization among reporting formats so that results across platforms and labs can be compared. In the past, only a handful of genes and mRNAs were being studied at the same time, and the reader could easily compare results. Today, however, thousands of genes are being analyzed simultaneously, and the reader must rely on computers and databases to compare results across several publications.

Despite these problems, microarrays exhibit numerous advantages that outweigh the known difficulties. It is an approach well-designed to exploit information encoded in the human genome sequence and is useful for basic and applied needs.

PROTEOMICS AND CLONING

A proteome is defined as the complete set of proteins produced from the information encoded as a genome. A proteomics-based strategy, based on a combination of mass spectrometry and database searching, has become popular for identifying a protein and obtaining its corresponding cDNA clone. Once the identity of the protein is established, because of the completeness of the human and other genome databases it is often possible to retrieve a cDNA or genomic clone from the original library source. The cDNA also can be obtained by PCR analysis (described later)

The proteomics approach usually begins with finding a spot on a two-dimensional (2D) protein gel that is the unknown protein of interest or that contains a unique biologic activity. 2D gels separate proteins based on the isoelectric point (pI) and molecular weight. An alternative is to resolve a peak by multi-dimensional chromatographic analysis. Often the protein is considered interesting by virtue of being differentially expressed in a developmental or disease state. Once the protein is sufficiently pure and the correct protein spot is found, it is isolated and digested with trypsin. The resulting proteolytic fragments are subjected to analyses in mass spectrometers.

The first such analysis is usually matrix-assisted laser desorption ionization time-of-flight (MALDI TOF) mass spectrometry (MS) This analysis provides experimentally determined masses of each tryptic peptide of the protein to within 0.01% accuracy. The set of masses of the numerous tryptic fragments are a characteristic “actual fingerprint” of the protein and, in principle, can be used to identify it. A database of known and predicted proteins has been derived from the human genome sequence. The masses of each set of tryptic peptides from each known or predicted polypeptide have been calculated from this protein database. The predicted set of masses from each protein in the database provides a “predicted fingerprint” to which the experimentally determined “actual fingerprint” is compared. We then ask whether the experimentally obtained actual fingerprint from the gel spot matches any of the thousands of predicted fingerprints in the database. Theoretically, one, and only one, protein should match perfectly, and this match provides us with the identity of the protein. It also provides us with the sequences of the protein, mRNA, and gene.

There are some drawbacks and potential problems with this approach. First, a critical assumption is that the resolution of the 2D gel is sufficient to assure that only a single polypeptide is contained in the spot. While 2D gel technology can resolve about 2000 different proteins on a single gel, this may not be sufficient resolution if contaminating proteins have nearly the same mass and pI as the protein of interest. Second, the abundance of the protein under consideration may be very low, and it may be necessary to spend substantial time and effort to obtain an enriched protein preparation such that the single spot of interest has no contaminants in it. Third, it is unlikely that every tryptic peptide is extracted from the gel spot. Thus, not every theoretical peptide mass will have a match to a peptide in the experimental data set. Next, it is inevitable that proteins from skin and other sources will contaminate the experimental sample, creating extraneous peptide masses that can confound analyses. However, if we find many peptides matching within 0.01%, this agreement suggests that the unknown protein of interest has been identified. Scoring systems that assess the quality and extent of the matches help to judge the probability that the identified match is authentic, and web-based utilities such as Protein Prospector perform these calculations. If the z-score is above 1.65, then it is highly likely (odds > 95%) that the match is correct.

Finally, much additional work is required to prove the putative identity. Sequencing the unknown protein by Edman degradation or a sequencing based on b- and y-daughter ion series from MS–MS experiments22 is, at a minimum, a firm requirement to establish and validate identity of the protein. Sometimes proteins are post-translationally modified. Under these circumstances the identification of the modifications may be made by additional MS methods22.

Once the protein is identified, in many cases, a cDNA or genomic clone corresponding to the newly identified protein can be obtained merely by ordering the clone from one of several commercial repositories.* A caveat is that these clones may not be complete. However, within days or even hours of identifying the protein of interest, it is possible to obtain at least a partial cDNA or genomic clone.


*Some sources are Research Genetics, Inc., Birmingham, AL; Open Biosystems, Huntsville, AL (which has the National Eye Institute [NEI] sequenced clone collection); and Incyte Genetics, St. Louis, MO.

BIOINFORMATICS AND DNA SEQUENCE ANALYSIS

To acquire the information that a gene contains, we need to determine the sequence of bases in it. The entire human genome has now been sequenced, providing a database of all the approximately 35,000 genes in the human body, a molecular anatomy of the human genome. The sequences of this genetic material are now held in several commercial and public databases.

While there are still some gaps and little of the normal variability of the genome has been assessed, the availability of this sequence has changed the way in which positional cloning is carried out. The genomes of several additional organisms are also near completion. These provide a vast warehouse of useful information that ultimately will be employed in (1) elucidating the specific functions of all the genes, (2) diagnosing disease, and (3) designing treatment of retinal and many other diseases.

Because new sequence entries are shared among databases, submission of an entry to one database should assure that other databases receive a copy of the entry. It is no longer practical to analyze or compare sequences manually. With the devlopment of the field of bioinformatics, DNA sequences are now stored and analyzed by software suited to the given task. Many program packages are available for use on mainframe and personal computers, and several programs are available on the Web for sequence analysis.

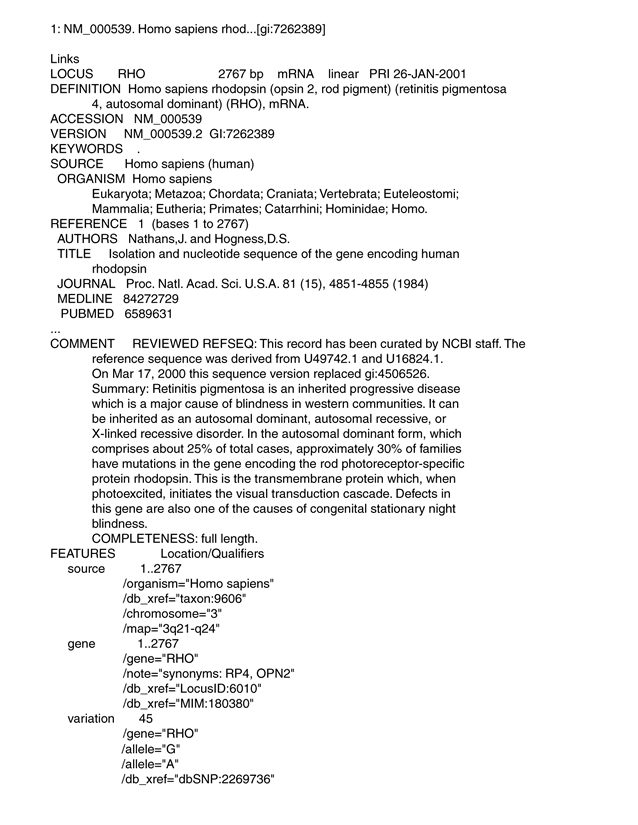
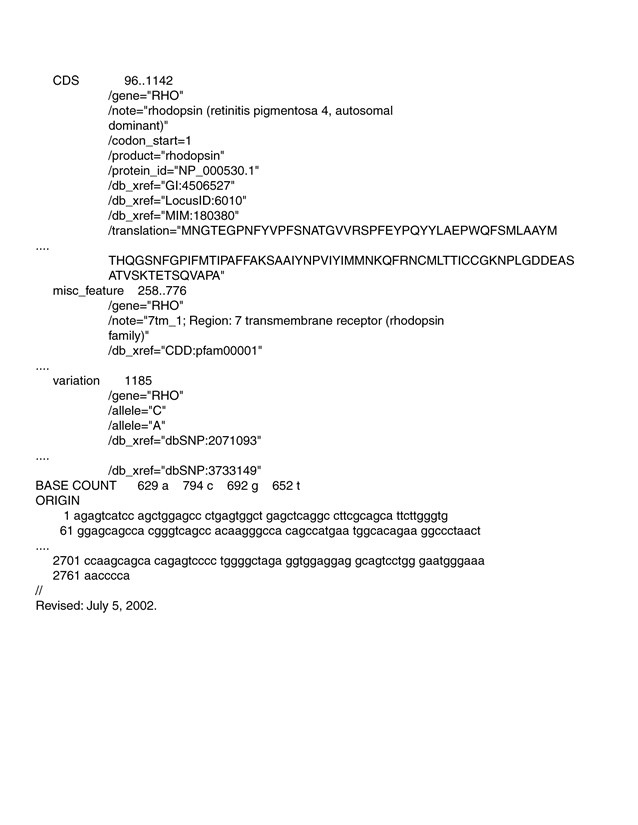
For example, an investigator might need to retrieve all sequences expressed in the photoreceptor. Appendix I shows a partial list of sequence entries in the NCBI-GenBank database (Version 0.2), which were retrieved from the database with the keyword “photoreceptor” using the computer program “STRINGSEARCH” in the GCG program package. Although many entries are detected, other entries related to phototransduction are not listed. Thus, a search must be carefully constructed to avoid missing relevant sequences. A typical sequence entry (in truncated form) is shown in Figure 5. Besides the DNA sequence, a certain amount of header information is supplied, making it easier to identify how the sequence was obtained and to find features within the sequences that may be biologically important. An example of information from NEIBank is shown in Appendix III. This partial printout shows abundant cDNAs found in the retina.

Fig. 5. A typical GenBank database entry. The entry for the human opsin gene is shown, displaying the header information provided for the typical entry and below the DNA sequence of the opsin gene, truncated for the sake of brevity.

DNA SEQUENCE DETERMINATION

Two major methods are used for DNA sequence determination, and both techniques rely on the ability of electrophoresis in polyacrylamide gels under denaturing conditions to resolve DNA molecules differing in length by only one nucleotide. The electrophoresis technique can resolve DNAs differing by one base up to 1200 nucleotides in length, but for practical considerations, usually lengths up to about 600 nucleotides are analyzed. Depending on throughput needs, the gel may be in the form of a thin slab of cross-linked polyacrylamide formed between two pieces of glass; alternatively, thin capillary tubes are filled with linear polyacrylamide, and these serve to fractionate a set of DNA molecules. The latter is more amenable to high throughput analyses but requires a substantial cost in instrumentation. The former is the original method of choice but requires more set-up and hands-on time.

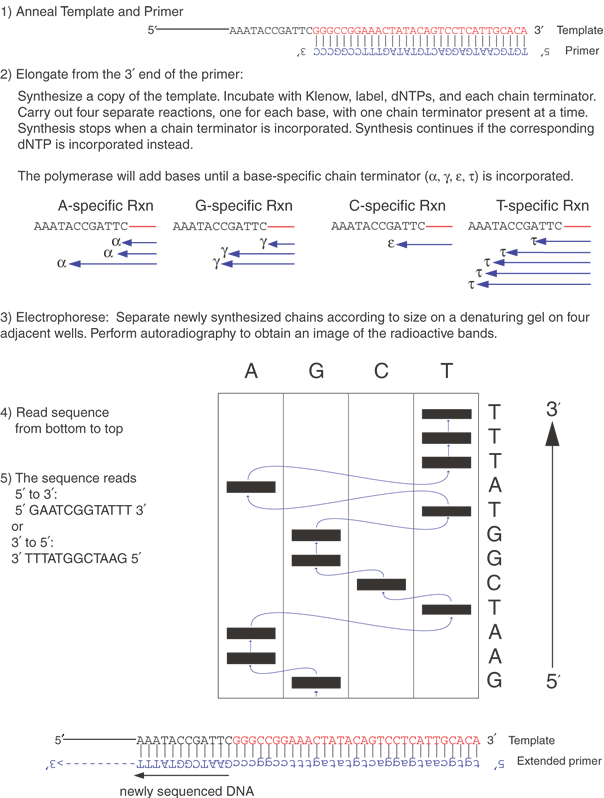
The two DNA sequencing principles are the Maxam and Gilbert24 approach, exploiting partial chemical degradation of DNA molecules, and that of Sanger and co-workers,25 making use of enzymatic reactions that synthesize DNAs of various lengths. Both techniques produce a nested set of related DNA molecules. These sets of DNAs begin at a common end and are identical in sequence, except they differ in size by a one-nucleotide increment at the other end. The synthetic steps of the Sanger method are illustrated in Figure 6. A template DNA is copied by a DNA polymerase that must initiate synthesis from a short oligonucleotide primer (usually 15 to 20 bases) that hybridizes (anneals or forms base pairs) with part of the template DNA. The enzyme requires the four deoxynucleotides, appropriate buffers, and Mg++ ions for the synthetic reaction to take place. Sanger's key idea was the incorporation of a mixture of dideoxynucleotides and deoxynucleotides into the growing chains of DNA. The absence of a 3' hydroxyl group in the dideoxynucleotide prevents the chain from elongating any further, terminating its growth once a dideoxynucleotide is incorporated. This termination generates a DNA chain of a distinct length. By mixing appropriate ratios of a deoxycytosine triphosphate and its corresponding dideoxynucleotide, dideoxycytosine triphosphate, a spectrum of DNA chains is produced with all chains starting at one spot (determined by the location of the primer) but with some chains terminating at each cytosine in the sequence.

Fig. 6. DNA sequence analysis by the chemical synthesis method of Sanger.25 All genetic information is encoded in the sequence of bases of DNA. The method developed by Sanger and colleagues is outlined here. A pure source of template DNA and a pure primer that anneals to the template are required. Synthetic reactions make copies of the template DNA. An amount of dideoxynucleotide is included in each of four separate reactions to terminate the newly synthesized DNA chains. In the figure, the terminators are represented by the Greek letters α, γ, ε, and τ, which represent dideoxyadenosine, dideoxycytosine, dideoxyguanosine, and dideoxythymine, respectively. In each reaction, the ratio of terminator to normal deoxynucleotide is tuned so that for each reaction adequate amounts of terminated chains from 1 to approximately 400 bases in size are synthesized. These chains also are radioactively labeled during this synthesis step. We resolve these chains by running a urea-polyacrylamide gel, which is capable of resolving DNA molecules differing in size by only one base. We load the gel with the four different reactions side by side. After electrophoresis for a few hours, we obtain an image of the radioactive bands by autoradiography. The pattern of bands looks like a ladder. The bands at the bottom are the shortest DNA molecules, and we “read” the DNA sequence by starting at the bottom of the gel and stepping up one band at a time, shifting from one of the four lanes to the next, moving to the immediately higher band. The direction of synthesis is always 5' to 3', and the order from bottom to top of the gel is consequently also 5' to 3'.

Separately, three other syntheses are carried out for each of the other deoxynucleotide and dideoxynucleotide pairs. This produces a full set of DNA fragments, all starting at the same point but ending at each base position of the DNA fragment being sequenced. Because of the small amounts of material being synthesized, a chemical label, or tag, is incorporated into the DNA during synthesis. For small-scale projects, the usual tag is radioactivity, which allows the DNA to be detected by autoradiography. The isotope most commonly used for DNA sequencing is 35S; it emits a β-particle that interacts with the emulsion of x-ray film placed on top of the sequencing gel, with the resulting image of the gel shown on the autoradiogram. For larger-scale sequencing projects (and increasingly even small projects), automated systems using fluorescent-labeled nucleotides now allow rapid and highly efficient sequencing of large amounts of DNA; hundreds of automated fluorescence-based sequencers were used to sequence the human and mouse genomes.

The principle of chemical degradation sequence determination is partial degradation of DNA in four separate reactions, with each reaction specific for a different base. DNA is first labeled with a radioactive tag at one end and then subjected to the four degradation reactions. The reactions break the DNA at one specific base per strand. Because excess nonradioactive carrier DNA is included in the reactions, only partial degradation of the radioactive DNA occurs, ensuring that chain cleavage is random along the length of the DNA chain. The degraded chains form nested sets of molecules differing in length by only one base, and the products can be analyzed by acrylamide gel electrophoresis. Otherwise, the analysis of the products of the Sanger and the Gilbert method is very similar.

Sequences larger than the typical 600-base reading are obtained by assembling overlapping sequence readings. The overlapping readings can be obtained by using a different primer, subcloning different DNA fragments, or using another trick, such as transposing a primer annealing site into other parts of the DNA insert. The redundancy inherent in overlapping sequence readings contributes to the accuracy of the completed sequence. To further heighten the quality and reliability of the sequence information, the sequence of each strand of the DNA is determined. Each strand complements the other; that is, an A on the first strand always forms a base pair with a T on the complementary strand, and C pairs with G on the other strand. Mistakes in interpreting gel readings or other ambiguities (sequence artifacts) from one strand usually do not occur at the corresponding position of the other strand. On occasion, the accurate determination of certain sequences remains troublesome, for example, regions very high in G + C content, but several methods have been devised to read these areas. These include the use of different polymerases, higher temperatures, and nucleotide analogs to aid in the sequencing elongation reaction. Also, higher temperatures during electrophoresis and inclusion of more potent denaturation agents in the acrylamide gels can help to prevent unusual structures in the DNA that may cause incorrect mobility in the gel or capillary. Last, a switch from the Sanger to the chemical degradation method may aid in determining the sequence. Sequences should be greater than 99.9% accurate.

ALTERNATIVE SEQUENCING METHODS

Other methods26 for DNA sequencing have been suggested, and three of these are worthy of discussion here. Common attributes of the three include (1) the analysis of single molecules of DNA, obviating the need to amplify or clone DNA prior to sequence analysis, and (2) no requirement for chemical degradation or synthesis to obtain a nested set of DNA molecules.

In atomic force microscopy, one of these methods, because the four bases of DNA are shaped slightly differently, an atomic force microscope trace of a fragment of DNA theoretically can be used to decode the sequence.27 This technique currently resolves DNA of about 10 bp lengths,15 which is not sufficient for sequence analysis. Progress has been made to enable haplotyping of alleles.16

The second method employs a lipid bilayer containing a pore of hemolysin. DNA is driven through the pore by an electric field. Ideally, as each base passes through the pore there should be a slight fluctuation in current characteristic of the base that is passing at that instant. The sequence could be read by monitoring these small current changes with time.17 As yet, however, only short homopolymeric sequences can be differentiated.

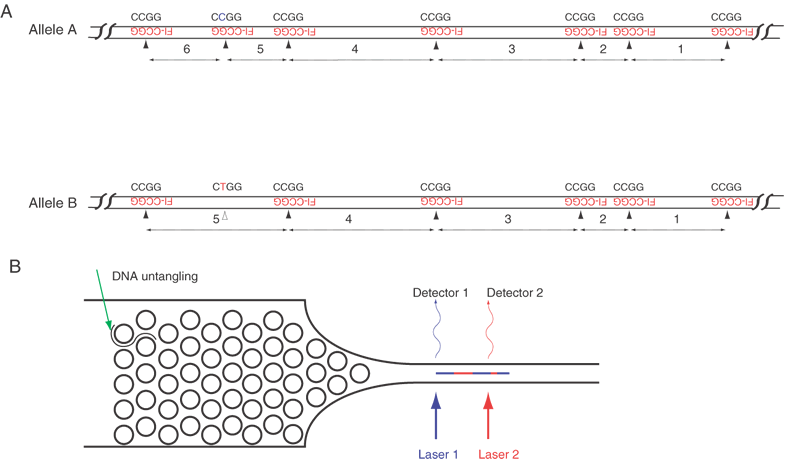
The third method relies on the hybridization of very short probes to a single long DNA molecule. The probes currently are tetramers labeled with a fluorescent tag. On average, any given tetramer will hybridize to DNA every 256 nucleotides, but due to the vagaries of any sequence, the interval between each complementary binding site of the tetramer varies, just as the pattern of restriction sites generates different-sized DNA fragments. Unlike restriction site analysis, however, the present system simultaneously determines not only the length of each interval between tetramer binding sites but also the order of these intervals. Figure 7 shows an example. With 256 different tetramers, every nucleotide in any sequence would be covered by hybridization. In principle, large genomes could be sequenced by this hybridization approach.

Fig. 7. Polymorphism detection in a single DNA molecule. Panel A. A fluorescently tagged tetramer (Fl-CCGG in red) is annealed to a genomic DNA fragment. Two different alleles are illustrated, with Allele A having one extra site and Allele B lacking one site. For the sake of clarity, only tetramer binding sites on the upper strand of DNA are illustrated. In comparing two alleles of the same fragment, sequence variations can be detected. Allele B has exactly the same fragment size and order as Allele A for the first 4 fragments, but fragment 5 is larger in Allele B, and Allele A contains two fragments (5 and 6) in place of Allele B's single fragment 5. A critical point is that the former two from Allele A add up to the same size as Allele B's fragment 5. Panel B. The hybridized probe-DNA complex is straightened in the funnel by catching on several pegs. The DNA passes by one or more fluorescence detectors. The DNA molecule moves across the detector at a constant rate of about 1 cm/sec. Because the DNA is straightened and in line with flow, the time elapsed from the detection of one fluorescent probe to the next reflects the number of bases between two adjacent tetramer binding sites. The order and sizes of the fragments can be recorded and compared with the predicted pattern of tetramers from the known human sequence. This identifies the location and length of the fragment.

This method begins with hybridization of tagged tetramers to isolated DNA, followed by determination of the positions of the hybridization signals. By passing a single DNA molecule lengthwise through a detector, the positions of the hybridized tags along the DNA are recorded. The steps of the technique are, first, to prepare genomic DNA or DNAs from BAC or YAC clones by conventional means. Second, labeled tetramers of the same sequence are hybridized to a long DNA fragment, resulting in a set of tags along the DNA. Third, the tagged DNA molecule is untangled by passing it through a flat funnel-shaped microchamber containing a regular array of tiny posts. Each post is about 100 nm in diameter (the chamber is formed using the approach of nanotechnology similar to those used to manufacture silicon chips). The DNA collides with and is transiently caught on one of the many posts, stretching the DNA to either side of the post. As the DNA is pushed forward, it untangles a bit and falls onto another post. The series of collisions with several posts eventually untangles the DNA, rendering a linear molecule oriented lengthwise in a narrow channel at the far end of the funnel. The diameter of the channel is fine enough to keep the DNA correctly oriented, that is, straight and free from loops or crumples.

Fourth and last, positive pressure forces the DNA through the channel at a uniform flow rate, past a series of lasers, which excite the fluorescently tagged tetramers as each site on the DNA molecule passes by a detector. The time interval between two fluorescence events indicates the number of bases between two adjacent tetramer binding sites, and, in a long sequence, many intervals between tetramer binding sites are identified. In comparing the ordered set of intervals to the known human genome sequence, the particular DNA fragment is identified. An important byproduct of this analysis is that any missing or extra tetramer binding sites (besides the ends) suggest a sequence variation in much the same way as the appearance or absence of restriction enzyme site in RFLP analysis.

This method should allow rapid polymorphism typing, and it specifies which polymorphisms are inherited on the same chromatid. A second advantage of thistechnique is the rapid flow of DNA past the lasers and detectors. Currently, a DNA strand moves past the detector at a linear flow rate of 1 cm/sec (or about 30 million bases/sec). At this rate, the entire genome from one individual could be analyzed in 100 to 200 seconds. A third advantage is the tiny amount of DNA that is required, suggesting that cloning or DNA amplification may not be necessary. A fourth advantage is the possible development of multichannel instruments, because the techniques for creating funnels and microchannels appear to be amenable to parallel microfabrication.

Current disadvantages include the requirement for an entire collection of 256 probes to determine a full sequence. Although simultaneous hybridization with several tetramers can be conducted by employing several different tags that fluoresce at different wavelengths, it appears infeasible for a full set of 256 probes to be hybridized and analyzed simultaneously in a single run. It may be possible to reduce the size of the tags from 4-mers to 3-mers by using nucleotide analogs that melt at higher temperatures, concomitantly reducing the total number of probes from 256 to 64. Another problem is that DNA fragments that are too short may tumble in the microchannel; therefore, there is likely a minimum acceptable length of the DNA to be analyzed. From an efficiency standpoint, the DNA molecule should be as long as possible. However, it is easy to mechanically shear high molecular weight DNA, and it may be difficult to untangle DNAs larger than a million base pairs without breaking the DNA with the post method. Routine sample preparation, prior to introduction into an instrument, also can break DNA. Special precautions are necessary to prevent shear forces as DNA is isolated from cell nuclei. Last, it is not clear how a knotted DNA could be eliminated or excluded from analysis.

Despite the disadvantages of these new DNA sequencing approaches, they all exhibit desirable features, and in the long run they may vastly reduce the time and expense of current DNA sequencing techniques. They offer the promise of “personal sequencing” in which a single individual's genome could be completely analyzed to test for a host of genetic diseases and hereditary risk factors or traits. Many areas of the genome are currently difficult to sequence because they cannot be cloned. Other sequences are difficult to sequence because present-day polymerases stall in attempting to pass through these DNA stretches. Other regions contain many repeats that are difficult to piece together by current sequence-overlap assembly methods. The three methods discussed here largely circumvent these common sequencing problems, and these new approaches should enhance the quality of the human and model genomes and their databases.

DNA RESEQUENCING

In some circumstances, both in basic research and clinical practice, one might not wish to sequence large parts of the genome, but might rather wish to sequence the same DNA multiple times. That is, one might need to screen a large number of patients for potential mutations in one or a few genes associated with a disease. It is possible to carry out screening using a variety of technologies based on the differing secondary structures caused by changing even a single base in a DNA sequence, such as single-strand conformation polymorphisms (SSCPs), denaturant gradient gel electrophoresis (DGGE), and DNA analysis using high-pressure liquid chromatography (HPLC) (these techniques are described in detail later in this chapter). However, these techniques have differing rates of detection of sequence changes and also require sequencing of the DNA once a variation is found.

In some cases, especially those in which very large numbers of samples are to be analyzed and frequent and variable sequence changes are anticipated, it is more efficient to proceed directly to sequencing each sample. Although this can be carried out using standard technology described previously, even high-throughput DNA sequencing is relatively expensive and somewhat inefficient compared to a true screening technology. However, the microarray approach described previously provides a potential answer to this difficulty.28 One can spot (or use photolithography to synthesize) overlapping oligonucleotides advancing by a single base to cover a whole gene (or several genes) on a DNA microarray. Each oligonucleotide is present in quadruplicate, with each possibility for the central base represented in a separate position. Then, if the microarray is hybridized with a copy of the target gene labeled with fluorescent nucleotides and washed under stringent conditions, hybridization to the exact sequence match will be highly favored over that of oligonucleotides containing a mismatch. By comparing hybridization to each possible nucleotide at each position along the DNA to be analyzed, the entire DNA sequence can be obtained with high accuracy in one hybridization. Current technologies allow sequencing of up to 60 kb on a single chip, making this a very competitive technology for large projects. A variation of this technique uses primer extension with fluorescently labeled nucleotides to provide corresponding sequence information.29

POLYMERASE CHAIN REACTION

The PCR is a favorite tool in molecular biology. The PCR technique makes practical the analysis of trace amounts of patient material, and reliable results are available in a short time (1 to 2 days). In some circumstances reliable data can be obtained in less than an hour. This technique has extended our analytic capabilities of DNA more than any other.30,31 PCR analysis amplifies a discrete sequence without the need to clone the DNA fragment. PCR techniques can amplify a sequence by a millionfold, allowing analysis of just a few molecules of DNA. When combined with other techniques, it allows sequence analysis, cloning, and almost any other enzymatic manipulation of the amplified sequence. It has made possible the concept of sequence tagged sites (STSs) (described later). DNA specimens suitable for use in PCR assays can be obtained from almost any tissue: blood, parts of histologic sections, buccal mucosa, hair follicles, anything with a nucleus, or in the case of a mitochondrially encoded gene, any tissue remnant with mitochondria. Ancient DNA samples, up to thousands of years in age, have been used as well. With adequate precautions to avoid contamination, the analysis of DNA from a single cell can be accomplished.

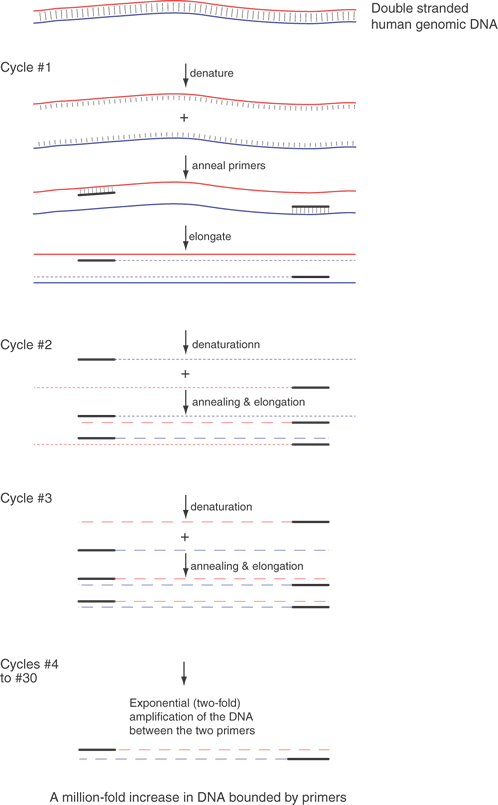
The basic technique for the PCR assay is shown in Figure 8. Amplification of sequences with PCR analysis is a simple concept. Two specific oligonucleotides, the “primers,” base-pair to opposite strands of a DNA sequence called the “template.” The primers are about 20 bases in length, are usually less than 10 kb apart, anneal to opposite strands of the template, and are oriented 5' to 3' pointed inward. . The primers allow a DNA polymerase to initiate synthesis of new DNA that is a complementary copy of the original DNA strand. The primers are mixed with the template DNA (usually total genomic DNA containing the target sequence) in an appropriate reaction buffer with a heat-stable DNA polymerase isolated from thermophilic bacteria. The template DNA is denatured by heating the sample to 94°C, and the temperature is dropped to an “annealing temperature,” an experimentally optimized temperature at which the primers begin to anneal to the template DNA. This temperature is usually near the theoretical Tm, which can be calculated based on the DNA sequence. The Tm is the temperature at which 50% of a primer is base-paired to its complement and 50% remains single-stranded in solution. Because the oligonucleotides are present in vast excess, they successfully compete with one template strand for the target site on the opposite strand. The oligonucleotide primers are extended or elongated, usually at 72°C, oriented 5' to 3', copying the sequence of the target DNA. The reaction is conducted for about 30 sec at each of the three temperatures. The cycle (consisting of the three essential steps—denaturing, annealing, and elongating—in order) is repeated 20 or more times. Theoretically, each cycle doubles the number of target sequences, because newly synthesized DNA fragments can then act as templates for the primers. The PCR is exponential until reagents for DNA synthesis in the reaction run out.

Fig. 8. The polymerase chain reaction (PCR). Amplification of a small amount of DNA from any of several different tissue sources by PCR assay has proved to be an invaluable aid to modern molecular biology and genetics. The steps in the PCR process are shown here. The reactions use several different temperatures to allow first denaturation, melting, of DNA strands from their normal double-stranded state into single strands. The second step is to anneal synthetic primers that bind to the melted DNA. The third step is to elongate and copy the template strands into new DNA in an elongation step. We cycle among the three steps at three different temperatures. Each temperature favors a different property: denaturation at 94°C, annealing at about 55°C, and elongation at 72°C. Usually 25 to 40 cycles are sufficient to synthesize enough DNA for easy visualization of the product by staining with ethidium bromide. In cycles beyond the third one, the PCR accumulates the desired product in exponential fashion. The first three cycles accumulate some newly synthesized DNA strands that extend beyond the end of one or the other primer, but these are of little consequence at the end of the amplification.

Because each primer provides the same beginning, all the amplified products have uniform ends. However, Taq polymerase adds an extra unpaired A. This property is used to subclone fragments into a vector with a complementary protruding T.19

The fundamental limitation of PCR analysis is the requirement for sequence information on either side of the DNA sequence of interest. In certain circumstances only sequence information from one end of the region of interest is needed, but for optimal results and in typical PCR conditions, it is best to have a sequence from both ends of the region to be amplified. Because of the specificity and fidelity of PCR analysis, this amplification reaction can replace far more tedious recombinant DNA techniques, including cloning, library screening, and Southern blot techniques. The products of the PCR can be used to analyze and define gene defects and to define and use polymorphic DNA sequence variations. Analysis of the samples after PCR amplification is easy and uncomplicated. The PCR product can be sequenced directly. It can be analyzed by any of several electrophoretic techniques designed to exploit variations in the mobility of DNAs (discussed later). Finally, the amplified sequence can be subcloned and used in any way that any other cloned DNA fragment might be used.

Many creative embellishments have been coupled to the PCR technique. To quantify small amounts of a specific RNA found in tiny amounts of tissues or tumors, the PCR can be coupled to the reverse transcription of RNA. For example, a hundred cells laser-captured from the photoreceptor layer of the retina can serve as a source of RNA. RNA isolated from the cells is copied into cDNA by reverse transcriptase. The cDNA can then be amplified by PCR analysis. If fixed quantities of standards, either RNA or DNA, are similarly treated, the amount of an mRNA can be calculated. These measurements can be made on the fly. An example is shown in Figure 9.

Fig. 9. Reverse Transcriptase coupled to PCR. One of the most important uses of the PCR is to measure the amounts of a specific mRNA. Changes in the accumulated levels of a specific mRNA can be highly diagnostic of disease processes, for example in the prognosis of breast cancer.20 To accurately and precisely measure the level of a specific mRNA, total RNA from a tissue is copied into cDNA with reverse transcriptase and a specific primer (Primer 1 in the illustration). A second specific primer (Primer 2) is used to initiate elongation of the cDNA with Taq polymerase or a related temperature-stable polymerase. A double-stranded cDNA results from these two steps, and the same primer pair is used to continue the PCR. Provided that the reaction is not cycled so many times that the substrates are depleted, the amount of PCR products is proportional to the starting concentration of the mRNA of interest. By carrying out simultaneous reactions with standard amounts of the specific mRNA, a calibration curve can be generated to calculate the absolute amounts of starting mRNA. This allows precise measurements of the changes in mRNAs in response to drug treatments, experimental manipulations, or disease courses.183

Single-base sequence variations can be analyzed by PCR assay. Suitable oligonucleotides flanking a base change are used to prime the PCR, amplifying the included region by as much as a millionfold. Within limits of approximately 100 bp to several kb, the size of the amplified fragment can be adjusted for convenience in the analysis, especially if multiple loci are to be analyzed simultaneously. Once the target sequence is amplified, it can be analyzed in several ways. Most directly, the PCR sample can be digested with an appropriate restriction enzyme for the base change, subjected to gel electrophoresis, and visualized by staining with ethidium bromide or other dye that fluoresces only when bound to double-stranded DNA. This provides an efficient and reliable analysis without requiring radioactive label. This technique is shown in Figure 10. Another approach is to employ one primer that contains a perfect match to one allele but that bears a single base mismatch at the 3' end with the other allele. This primer provides a specific amplification only when the perfectly matched allele is present. By analyzing PCR product accumulation after each cycle, typing of an individual can be carried out. The patient's status as a double homozygote for one allele, a homozygote for the other allele, or a heterozygote can be accomplished (Fig. 11).

Fig. 10. A DNA polymorphism detected by a restriction enzyme. Individual A is a homozygote for one allele; individual B is a homozygote for the other allele. Individual A has a central Msp 1 site, CCGG, whereas individual B has lost the site due to a single base change of C to T, changing the recognized CCGG sequence to CTGG. On electrophoresis individual A has bands 1 and 2, while individual B has a single band, band 3, the size of which is the sum of the sizes of bands 1 and 2. Offspring of A and B are heterozygotes and have one of each of the alleles and all three bands. On Southern blot analysis with a probe indicated by the black bar, only bands 1 and 3 are detected. Band 2 does not contain sequences to which the probe can hybridize. Thus, on autoradiography (radiolabeled band) we will detect only band 1 in individual A, only band 3 in individual B, and bands 1 and 3 in individual C.

Fig. 11. Allele-specific PCR by endpoint analysis. Panel A. Allele A and Allele B can be distinguished by PCR assay provided that an allele-specific primer (with a perfect match to one allele and a single base mismatch at the other allele) is known. In the illustrated case, a 3' terminal G matches perfectly to a C in the upper strand of Allele A, and the 3' G mismatches with a T on the upper strand of Allele B. Under optimized conditions for the PCR, the reaction can be tuned to produce large amounts of PCR product from allele A with little or none from Allele B. Panel B. Electrophoretic analysis of PCR products from individuals who are homozygous for Allele A (A/A), heterozygous for Alleles A and B (A/B), and homozygous for Allele B (B/B). A heavy PCR band is expected for any A/A individuals, about half as much product is expected for heterozygous (A/B) individuals, and no product is expected from homozygous (B/B) individuals. The electrophoretic gel analysis allows the measurement of the size of the PCR product, and it should be the expected size. The product can be restriction digested to test whether the product has the anticipated restriction enzyme sites, and the product can be sequenced to further validate the its. Several possible artifacts of the PCR process are illustrated in Panel B. Primer-dimers can occur if the primers can bind to each other. Because of the high concentrations of the primers in the PCR, there is a propensity for the primers to bind to each other even when just few bases near the 3' ends of the primers match each other. The primer dimers are detected near the bottom of the gel corresponding to the sum of the lengths of the primers, usually about 40 base pairs. Increasing the annealing temperature and decreasing the concentration of the primers may reduce the amount of primer-dimers. The far right lane [labeled B/B (too many cycles)] illustrates several other potential PCR artifacts. These are usually most noticeable when the PCR is subjected to too many cycles. In most cases, with 10 ng genomic DNA, a PCR is complete by 25 to 30 cycles. In certain circumstances it may be necessary to run the reaction for more cycles, and under those conditions a series of artifacts may be detected. One artifact is that after too many cycles, reagents and substrates will become rate limiting and products may not be completely copied. These partial products can be detected at many intermediate sizes, from very small to nearly full size. Also, after being subjected to repeated heating, contaminants in the reagents may reduce the specificity of the annealing, and mispriming can occur. This may lead to the formation of a full-ength PCR product, even in the presence of only Allele B DNA. Thus, the PCR must be optimized for the number of cycles to maximize the yield of the A/A product, minimize the amount of any B/B product, minimize primer-dimers, and minimize any incomplete products. The optimization process usually titrates the number of PCR cycles, annealing temperature, concentrations of primers, Mg++ ions, buffers, and type and amount of polymerase. Usually, several candidate primer pairs are tested.

One limitation of the PCR technique is that the polymerase used sometimes misincorporates the wrong nucleotide. Thus, care must be taken when single PCR products are subcloned and analyzed by DNA sequencing or restriction analyses. At least three clones must be analyzed to ensure that the correct sequence has been obtained. When the entire PCR product is analyzed directly, this low frequency of errors is of little import. Several different polymerases are now available, including Pfu, Vent, and Hot Tub polymerases, which have lower error rates than Taq polymerase.

POINT MUTATION DETECTION

Point mutations are variations at one base. These can be detected if they fall in restriction enzyme recognition sites as described in the section on RFLPs or by several other techniques, also described in this section. Each of these techniques has advantages and has played a role in developing polymorphic markers in the past decade.

Orita and associates32 developed an approach for detection and identification of single-base changes called single-stranded conformation polymorphisms (SSCPs). Amplified DNAs are denatured by boiling and allowed to renature in dilute conditions that favor intramolecular interactions rather than allowing double-stranded complexes to form. Sequences that are identical except for a single-base variation may form similar, but not identical, secondary structures. Frequently, the free energy of the most stable structures may be very close, but the secondary structures may look entirely different. Inclusion of 10% glycerol, different detergents, or variation of the temperature at which a gel is run can markedly enhance the differences in mobility of two related DNA species. Although renaturation conditions must be optimized to maximize the differences in mobilities of two nearly identical sequences, once found, the technique is rapid and simple.

Heteroduplex analysis can be carried out directly after PCR amplification by the addition of one extra cycle of heat denaturation and slow cooling. In an individual who is a heterozygote for a point change, three types of annealed DNA duplexes will form. One pair of DNA strands will be homogeneous for allele 1 sequences (a homoduplex), another homoduplex pair will be homogeneous for allele 2, and the third pair will be a heteroduplex of one strand from allele 1 and the other strand from allele 2, as shown in Figure 12. The homogeneous strands of both alleles usually run with identical mobility on a polyacrylamide gel; however, the heteroduplex usually runs slightly slower. This decrease in mobility is due to the lack of the hydrogen bonding of bases at the point variation, creating a “bubble” in the middle of the double stranded DNA. Again, the conditions of electrophoresis can be optimized to maximize the mobility difference of the homogeneous DNAs compared to the heteroduplex structures.33,34

Fig. 12. Heteroduplex analysis: Detection of single-base variations, either mutations or polymorphisms. Suppose that an individual is a heterozygote for a single-base change, A to G. To detect the heterozygous state, we can use several different techniques, two of which are illustrated here. Assume that we amplify the region bounding the base change. By heating the resulting DNAs, we will obtain four different double-stranded DNAs; two of the four will be perfect matches, and the two others will be so-called heteroduplexes. The heteroduplexes contain single base–pair mismatches, and no hydrogen bonding occurs at the mismatch. Simple electrophoresis in some conditions allows us to resolve the perfectly base-paired DNAs from the heteroduplexes. This is illustrated on the left. The nonbase-paired heteroduplex bases are more susceptible to strand modification by reagents frequently used in Maxam and Gilbert sequencing. These weaken the DNA, and it is selectively broken at that spot by piperidine. The broken strands have very different mobilities on a urea acrylamide (sequencing) gel from the those of the homoduplexes. All possible substitutions can be detected with this method, although it requires extra steps.

Newton and co-workers35 applied chemical degradation reactions to modify selectively the nonpaired bases of the heteroduplexes and then break the DNA strands at the modified bases.36 The heteroduplexes are cut into two or more smaller fragments of DNA, distinguishing heterozygotes from the homozygotes, as shown in Figure 13. A similar technique consists of hybridizing RNA complementary to one allele with sample DNA.37 The RNA-DNA hybrid is then treated with RNase A. If even a single base mismatch exists, the RNA will be cut, and the sample can be analyzed by gel electrophoresis. This is similar in principle to the analysis of DNA-DNA hybrids by modified Maxam-Gilbert sequencing reactions, in which strand breaks occur preferentially at mismatched bases.36

Fig. 13. Denaturing gradient gel electrophoresis (DGGE) and thermal gradient gel electrophoresis (TGGE). Another approach to analysis and detection of single-base changes is the exploitation of the difference in melting behavior resulting from a single base change. PCR-amplified products are used as before except that one primer contains an extra sequence at the 5' end, which is G + C rich. This sequence when amplified is called a G-C clamp, and it melts at very high temperature in comparison to the typical sequence adjacent to it. In DGGE, the typical sequences will melt at varying denaturant concentrations along the solvent gradient. When they melt, the structure becomes Y-shaped because of the very stable G-C clamp. The resulting Y-shaped structure migrates extremely slowly in the gel. The gel contains a linear gradient of a chemical denaturant, urea, more concentrated at the bottom than the top. Thus, a double-stranded DNA migrates at its normal rate in a gel until it encounters a urea concentration high enough to partially denature the double-stranded DNA into the Y-shaped structure, and then it appears to stop. Different DNA sequences will migrate to different points along the urea gradient before converting to the Y-shaped structure. If two sequences that differ only by one base are run side by side, it is difficult to predict which will stop migrating sooner, but we might expect that one with an A : T base-pair would melt before an identical sequence excepting for a G:C base pair. However, heteroduplexes (double-stranded sequences containing one or more mismatches) with even a single mismatch of an A with a C or a G with a T would be expected to form Y-shaped structures at considerably lower concentrations of denaturant than strands that are perfectly matched and that bear the same flanking sequences.  Similarly, in TGGE there is a temperature gradient within the gel increasing from cathode to anode; that is, the gel is hotter at the bottom than the top. The temperature gradient replaces the chemical denaturant gradient required in DGGE. The heteroduplexes melt at a lower temperature than the homoduplexes, at about 1.5°C per 1% difference; thus, a single-base change results in a significant change in the denaturation point. Following PCR assay, a heterozygote (shown here as an A to G substitution, in otherwise identical sequences) sample will contain four different pairs of sequences: two homoduplexes (1:1 and 2:2), and two heteroduplexes (1:2 and 2: 1). Homozygous individuals (1,1 and 2,2) are shown for comparison. Their predicated mobilities on DGGE and TGGE are indicated.

Techniques dependent on melting hybrids or snapback regions of a DNA strand, such as denaturing gradient gel electrophoresis, have been useful.38 Denaturing gradient gel electrophoresis (DGGE) and thermal gradient gel electrophoresis (TGGE) are similar techniques designed to identify the differences of the heteroduplexes and the homoduplexes. Denaturing gradient gel electrophoresis allows reliable identification of single-base changes in a DNA fragment up to 1 kb in size. These techniques are illustrated in Figure 13. DGGE and TGGE are based on the principle that the heteroduplex, because of its one mispaired set of bases, is less stable than a homoduplex. By performing electrophoresis of these DNAs in an increasing gradient of either temperature (TGGE) or concentration of denaturant (DGGE), the heteroduplex will partially melt before the homoduplexes. Together with the property that Y-shaped and partially denatured DNAs are much less mobile than double-stranded DNA, this makes identification of heterozygotes straightforward. The stem of the Y-structure is engineered by a G-C clamp that provides a very stabile double-stranded region. This region is added by incorporation of a G + C– rich sequence at the end of one of the oligonucleotide primers. The heteroduplexes, becoming Y-shaped earlier during electrophoresis, appear as slower moving bands than the homoduplex samples that convert to a Y shape much later during the run.

Denaturing high-pressure liquid chromatography (DHPLC) has become a standard method for the analysis of point or short mutations in known sequences. Frequently these are polymorphic markers, but unknown mutations can be identified using the same approach. In DHPLC, PCR-amplified DNAs containing the polymorphism are allowed to bind to bind to a resin by ion-pairing. In an elevating temperature gradient, homodimers elute from the resin at certain well-defined temperatures and heterodimers elute at slightly different temperatures. These elution profiles are highly reproducible. Websites are devoted to the prediction of the best primers to use for optimum separation of the homo- and heterodimer complexes (see for example, http://insertion.stanford.edu/melt.html).

None of the previous methods requires à priori knowledge of the precise base change. If this information is available, other methods become very useful as well. Many polymorphic base changes do not occur in the recognition sequence of any restriction enzyme. These can still be analyzed by PCR assay with the use of allele-specific oligonucleotide (ASO) hybridization. In particular, differential hybridization can be used with mutant, wild-type, or allele-specific probes. Oligonucleotides of 17 to 19 bp in length are designed to be complementary to each allele at the variable site. These oligonucleotides usually vary at a single base near the middle of the fragment. PCR assay is performed on the sample DNA as above with the usual priming oligonucleotides, and the sample is subjected to gel electrophoresis and Southern transfer or to slot blot analysis. Hybridization is performed under permissive conditions, followed by a stringent wash step, which dissociates any mismatched complexes, allowing a positive signal only in the presence of the allele homologous to the labeled ASO. Temperatures for washing blots can be adjusted so that only hybridization of the perfectly matching oligonucleotide probe occurs. The difference in washing temperature can be determined empirically to make the differentiation and in practice is about 4 °C. With this technique, any single-base change in the genome can be analyzed efficiently and dependably.

Another means to detect variations is the use of an oligonucleotide with the 3' terminal base as the mutation or sequence variant. This can be used to differentially amplify only one allele in the PCR. This is known as allele-specific PCR (ASPCR)39 or allele-specific amplification (ASA).40 Competitive oligonucleotide priming (COP) is closely related.41 Figure 14 shows an important variant of this approach that can provide more quantitative information on allele frequencies in pooled samples. This approach is called allele-specific real time PCR (ASRTPCR).

Fig. 14. Allele-specific real-time PCR. Panel A. A single nucleotide mutation can be detected by allele-specific PCR, if the single nucleotide change is known in advance. One of the two primers is chosen so that its 3' nucleotide contains the variant single nucleotide unique to one allele. In this illustration, a single nucleotide change from C to T is the only difference between Allele A and Allele B. The second PCR primer matches sequence at both alleles nearby (usually no more than 150 nucleotides away) and is identified on the figure as the “nonspecific primer.” Because of the one-base mismatch between the Allele A–specific primer and the Allele B sequence, Taq polymerase will not synthesize a new DNA copy. In the Allele A DNA sample, the polymerase efficiently synthesizes a new DNA strand because the 3' base matches this allele perfectly.

In the primer extension assay, a primer is designed that perfectly matches the sequence immediately adjacent to, but not including, a single-nucleotide polymorphism (SNP). The genomic DNA from a sample is mixed with the primer and annealed. Polymerase and one of each ddNTP is added to each of four identical annealing reactions. The polymerase will add one dideoxynucleotide (ddNTP) to the primer depending on which allele is present in the sample. Heterozygote samples will allow primer extension in two of the four reactions. If the primer is radiolabeled, the primer and the elongated product can be resolved on a denaturing gel and the polymorphism detected by autoradiography. Recent improvements42 of the assay allow the mixing of the two relevant ddNTPs, and elongation with a polymerase is conducted in a single reaction. The two different homozygotes and heterozygotes can be resolved by DHPLC, despite the identical lengths of the two alleles.

Two of the chief methods (GeneChips and TaqMan) for SNP analyses are discussed in the next section.43

DNA POLYMORPHIC VARIATIONS

Polymorphisms are variations in the sequence of genomic DNA that have no obvious advantage or disadvantage for an individual and that occur at a frequency of more than 1% in a population. The analysis of variations in DNA sequences from one individual to the next has been particularly useful in ophthalmic genetics. Thousands of polymorphic variations have now been detected. In most cases, sequence changes are selectively neutral; they offer neither reproductive benefit nor detriment to the individual who carries the rare variation in comparison to the frequent allele. Usually a sequence change that results in a new characteristic or trait, for example, a change in function of an enzyme, is called a mutation. Sometimes mutations can be highly detrimental.44 The techniques described in this section allow one to examine individual variations in genomic DNA sequence and use these variations as markers in linkage analysis. Variations are now being cataloged in the NCBI SNP database (http://www.ncbi.nlm.nih.gov/SNP/index.html). These variations fall into several classes and include microsatellites, restriction fragment length polymorphisms, variable number tandem repeats, point substitutions, and deletions, all of which are defined and discussed in this chapter. Detrimental hereditary sequence changes result in genetic diseases. Several thousand genetic diseases are known and have been cataloged by McKusick and colleagues. In Dr. McKusick's on-line version of Mendelian Inheritance in Man (OMIM), hundreds of inherited eye diseases are succinctly summarized, and clinical characteristics and disease etiologies are compared and contrasted.


†Available at http://www.ncbi.nlm.nih.gov/ by clicking on the OMIM link in the dark blue header bar.

SNPs

One class of sequence variation results from single base changes, which occur roughly each 500 bases and thus are the most common type of genetic variation. There are hundreds of thousands of these mutations in the human genome, and they are called single–nucleotide polymorphisms (SNPs). SNPs are stable and are inherited in a Mendelian co-dominant fashion. Unless these variations occur in an expressed sequence or in close-by regulatory sequences, they should have no impact on fitness, and selection does not occur for or against them.

SNPs provide one means of narrowing the linked region that must be searched to identify the causative gene. Because these small genetic distances are not amenable to linkage analysis, association studies are usually performed to identify likely candidate regions. As opposed to linkage, which identifies co-inheritance of marker alleles with a trait in families, association studies measure co-occurrence of a trait with particular marker alleles in populations. Thus, association studies are carried out in populations and depend on two things. First, the trait under study must have (1) occurred initially as a single “founder” mutation on a single chromosomal background and (2) been propagated through the population. Second, there must be a paucity of recombination events between the gene and marker, implying that only a very small distance separates them. If the disease to be studied originated from multiple mutations on many different chromosomal backgrounds, or if there has been significant recombination between the marker and the disease gene since the original mutation, there will not be significant levels of association in that population. It has been shown that the probability of recombination events in the human genome is not evenly distributed, but rather occurs at discrete areas, so that strong allelic association tends to occur between markers physically close to one another. The regions in which these groups of markers showing association occur are referred to as linkage disequilibrium blocks, or LD blocks.45 LD blocks tend to vary in size from 10 to 300 kb, having an average size of about 20 to 30 kb. On average, the blocks are somewhat larger in Caucasians than in Africans, probably because of the greater age, and hence genetic, diversity, of the African population. Usually, within a block the majority of individuals will display only a few haplotypes.

Because SNPs tend to be used in groups, and because they tend to be useful in projects in which large numbers of individuals must be genotyped, development of techniques for genotyping SNPs have tended to concentrate on high throughput methods.43 One method involves microarray analysis similar to that described for analysis of gene expression and resequencing. In this case, oligonucleotides encoding the polymorphic sites with all possible bases are arrayed on the chip. Genomic DNA from an individual is then amplified by PCR assay using primer pairs flanking the SNPs to be analyzed and a fluorescent tag. When the chip is analyzed, the oligonucleotide sequence containing the allele or alleles found in the individual being tested will show the strongest fluorescence. As an example of this technology, 1,500 SNPs may be tested at once using the Affymetrix GeneChip HuSNP Mapping Assay. An alternative method for analyzing SNPs uses the PCR assay and the 5'–3' exonuclease activity of Taq polymerase. A hybridization probe is tagged at either end with a fluorophore and quencher. In this arrangement, the quencher decreases fluorescence by Förster resonance energy transfer. But under special circumstances, the nuclease activity of Taq polymerase can cleave the fluorescent tag from the end of the oligonucleotide probe and the free fluorophore is no longer quenched, producing a large fluorescence signal readily measured in real time. The probe is designed to hybridize perfectly to one allele, but is mismatched against other alleles. Inclusion of the oligonucleotide probe during PCR amplification allows the oligonucleotide to hybridize to its perfectly matching strand of DNA, and when annealed, the 5'-nuclease of Taq polymerase liberates the fluorophore. The assay mix also contains the alternative (mismatched) probe lacking fluorophore, but this DNA binds less well to the template DNA and is displaced rather than digested by the Taq polymerase as it progresses past the polymorphic site. When monitored in real time, the allele specificity of the perfect hybridization is observed, with a clear differentiation of homozygotes having two alleles matching perfectly versus heterozygotes having one copy of the allele and those having no copies of the specific allele. This type of assay can be designed specifically for any polymorphic site, or pre-designed assays are available, for example the Applied Biosystems Assays-On-Demand genotyping system. Approximately 2,000 SNPs can be tested with a throughput of over 5,000 genotypes a day using the ABI PRISM 7900HT Sequence Detection System. Additional methods of analyzing SNPs include the ligation chain reaction as described in Kwok and colleagues.43

RFLPs

A restriction fragment length polymorphism (RFLP, Fig.10) is simply the gain or loss of a restriction enzyme recognition site by a variation within the recognition sequence. When a single-base change occurs in the recognition sequence of a restriction endonuclease, it can be detected by digesting genomic DNA with that restriction endonuclease. If the base change has altered the recognition site, the enzyme will not cut at that site, and a new DNA fragment equal in size to the two fragments flanking the site will be created. It is straightforward to detect these changes by Southern blot analysis using an appropriate probe. In the history of genetics, RFLP analysis was the major breakthrough that allowed to the first important linkage studies to be carried out. Before that time, only a few polymorphisms were detectable, including blood group antigens, human leukocyte antigen (HLA) markers, and protein electrophoresis mobility variants. Although these are highly polymorphic, they provide limited coverage much of the human genome. Consequently, only a handful of linkage studies had been conducted before RFLP analysis, and there was little confidence in the approach as a general method for finding defective genes. RFLP analysis almost immediately suggested the contrary, that linkage analysis would become a major method to find a gene defect. RFLPs were first detected by Southern blot analysis (see Fig. 2). Because bounds are set by nonpolymorphic common restriction enzyme sites at the ends of a fragment, on Southern blot analysis it appears that the sizes of the fragments are changing among the polymorphic alleles. However, the variation in this type of polymorphism is only a change in one or two bases in the restriction enzyme recognition site. More commonly, RFLPS are now detected by first PCR-amplifying DNA bounding the RFLP site, restriction digestion, gel electrophoresis, and staining to detect whether the restriction site is present.

VNTRs

In addition to single-base changes, repetitive sequences provide a rich source of polymorphic markers in the human genome. These include variable number tandem repeats (VNTRs) (Fig. 15), and they are scattered throughout the human genome, especially in subtelomeric regions.46 Each of these markers contains a variable number of copies of short elements (usually 10 to 15 bp in length); each different number of repetitive elements provides a separate allele for use as a polymorphic marker. These variations tend to be highly polymorphic; that is, a high fraction of people are heterozygotes, and there are many alleles. VNTRs may arise by unequal crossing over within the locus, resulting in one new allele that is longer than before and the other allele that is shorter than the original. When the sample DNA is digested with a restriction enzyme and probed with the reiterated sequence, a highly complex pattern of bands occurs. This pattern is unique for each individual, giving rise to the term DNA fingerprint. However, when the same blot is probed with a unique sequence flanking one of the VNTR loci, a simpler polymorphic pattern corresponding to a single locus in the genome is obtained. Because of their common occurrence and highly variable nature, these have been extremely valuable markers when analyzed with Southern blots and probed with flanking sequences.

Fig. 15. Variable number tandem repeats (VNTRs). Although the restriction fragment length polymorphisms (RFLPs) illustrated in Figure 10 show only two alleles (the gain or loss of a single restriction enzyme site) in most circumstances, VNTRs frequently have many different alleles. Three individuals are illustrated, showing the increased potential for heterozygosity in the population. Each arrow represents a sequence, which is repeated a different number of times. The head to tail arrangement of the repeats is a consequence of the means by which the VNTRs are generated, that is, unequal crossing over. Southern blot analysis with a probe adjacent to, but not including, the repeat shows a pattern of regular size increases when several different genomic DNA samples are compared.

More recently, this type of marker has been analyzed by PCR assay. Unique primers flanking the reiterated sequences are used to amplify the VNTR locus. The variable number of reiterated units is reflected in a variable length of the amplified fragment. The reaction can be analyzed by gel electrophoresis and ethidium bromide staining or autoradiography if a radioactive label is used.

Microsatellites

Microsatellites are short repeated sequences, such as a 2-, 3-, or 4-base pair tandem repeats. Microsatellites also are known as short tandem repeats (STRs).47 These dinucleotide-to-tetranucleotide repeats are duplicated a variable number of times. They may be less than 100 bp in total size and frequently vary by as little as two bases, so they are not useful in classic Southern blot analysis. Rather, oligonucleotides homologous to a unique sequence on either side of the variable marker are used as primers in PCR assays to amplify the reiterated sequence. The variable number of repeats is reflected in a variable length of the amplified segment. The size of the amplified fragment is analyzed on acrylamide-urea gels (similar to those used in DNA sequencing), which detect size differences as small as a single base. These markers are extremely useful tools for gene mapping. Examples of microsatellites are long stretches of (CA)n or (TTTA)n, where n varies from 8 to 30. Frequently, these long stretches are polymorphic in the general population; many individuals possess variant alleles, n + 1, n + 2, n - 1, n - 2, and so forth. At some loci (positions on a chromosome) most people will have two different forms (alleles) of the microsatellite. Since products from both alleles of an individual are amplified and seen on electrophoresis, these markers are inherited in a co-dominant fashion. These microsatellite loci are particularly valuable for genetic linkage studies to trace the co-segregation of a disease locus with a marker locus. The opsin gene contains a CA-repeat polymorphism in the first intron. 47 It can be identified in an amplified fragment of the intron that contains the polymorphism. A radioactively or fluorescently labeled fragment from an individual is subjected to electrophoresis on a DNA sequencing gel. Under denaturing conditions we expect to see two different sizes of DNA if this person is a heterozygote at this locus. By running size markers on the gel, we can accurately measure the sizes of the two bands and the number of repeats of each allele. If we run amplification products from other family members, this should reveal the Mendelian inheritance of the parental alleles. A similar type of potentially useful marker is the variable number of adenylate residues following Alu I sequences.48
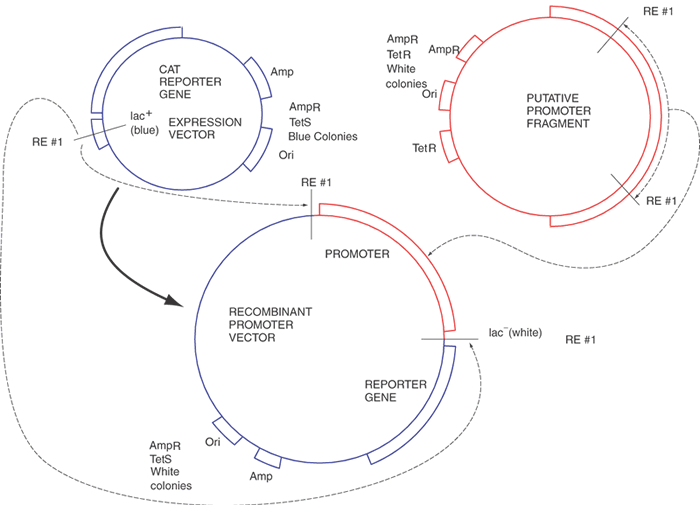
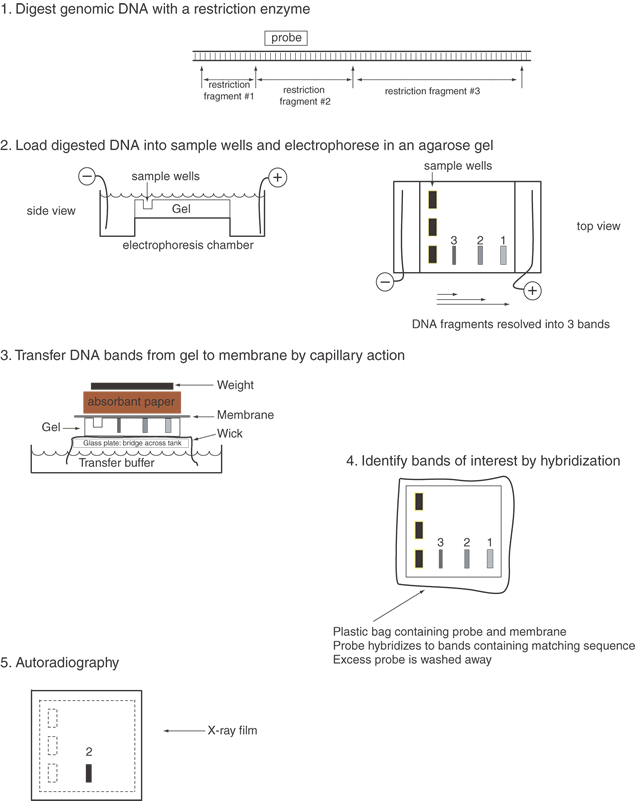
Back to Top
INHERITED DISEASES OF THE RETINA FOR WHICH THE UNDERLYING MOLECULAR DEFECT IS KNOWN
Within the last few years the basic defect in an increasing number of inherited retinal diseases has been determined. As of February 2003, 89 genes with specific lesions have been identified. An additional 45 disease loci have been mapped, but the specific gene and causative lesion for each of these is not yet known. The latest information reviewing mapped and identified gene lesions has beens compiled by S. Daiger's group at a site called RetNet.49 Instead of presenting a brief review of each of these diseases and disease genes, a small number of diseases are considered in depth.

http://www.sph.uth.tmc.edu/RetNet/.

DISEASES CAUSED BY MITOCHONDRIAL DNA DEFECTS

Many variations in sequence of the mitochondrial genome of humans are known, and these are cataloged at http://www.mitomap.org. The ophthalmologist frequently is the first physician to notice symptoms associated with mitochondrial defects. This is because of the high energy use of eye tissues, in particular the retina. Signs most often noted are bilateral optic neuropathy, ophthalmoplegia with ptosis, and pigmentary retinopathy. There are several mitochondrial DNA defects involving ophthalmic problems, but we discuss only two of these. Those not discussed here but recently reviewed by Newman and colleagues50–52 include lethal infantile mitochondrial disease; myoclonic epilepsy and ragged red fiber disease; mitochondrial myopathy, encephalopathy, lactic acidosis, and stroke-like episodes; Leigh's disease; neurogenic muscle weakness, ataxia, and retinitis pigmentosa; and lethal infantile cardiomyopathy. The two disorders discussed here are chronic progressive external ophthalmoplegia/Kearns-Sayer (CPEO/KS) syndrome and Leber's hereditary optic neuropathy (LHON). (We consider a third mitochondrial defect with somewhat similar properties, gyrate atrophy, later in this section. Gyrate atrophy differs particularly from those discussed here because its gene is carried in the nucleus, rather than on the mitochondrial genome.)

The eye is susceptible to mitochondrial diseases because of its high demand for ATP, and the retina has the greatest minimum requirement for ATP before the manifesting disease in most tissues. ATP synthesis takes place in the mitochondrion where the tricarboxylic acid cycle, electron transport (oxidative phosphorylation), and parts of the urea cycle lie, whereas glycolysis occurs in the cytosol. The mitochondrion contains its own genome, a 16,569-bp supercoiled covalently closed double-stranded DNA circle that encodes 13 polypeptides, ribosomal 16S and 12S RNAs, and 22 tRNAs. The mitochondrial genome replicates within the mitochondrion independently from the nucleus. The mitochondrial genes are transcribed and their proteins translated exclusive of the standard cellular machinery. The 13 mitochondrial polypeptides form essential parts of the oxidative-phosphorylation (OXPHOS) cascade. However, the nucleus encodes an additional 50+ polypeptides that also constitute the OXPHOS complexes.

Five complexes of proteins in the mitochondrial inner membrane function in concert to make ATP in the respiratory chain. Complex I contains the mitochondrial DNA (mtDNA)–encoded polypeptides ND1, ND2, ND3, ND4, ND4L, ND5, and ND6, plus 18 to 32 polypeptides encoded by the nucleus. Complex II contains no mitochondrially encoded polypeptides. Complex III contains the mtDNA cytochrome b and approximately nine nuclear DNA (nDNA) polypeptides. Complex IV (cytochrome c oxidase) contains three mtDNA genes: COI, COII, and COIII with 10 nDNA-encoded proteins. Complex V (ATP synthase) has 10 nDNA polypeptides, the mtDNA ATPase 6, and eight polypeptides.

We will observe that a combination of cell physiology, environment, and genetics leads to the manifestations of mitochondrial disease in the eye.

The Mitochondrial Genome Is Inherited Maternally

Maternal inheritance implies passage of an allele from mothers to both sons and daughters. The daughters pass the allele to both their male and female offspring in equal frequency, but sons do not pass the allele to their children. This pattern is consistent with the pattern of inheritance of mitochondria and mtDNA. The egg contains large numbers of mitochondria passed from the mother, but the sperm, by comparison, has very few. It is almost impossible for any male mitochondria from the sperm to successfully pass into the egg during fertilization. One can contrast “maternal inheritance” versus “X-linked inheritance.” In the former, affected carrier mothers pass a defective gene to sons and daughters who both become affected. In X-linked recessive diseases, affected sons do not pass the gene to their sons, but their daughters are obligate (but unaffected) carriers who pass the allele to both carrier females and affected sons with a 50% probability. In small pedigrees it may be impossible to distinguish among possible modes of inheritance, whether the disease is dominant, recessive, autosomal, X-linked, or maternal.

An additional complication is that mtDNAs are not necessarily homogeneous in sequence within an individual. Even within an individual, the fractional abundance of one mitochondrial sequence may vary, from tissue to tissue and from cell type to cell type: Allele 1 might be 14% in polymorphonuclear neutrophil (PMN) leukocytes and 40% in liver cells of one individual, whereas allele 1 might be 90% in PMN leukocytes and 70% in liver cells of another person. The small numbers of the mitochondria and nonuniform division of these between daughter cells during replicative segregation can give rise to different frequencies of the alleles of the mitochondrial genome in different cells. The terms describing the uniformity or heterogeneity of the mitochrondrial genome are “homoplasmy” and “heteroplasmy.” The definition of homoplasmy is a homogeneous sequence of the mitochondrial genome. Heteroplasmy refers to the presence of multiple alleles of the mitochondrial genome. The consequence for a maternally inherited mitochondrial gene is that there may be variable expressivity among family members.

There also is a high probability of partial penetrance due to random drift toward fixation, which is likely to be more rapid because of the small numbers of mitochondria per cell. The degree of severity will vary with the fraction of the defective allele in the critical tissue or cell. For example, the photoreceptor is packed with well-ordered mitochondria in the inner segment, and with very high energy demands, it is a critical cell type in the body for a mitochondrial disease. We might expect that the photoreceptor cell would be one of the most sensitive cells in the body for a mitochondrial problem. Data show that chronic exposure of primates and rodents to low levels of oxidative phosphorylation inhibitors leads to visual loss, optic atrophy, and ganglion cell loss. We also might expect that patients with only a vision problem and no other systemic problems would have a low fraction of a defective allele, whereas patients with multiply affected cells and tissues might have nearly 100% defective alleles in several or all tissues.

Large deletions of a region of the mitochondrial genome, illustrated in Figure 16, cause the CPEO/KS syndrome.53 The deletions are confined to a region between the two origins of replication of the two strands of mtDNA, OL and OH (the letters L and H refer to the light and heavy strands, respectively, of the mtDNA). These deletions, which range in size from 13% to 42% of the mitochondrial genome, usually occur between two direct repeats, as revealed by sequence analysis of the breakpoints in the mutant mitochondrial genome compared with the normal sequence. The CPEO/KS DNA contains just one copy of the repeat sequence, but the normal sequence contained two copies of the direct repeat bounding the deletion in CPEO/KS. Shoffner and colleagues report that, consistent with the deletion of one such region from a patient, complex I and IV activities are decreased due to the loss of the several corresponding polypeptides of the lost mtDNA. Interestingly, metabolic therapy with coenzyme Q and succinate proves helpful to these patients. When the therapy is temporarily stopped, the patient experiences respiratory distress.

Fig. 16. The human mitochondrial genome based on DNA sequence analysis. The mitochondrial genome encodes several genes unique to mitochondria, including 22 tRNAs, two ribosomal RNAs, and several polypeptides. Not all of the polypeptides in the mitochondria are encoded by the mitochondrial genome. The mitochondrial genome is about 16.5 kb in length and is a covalently closed supercoiled circle. Each of the two strands has its own origin of replication, designated OL and OH. The positions of the genes encoding the 13 polypeptides and the two ribosomal RNAs are indicated on the map.(This sequence is from GenBank #NC_001807 representing the revised Cambridge Reference Sequence. There are more than 90 complete mitochondrial genome sequences in GenBank, including other reference mitochondrial genome sequences from Sweden, Africa, and Japan.)

Many groups have identified specific mitochondrial genome defects giving rise to LHON.54–57 Patients with LHON experience central optic nerve death, leading to acute bilateral blindness, and some experience cardiac dysrhythmia. Before visual loss, in some patients there is evidence of peripapillary microangiopathy. The average age of onset of visual symptoms is the early 20s. Clinical features of the disease have been recently reviewed.50,58 Little can be done for patients with LHON; however, among those who partially recover sight, a treatment regimen of vitamins including idebenone, vitamin B2, and vitamin C may speed a recovery process (in those few patients who recover at all) in the Japanese population.59,60

Table 1 shows a summary of point mutations in the mitochondrial genome that give rise to LHON. Biochemical assays of the activities of certain complexes within mitochondria of platelets, skeletal muscle, and other biopsied tissues show specific decreases in activities compared with normal. Thus, mitochondrially encoded polypeptides are strong candidates for the basic defect underlying the disease. Specific point mutations are associated with and cause LHON. In general, each of these point mutations can be shown to be the causative factor because the substitution is not found in the normal population; the substitution replaces a strongly conserved or identical amino acid across a wide range of phylogeny; no other sequence variation co-segregates with the disease; and enzymatic activity is reduced but not totally lost (which presumably would be lethal) in the appropriate complex where the polypeptide functions. The mutations can be classified into categories of high, intermediate, and low risk as causes of LHON. The high-risk group includes mutations that are the primary cause of the disease. The intermediate- and low-risk groups are mutations that by themselves do not cause disease but may do so in combination. Except for ATP synthase, all OXPHOS complexes have mutations that cause LHON, and it may simply be a matter of time before each polypeptide is found to cause the LHON phenotype when mutated.


Table 1. Known Mitochondrial Genome Mutations That Contribute to LHON


MutationRisk ClassPolypeptideAmino Acid ChangeLowers EnzymeFrequency of LHON Case Activity (%)
3460HighND1A to TYes15
4160HighND1L to PYes<1
11788HighND4R to HNo* 50
152HighCytBD to NNT9
3394IntermedND1Y to HNT 
7444IntermedCOIStop to KNT5
4216LowND1Y to HNT 
4917LowND2D to NNT 
5244LowND2G to SNT 
13708LowND5A to TNT 
15812LowCytBV to MNT 

LHON, Leber's hereditary optic neuropathy; NT, not tested.
*Negative by enzymatic assay, but by direct measurement of mitochondrial respiration from LHON patients, there was lower activity.


Although there are no counterparts of human ND1 through 6 in yeast, some correlations can be madeamong yeast OXPHOS mutant growth rates and the similar amino acid substitutions seen in cytochrome b and CO I in LHON or deletions in CPEO/KS syndrome. There are reductions in the yeast growth rates (petite mutants), suggesting partial function of the mutated polypeptide.

Gyrate Atrophy: A Mitochondrial Disease Caused by Defects in a Nuclear Gene

One of the more thoroughly studied retinal diseases is gyrate atrophy; the first retinal degenerative disorder to be characterized at the molecular level. This is a rare autosomal recessive disease, resulting ultimately in severe visual loss. Fundoscopic examination reveals degeneration of the retina and choroid with scalloped margins, hence the name gyrate atrophy. The disease results from the loss of ornithine aminotransferase activity, which reversibly converts ornithine and α-ketoglutarate to pyrroline-5-carboxylate and glutamate. The disease leads to plasma levels of ornithine 10 to 15 times normal and hyperornithinuria.

Diagnosis is made by fundoscopy, electroretinography (ERG), high plasma ornithine, and family history to differentiate it from other retinal-choroidal diseases. Patients can expect complete visual loss by their mid-40s, but the disease course may depend on the random appearance of lesions in the central foveal area. Lesions usually begin in the mid-periphery. The choriocapillaris through the outer layers of the retina are usually totally absent in the lesions. Every tissue containing mitochondria is affected to some degree by the disease. Other signs and symptoms include mild myopathies, muscle weakness with tubular inclusions in the muscle cells, fine sparse straight hair, electroencephalography (EEG) changes, and mildly reduced IQ.

Treatment with vitamin B6 (pyridoxine), a cofactor as pyridoxal phosphate of the ornithine aminotransferase (OAT) enzyme, reduces ornithine levels in a small fraction of patients. Most patients are not helped by vitamin B6, and the reason is apparent from the determination of the precise molecular lesions in each patient. Only a few of the mutations in OAT are near the cofactor binding site (and thus could affect cofactor activation), and only a small percentage of the others may be involved with the cofactor function. Thus, only a small number of patients are expected respond to this therapy.

Table 2 catalogs many known mutations that cause gyrate atrophy. Some general conclusions can be drawn from the accumulated data. Missense mutations fall into two categories: those that alter the kinetic properties of the enzyme and those with normal levels of mRNA but lower protein levels.61 The latter, at least in certain mutations,62 represent improperly processed or improperly transported OAT polypeptides. Some OAT mutations abolish enzymatic activity, suggesting that although consequences such as blindness occur, the alternate metabolic pathways can compensate for the high ornithine levels; that is, OAT defects are not lethal. The termination mutations show a rough approximation of a gradient of OAT mRNA levels, with the more stable mRNAs encoding the longer open reading frames.63 This supports the hypothesis that the earlier the ribosomes fall off the mRNA, the more susceptible the OAT mRNA is to degradation; however, Brawerman64 reviews some special cases in which this is not true. There is only one case of a large deletion within the OAT gene; every other case is that of a point mutation or a very short deletion (less than three bases). Interestingly, the large deletion (1072 bp, which includes exon 6 of the OAT gene) occurs between two direct repeats in the wild-type gene. The repeat unit is also a DNA polymerase pausing sequence.65


Table 2. OAT Missense and Nonsense Mutations Causing Gyrate Atrophy


Amino Acid ChangeVitamin B6 ResponsiveReference
Met1Ile 170
Asn54Lys 171
Tyr55His   61
Leu62Pro 172
Asn89Lys   61
Gln90Glu 173
Cys93Phe   61
Arg154Leu   61
Trp178Term 174
Arg180Thr 175
Thr181MetR  65
A1a184Thr 172
Pro199Gln 176
Tyr209Term   63
Ala226Va1R177
Gln233Arg 178
Pro241Leu   61
Tyr245Cys   61
Arg250Pro   61
Thr267Ile   61
Ala270Pro   61
Arg271Lys   61
Trp275Term 174
Tyr299Term   63
Glu318Lys 179
His319Tyr   66
Val332MetR171
Gly353Asp   61
Gly375A1a 175
Trp391Term 172
Cys394Arg   61
Arg396Term 175
Arg398-Term 177
Gly401-Term   61
Leu402-Pro 175
Pro417-Leu   61
Arg426-Term   63
Leu437-Phe   61

OAT, ornithine aminotransferase.


The responsiveness of the E318K mutation to vitamin B6 illustrates why only certain mutations are likely to be responsive. Pyridoxal phosphate attaches to the polypeptide at position 292 near the site of this mutation. This may imply that the change from a negatively charged Glu to a positively charged Lys may partially prevent pyridoxal phosphate from binding to the OAT protein, but the protein is otherwise functional. Additional vitamin B6 apparently overcomes this problem by mass action, or it may serve to stabilize the mutant enzyme from denaturation and degradation, yielding more functional enzyme. Simply having the Lys pull the pyridoxal phosphate away from its normal spot in the protein would not necessarily account for the problem, because excess vitamin B6 would not correct that problem. Another mutation, T181M, also is responsive to vitamin B6, suggesting that position 181 may be near the vitamin B6 binding site. The larger size of Met compared with Thr suggests that the larger residue might slightly intrude on the cofactor binding site, providing a small energy barrier to the entry of pyridoxal phosphate as it binds to the enzyme. Again, mass action may overcome a small energy barrier to entry of vitamin B6 to its site in the protein. These simplistic hypotheses await experimental testing.

In contrast to mutations that alter OAT kinetics, one mutant, H319Y, results in inhibition of processing and ultimately the absence of the OAT protein.66 Last, Inana and co-workers suggest that the multiple ethnic groups affected imply different founders for each different gene lesion, and the greater variety of Japanese mutations suggest a larger population background compared with Finnish ancestry.66

The pathologic effects of OAT deficiency can be attributed to excess ornithine. This conclusion is drawn from several lines of evidence. First, intravitreal injection of ornithine causes edema and death of retinal pigment epithelium (RPE) cells of rats and monkeys.67 Second, wild-type OAT in normal human and bovine RPE cell lines can be irreversibly inhibited. Once OAT is inhibited, the RPE cells become susceptible to ornithine, which induces apoptosis and kills them. Proline, a metabolite of ornithine, prevents cell death in the OAT-inhibited cells.68,69

A knockout mouse lacking the OAT gene has been created. RPE normally has one of the highest levels of OAT in the body, and they are the first cells to manifest disease pathology in this mouse. Wang and colleagues71 suggest that high levels of ornithine cause pathology in the knockout mouse. Further, they suggest that it may not be necessary to restore OAT activity in RPE cells to prevent retinal degeneration in patiens with human gyrate atrophy. They succeeded in retaining full ERG signals when OAT-/- mice were maintained on a diet that reduced serum ornithine levels to normal levels. However, when OAT-/- control mice were fed a normal diet, they developed retinal degeneration. These data suggest that dietary restriction of arginine (the immediate precursor of ornithine) may prove beneficial for GA patients. Patients often find a diet restricting arginine difficult to follow, although the efficacy of this demanding regimen has been shown to slow progression of the disease significantly.72 Thus, Wang and associates71 and Spirito and colleagues73 propose that a somatic gene therapy of GA may be effective in combination with some limitations on arginine uptake. They suggest that OAT need not be expressed in the retina or the RPE. Instead, keratinocytes from the patient OAT could be transfected ex vivo with an OAT cDNA. The treated autologous keratinocytes would be returned to the patient's skin as an artificial epithelium, and the keratinocytes would express large amounts of OAT protein. It is hoped that this approach will provide large amounts of active OAT enzyme and that the skin will have an adequate vascular supply to make ornithine in the circulation readily accessible to the enzyme.

Other approaches, such as direct in situ OAT cDNA transfection intradermally, may provide a safe, efficacious, and simple gene therapy for gyrate atrophy. Another possible approach is a gene pill taken orally to deliver DNA to intestinal cells. Although the intestinal cells turn over every 10 days, a gene pill taken every two weeks might be an effective treatment. This approach was effective for the delivery of the human insulin gene in diabetic mice.74,75 It remains to be shown whether OAT expression outside the orbit of a mouse or human being will provide adequate OAT activity. A critical question is whether enough of the excess ornithine produced in the human RPE and retina can be managed and dissipated by human retinal and choroidal circulation and then delivered by the systemic circulation to the pool of OAT in the skin site. Although this might be effective in a mouse, the much larger eye and body of humans may make the extraocular location of therapeutic OAT ineffective.

ANIMAL MODELS OF RETINAL DEGENERATION: THE MOUSE

In the mouse there are at least 16 naturally occurring types of retinal degeneration, of which the causative genes have been discovered in seven.76,77 Two of the better-studied lesions are discussed here.

Rd1 (a Defect in the Beta Subunit of cGMP Phosphodiesterase)

The Pdebrd1 (formerly known as rd) mutation results in the selective and complete loss of rod photoreceptor cells in the retina by postnatal day 20. The retina is otherwise remarkably normal in morphology. Differential subtractive cDNA library screening by Bowes and associates detected candidate cDNAs for the rd1 gene.8 Extensive investigations suggested a defect in the cGMP phosphodiesterase (PDE) of the visual transduction cascade. Low levels of PDE activity give rise to high levels of cGMP in the retinas of rd1 mice. The high cGMP concentration is found in the layers of the retina that contain photoreceptors.78,79 Outer segments fail to develop properly. They begin to elongate but subsequently regress. Early work showed that the molecular defect could not be in either the α- or γ-chains of PDE, because the sequences of the wild-type and the rd1 mouse chains are identical. Also, these two genes are known to map to different chromosomal locations from the known map location of the rd1 locus. Bowes and co-workers identified a candidate gene that caused rd1 symptoms.8 It maps to the same chromosomal (chromosome 5) and subchromosomal location as the rd1 gene, it is absent in adult rd1 mice, and the mRNA level is always lower in rd1 mice than the wild type. It is a photoreceptor specific gene as well. Shortly after those studies, the sequence of the bovine β-PDE subunit became available,80 and it proved to be virtually identical to the mouse rd1 gene sequence,10 providing the final evidence needed to prove that the candidate gene was, in fact, the rd1 gene, and showing that it is, as expected, a defect in PDE that gives rise to the high levels of cGMP.

Pittler and Baehr81 showed that a point mutation changes a Tyr to a terminator at codon 347 of the β-PDE mRNA in eight strains of rd1 mice. They found no change in any wild-type mice in several PCR-amplified exons of the mouse β-PDE gene. This point mutation, resulting in the premature termination codon, seems to be the change that causes the rd1 mutation. However, there may be another cause, because an insertion of a proviral retrovirus-like sequence into the first intron of the β-PDE gene is found coincidently with the same point mutation in several strains of mice.82 It has been suggested that the proviral insert blocks transcription of the β-PDE gene, and before the stop codon mutation could cause disease, the absence of the β-PDE transcript results in the retinal degeneration. To resolve the question of which mutation is the causative lesion in the rd1 mouse, Yan and associates83 measured pre-mRNA levels from the β-PDE gene from rd1 and wild-type alleles. Pre-mRNAs are the primary transcripts of RNA directly copied from the gene and are isolated from the nucleus of a cell, and the pre-mRNA level reflects the steady-state level of RNA transcription of a given gene. The pre-mRNAs have not been processed to remove introns. Yan and coworkers found that the levels of both rd1 and wild-type pre-mRNAs are the same, suggesting that neither the stop codon nor the proviral insertion affects the levels of β-PDE transcription. Next, these workers isolated mature mRNA from the cytoplasm (mRNAs in the cytoplasm are fully processed and lack intronic encoded RNA, which has been spliced out during processing). Mature β-PDE mRNAs lack introns, and β-PDE mRNA from rd1 mice lacks the proviral insert from intron A. It differs from wild-type mRNA only at the Tyr347stop codon. Yan and coworkers found little rd1 β-PDE mRNA but plentiful wild-type from cytoplasm. They concluded that β-PDE mRNA from the rd1 allele is much less stable in the cytoplasm than wild type.

At present, the best mechanism to explain the instability of the rd1 mRNA is a process called “nonsense-mediated mRNA decay” (NMD),84 in which the rd1 mRNA is destroyed as a direct result of the premature codon. This suggests that the rd1 lesion is caused by the premature stop codon at position 347 rather than the proviral insert in intron A. However, additional RNA surveillance mechanisms may exist in the nucleus that destroy aberrant RNAs, casting some doubt on the precise mechanism that eliminates the rd1 mRNA from the cytoplasm.85 Could rd1 RNA, after beginning post-transcriptional processing, be subjected to a quality control check in the nucleus because of the proviral insert? To prove the hypothesis that the premature termination codon is the gene lesion responsible for rd1 mRNA destruction, further experiments need to be done. Mouse strains lacking one or the other of the two putative causative mutation events need to be created or found. The true causative lesion should then be readily, immediately, and conclusively elucidated.

Rd2 (a Defect in Peripherin/rds)

Travis and co-workers9 used cDNA subtraction techniques to create a cDNA library enriched in candidates for the Prph2rd2 gene (rd2 was formerly known as the rds gene). The rd2 mutation, discovered in 1978, is an autosomal recessive disease. It maps to chromosome 17, and it is not an allele of the rd1 gene. Morphologically, the photoreceptors develop normally, including the formation of synapses, until the outer segments appear. In the rd2 mouse the ciliary process extends, but no discs arise. Shortly thereafter, the photoreceptors begin to die, although more slowly than in the rd1 mouse. Although the rd2 mutation is recessive, there are some abnormalities of the rd2/+ mice, especially in the outer segments. Thus, the wild type and mutant rd2 alleles are co-dominant. The abnormality caused by the rd2 mutation is not part of the visual transduction cascade. ERGs are normal, except they are reduced in the amplitudes of a- and b-waves. This suggests that all elements of the transduction cascade are present and functional but that rhodopsin levels are reduced.

To identify the causative gene in rd2 disease, Travis and co-workers9,86 subtracted rd1 cDNAs from wild-type cDNAs. Because the rd1 cDNAs lack mRNAs from the photoreceptors but retain a full complement of mRNAs from the inner layers of the retina, the subtraction process generated a collection of photoreceptor-specific cDNAs. Of these remaining cDNAs, which were enriched for photoreceptor-specific cDNAs, they identified those on chromosome 17, the known location of the rd2 gene. In one of these candidate cDNAs, they cloned both the wild-type cDNA and a corresponding clone from the rd2 mutant. They found a difference in the size and amount of this cDNA when they compared the wild-type with the rd2 mutant by Northern (RNA) blot analysis. The wild-type mRNA was 2.7 kb, the rd2 mRNA was approximately 12 kb in size, and the latter band was faint on Northern blot analysis. In sequencing both clones, Travis and colleagues discovered a large transposable element integrated into a protein-encoding exon of the wild-type rd2 cDNA and gene,86 and no such element was found in the wild-type cDNA or gene. The transposable element interrupts the coding region of the gene and leads to the production of defective protein. Thus these workers had discovered the causative lesion in the rd2 gene. But what was the protein?

Shortly after the discovery of the causative lesion in the rd2 gene, sequence analysis was carried out on the peripherin protein (now known as peripherin/rds or peripherin-2). The perpherin/rds cDNA sequence was identical to the rd2 cDNA. Peripherin/rds is known to be an abundant component of the outer segments and an integral membrane protein on the rim of the disc.87 Peripherin/rds helps to maintain normal outer segment disc membrane structure. Peripherin/rds may participate in disk renewal by promoting outer segment-specific membrane fusion during disc genesis. The protein contains fusogenic activity within the C-terminus. Fusion competency requires the assembly of the C-terminus into an oligomer. Peripherin/rds and another outer segment disc integral membrane protein called rom-1 assemble into heterotetramers. Also, folding and tetrameric assembly of peripherin/rds are mediated in part by EC2, a conserved extracellular or intradiscal domain.88 A critical observation is that proper tetramer assembly may cause membrane fusion. Many, but not all, peripherin/rds mutations that cause human disease correlate in position with fusogenic regions.

Finally, Travis and colleagues82 proved that they had cloned the rd2 gene by rescuing rd2 mice from blindness by inserting a transgene bearing a wild-type peripherin/rds minigene. The transgene restored normal outer segment morphology and rhodopsin content in the retina of the transgenic mouse. Besides being a formal proof that they had cloned the correct gene, this also represented the first cure of a genetic retinal degeneration.

HUMAN RETINAL DEGENERATIONS NOT OF MITOCHONDRIAL ORIGIN

Many human gene lesions that cause retinal disease have been determined precisely. Lesions in two genes are reviewed here.

Peripherin/rds

Outer segments contain thousands of closely stacked discs. Disc flattening maximizes the density of rhodopsin in the outer segments. Abnormalities in outer segment genesis in rd2 suggested a role for peripherin/rds in the maintenance of flattened morphology. Wrigley and asssociates89 expressed peripherin/rds in vitro, and they found co-translational insertion of peripherin/rds into microsomal membranes. These authors showed that under non-reducing conditions, most vesicles are flattened. Under reducing conditions the vesicles are round.

Peripherin/rds forms heterotetramers by disulfide bridges between peripherin/rds and Rom1. The authors suggest that under reducing conditions, formation of the disulfide bridges could not occur, leading to round vesicles, whereas under nonreducing conditions the disulfides could form, allowing the heterotetramers to crosslink and flatten the vesicles. Improper or incomplete flattening of outer segment discs was hypothesized to initiate disease etiology of some forms of human retinitis pigmentosa (RP). Thus, Wrigley and coworkers89 expressed several known RP mutations in peripherin/rds. One mutation known to be involved in dimerization abolished vesicle flattening, suggesting that this step is early in the process by which the mutation causes RP.

The human peripherin/rds gene also has been shown to be defective in a form of autosomal dominant retinitis pigmentosa (ADRP).90,91 Both rods and cones in these patients are affected, as shown by abnormal ERG readings with dim-blue light (rod-responses) and 30 Hz white flicker (cone-responses), suggesting that peripherin is important in cone cell discs and rod discs. The three mutations are P219del, P216L, and L185P; they were identified by the SSCP technique, and pedigree analysis showed co-segregation (see section on Concepts of Linkage) of the disease with the variant SSCP alleles. The wild-type amino acids at these three codons are in a well-conserved region of the protein and are invariant among mice, cows, and humans, suggesting importance in the function, processing, or stability of the protein. It would be interesting to compare the disease course of mouse rd2 disease with human ADRP caused by peripherin mutations. There are several problems with this analysis, however. ERGs from mice and humans are difficult to compare owing to the differences in electrode placement, scale, and skull shape. Second, the mutations are not identical; the mouse mutant is a termination of the last third of the protein, whereas the human mutants are point substitutions or a one–amino acid deletion. Finally, the disease course is slow in both species but it is problematic to decide what ages are equivalent in the two species. Despite these dilemmas, interesting insights should be forthcoming.

Opsin Mutations in ADRP

In 1989, McWilliams and colleagues92 mapped the ADRP locus in a large Irish family to a region of chromosome 3 including the opsin gene, which they suggested might be a candidate gene. Dryja and associates93,94 tested this hypothesis and found sequence variants in the opsin gene that co-segregated with the disease in each family with that variant. These variants encoded amino acid substitutions that plausibly led to disease. No normal individuals either in the family or in the general population had these sequence variants. It is now known that rhodopsin mutations are the major cause of ADRP. About 20% to 30% of all cases of ADRP are caused by a mutation in the opsin gene. Presently 104 different opsin sequence variants have been found that appear to cause RP or night blindness, and many are shown in Figure 17. A selection of mutations for which the class of the lesion is known is shown in Table 3. Proof that these variants are causative fall along two of the several lines previously discussed for other diseases: (1) statistics, which includes studies to determine whether there is perfect co-segregation of the opsin mutations and disease within an affected family—no normal individuals have the mutation (two tests show great confidence in these conclusions); and (2) biologic tests, several of which are discussed here.


Table 3. Mutations in Rhodopsin That Cause ADRP


MutationClassReference
T4KIII97
T17MIIa, III96, 97
P23HIIa, III96, 97
P23LIIa180
Q28HIII97
F45LI96, 97
G51RIII97
G51VIII, I97, 180
P53RIII, IIb97, 180
T58RIIb, I96, 97
del68–71III, IIa97, 180
V87DIIb, III96, 97
G89DIIb, III96, 97
G90DIII97
G106WIIb, III96, 97
G106RIII, IIb97, 180
C110YIII97
L125RI, IIb97, 180
R135LIIb96
R135WIIb96
R135GI; IIb97, 180
C167RIIa, IIb97, 98, 180
P171LIIa, II97, 180
Y178CIIa96, 97
E181KIIa, II97, 180
G182SIIa180
S186PIIa, II97, 180
G188EIIa180
G188RIIa, II97, 180
D190GIIa, I97, 180
D190NIIa, I97, 180
D190YII97
H211PIIa, II97, 180
H211RIIa180
C222RI, II97, 98
255delIIa180
I256delIII97
C264delIII98
P267LIIa180
K296EII97
Q344TerI96, 97
V345MI97, 180
P347LI96, 97
P347SI97, 180

ADRP, autosomal dominant retinitis pigmentosa.


Fig. 17. Rhodopsin mutations that cause autosomal dominant retinitis pigmentosa (ADRP) and related diseases. Currently 104 different mutations in the opsin gene are thought to cause either night blindness or retinitis pigmentosa. Of these, 89 are nucleotide substitutions causing missense or nonsense changes. Four of the mutations cause splicing defects in the opsin mRNA. Seven mutations are small deletions, and one is a small insertion. One each is from a gross deletion, a gross insertion or duplication, and one is a complex rearrangement. Some loops have comparatively fewer retinitis pigmentosa mutations; for example, the third cytosolic loop (positions 231 to 252) has no ADRP mutations and lacked a consistent structure by X-ray diffraction analysis. This may suggest that this sequence can vary to a limited extent without causing disease. All the transmembrane helices contain ADRP mutations, suggesting that these residues are critical for folding, assembly, retinoid interaction, and interhelix interactions. (This figure was created by Dr. Markus Preising. His group has assembled a collection of rhodopsin mutants at http://www.retina-international.com/sci-news/rhomut.htm. Another site that provides up-to-date information about rhodopsin gene lesions is at available at http://archive.uwcm.ac.uk/uwcm/mg/ns/1/120347.html.)

One ADRP mutant human opsin gene bearing the P23H change has been introduced into transgenic mice, and it yields mice that have retinal degeneration.95 Other biologic evidence comes from Sung and co-workers, Kaushal and Khorana, and DeGrip and colleagues.96–98 They introduced a series of putative opsin mutant cDNAs into cultured human cells, isolated the expressed opsins, and tested them for the ability to bind 11-cis-retinal and to be bleached by light. They also monitored the processing and integration into the rough endoplasmic reticulum and plasma membranes of each of the different opsins. They found that among the mutants, there were three classes of phenotypic changes. In Class I, mutants resemble wild-type rhodopsin in several characteristics, including amount of opsin accumulated in the plasma membrane, difference spectra, amount of the regenerated rhodopsin, and intracellular distribution. Three mutants, F45L, Q344ter, and P347L,99 had these characteristics. These mutants inefficiently activate transducin that ultimately results in damage to the rod cell. A second class (Class II) contained mutants that accumulated in the plasma membrane at low levels, regenerated poorly with 11-cis-retinal, and remained primarily in the rough endoplasmic reticulum (rER). Most mutants fall into this class (see Table 3). Class III mutants were noted by Kaushal and Khorana.97 These mutants are expressed only at very low levels and are instable. DeGrip and associates98 described mutants that may fall in this third class.

The quaternary structure of rhodopsin has been analyzed by atomic force microscopy.100 In the outer segment disc, rhodopsin molecules appear in pairs that polymerize into cords of 6 to 12 dimers. Five or six cords are grouped together into 2D paracrystalline arrays of 50 to 100 rhodopsin molecules in the lipid bilayer. The overall density of rhodopsin molecules is about 50,000 per μm2 on the surface of one side of a disc membrane, and it appears that about 80% of the disc surface is rhodopsin. Also, the tertiary structure of rhodopsin has been obtained from crystals of bovine rhodopsin and x-ray diffraction analysis.101,102 The 3D structure is depicted in Figure 18A. The positions of ADRP and congenital stationary night blindness (CSNB) mutants have been mapped onto 3D (Fig. 18B) and 2D (see Fig. 17) representations of the rhodopsin structure. A helical wheel map103 has been constructed and can be found online§; this map shows the positions of opsin missense mutants and their interacting amino acids. Some loose correlations between structure and causative mutations are beginning to emerge. There is no obvious pattern detected between position on the primary sequence and mutations (that is, there are no mutation hot spots or clusters in the linear representation of the primary sequence). However, many ADRP mutations are located in the transmembrane helices,103 and although it is obvious that the bulk of the protein resides in these helices, many of the mutants are in residues that make interhelix connections by van der Waal's interactions.103 Filipek and colleagues103 inferred a contact between residues from two different helices if the distance between them is less than 4.0 Å, slightly larger than the sum of the van der Waals radii. Some mutations do not make contact with other residues within the same molecule of rhodopsin. These may be involved with the binding of lipids or inter-protein contacts.

§ http://physiol.annualreviews.org/cgi/content/full/65/1/851/DC1#fig6b.


Fig. 18. Structure of rhodopsin and locations of missense mutations. Panel A. A depiction of the 3D structure of bovine rhodopsin based on X-ray diffraction of rhodopsin crystals, and Protein Database (PDB) entry 1L9H. Transmembrane helices are represented by the gray and blue ribbons with a red edge. Beta strands are illustrated in orange and yellow-tan. The C-terminal end of the strands is identified by the arrow. The four strands constitute the plug region on the extracellular (luminal) side of the protein. Panel B. A quicktime video on the accompanying CD illustrates the positions of known missense mutations causing autosomal dominant retinitis pigmentosa (ADRP) and congenital stationary night blindness (CSNB) in the 3D structure of rhodopsin. In this version, panel B represents the first image of the video. The opsin coordinates are taken from PDB entry 1L9H, which provides resolution refined to 2.6 Å. In the video version, the reader should be able to locate several domains devoid of mutations (illustrated by ribbons lacking spheres) and other regions that contain many mutations (represented by the spheres). The luminal side shows many mutations in the plug and near the retinoid-binding site. The positions of residues mutated in ADRP and CSNB are illustrated by surface dots that represent van der Waal's radii. Normal amino acid residues are shown.

Next, there seems to be an overabundance of ADRP mutations in the so-called “plug” region of rhodopsin (See Fig. 18B), which consists of four beta sheet–like structures at the base of rhodopsin on the disc luminal side (also called the intradiscal or extracellular side). The function of the plug is unknown. It may be involved in interacting with constituents of the interior of the lumen or the opposite side of the outer segment disk. It may be important for the proper folding of rhodopsin, or it may be involved in directing the binding or release of 11-cis- or all-trans-retinal to or from lys-297. A third region of overly frequent ADRP mutations is in the last 10 residues at the C-terminus, which may be mainly associated with the correct processing and transport of the protein in intracellular trafficking.

The destruction of proteins in the rER is reviewed by Klausner and Sitia.104 Thus, we suppose that the Class II or III opsin mutants have severe enough changes to the folding or secondary and tertiary structure (when in the rER) to cause pathology, whereas the Class I mutants have a dominant effect at a later point, possibly during the signal transduction within the outer segment discs. Also, in Class II or III mutants we might anticipate that some mutations cause the inappropriate generation of “stop translocation” signals or “membrane anchor” signals identified in opsin.105 In Class I, although the ability to bind and release the retinoid on light activation occurs normally, the opsin structure is different enough so that retinal degeneration ultimately occurs. The suspicion is that there are fundamental differences in the pathogenesis of these two classes of genotypes. Distinct differences exist in patients with these two classes of mutants. Jacobson and associates,94 Fishman and colleagues,106 Stone and co-workers107 and others show initial findings that illustrate different phenotypes among the different disease alleles. Berson and associates108 recently showed that mutations in the C-terminus have faster rates of visual field and ERG amplitude loss than mutants in the plug region.

New studies suggest that some opsin mutations lead to the accumulation of aggregates near but not in the Golgi apparatus.109 Saliba and co-workers showed that two common rhodopsin mutants (P23H and K296E) behaved similarly to some neurodegenerative diseases in which cytosolic protein aggregation is an essential step in disease etiology. The mutant opsin does not accumulate in the Golgi apparatus. Instead, it forms aggregates that have characteristics of an aggresome.110 The aggregates form close to the centrosome and may cause the dispersion of the Golgi apparatus. Illing and coworkers report similar studies with P23H; in their studies it aggregated in the cytoplasm at extremely low amounts.111 They reported that P23H accumulates in aggresomes, which are pericentriolar inclusion bodies that require an intact microtubule cytoskeleton to form. Formation of P23H aggresomes may require chaperones, such as Hsp40, Hsp70, and αB-crystallin.

Proteins in the ER are routinely inspected for proper folding and assembly so that only correctly folded proteins are allowed to pass to the Golgi apparatus. A protein called EDEM and an ER molecular chaperone, calnexin, recognize the folding status of glycoproteins and, if misfolded, shuttle them to the ER degradation machinery. Misfolded proteins in the ER are “retrotranslocated” to the cytoplasm and degraded by proteasomes in a process known as ER-associated degradation (ERAD). EDEM promotes the release of misfolded proteins from calnexin.112,113 EDEM functions in the ERAD pathway by accepting substrates from calnexin. Upregulation of EDEM during ER stress may promote cell recovery by clearing the calnexin cycle and by accelerating clearance of misfolded proteins in ERAD. One could speculate that drugs upregulating EDEM might promote rapid degradation of Class II rhodopsin mutations and slow disease progression in these forms of ADRP.

Opsin Mutations That Cause Diseases Other Than ADRP

Case studies have identified gene lesions in the opsin gene that cause retinal diseases different from ADRP. An opsin mutation, G90D, results in a form of congenital stationary night blindness.114–116 Also, opsin mutations may cause autosomal recessive RP.117 Heckenlively and associates118 reported a sub-form of ADRP, autosomal dominant sectoral retinitis pigmentosa, caused by P23H. It is possible that sectoral RP in this family represents variable expressivity of ADRP observed in most patients with the same P23H lesion.

ADRP Not Caused by Opsin Mutations

Eleven genes other than opsin have been shown to cause ADRP when mutated (Table 4). One of these genes is considered here. Blanton and co-workers119,120 undertook a classic linkage study of a large family with ADRP (UCLA-RP01). This family had been the subject of several historically important investigations and is clinically well characterized. The disease within this family, which can be traced to a single founder, varies widely in expressivity and penetrance. Onset of symptoms varies from affected member to the next in this pedigree, which includes more than 600 individuals, living and deceased. The clinical characteristics of the affected family members are consistent with type II ADRP. Early studies suggested the possibility of linkage (lod score ∼ 1.0) to the Rh blood group; however, this region later was excluded. The chromosomal location of this form of ADRP (RP1) is on the short arm of chromosome 8 near the centromere and 7 to 8 cM (centiMorgans) from a marker called PLAT, the tissue plasminogen activator gene. The precise gene lesion is now known. Three groups identified lesions in a gene now called RP1.121–123 The protein's normal function remains elusive, but the protein is retina-specific and highly induced by hypoxia.


Table 4. ADRP Gene Loci


Locus or gene nameMap positionProtein identity
RP18 (PRP3)1p13–q23HPRP3, human ortholog of yeast pre-mRNA splicing factor 3
RP43q21–q24Rhodopsin
RP76p21.2RDS
RP97p15.1–p13PIM1K
RP107q32.1IMPDH1
RP18q12.1RP1 protein
RP2714q11.2NRL
RP1317p13.3PRPC8, human homolog of yeast pre-mRNA splicing factor C8
RP1717q22unknown protein, not FSCN2
FSCN217q25retinal fascin homolog 2, f-actin bundling protein
CORD2 factor19q13.32CRX, cone-rod otx-like photoreceptor homeobox transcription
RP1119q13.42PRP31, human homolog of yeast pre-mRNA splicing factor 31

ADRP, autosomal dominant retinitis pigmentosa; PIMIK, Pim-1 oncogene kinase; IMPDH1, inosine monophosphate dehydrogenase 1


Color Vision Anomalies

Several important studies of the color visual system have been undertaken. Nathans and co-workers124–126 were the first to clone rhodopsin and the color pigment genes. They also were first to study mutations of the color genes. The opsin gene is on chromosome 3q, the blue cone gene is on chromosome 6, and the red and green genes are on the X chromosome. The red and green genes are very similar in sequence and are located only approximately 10 kb apart. They are arranged head to tail in the same transcriptional orientation. The green gene can be found in single, duplicated, or triplicated forms in the human population as the result of unequal crossing over (Fig. 19). One interesting ophthalmologic disease that has been explained at a molecular level is blue cone monochromacy (BCM), a form of achromatopsia. This is an X-linked form of color blindness in which cones respond only to blue light. BCM was mapped to Xq28, the chromosomal region also known to contain the red and green color pigments.127 When these genes were examined in BCM patients,128 an interesting observation was made. The highly similar red and green pigment genes normally occur as a head-to-tail tandem array with a red pigment gene followed by one or more green pigment genes. Most instances of BCM result from unequal homologous recombination events occurring in this array, resulting in the deletion of all but a single remaining gene (occasionally a red-green hybrid gene), or leaving two genes, one of which was then inactivated by a point mutation. Additionally, deletions in a region approximately 4 kb upstream from the red pigment gene can result in inactivation of both genes, suggesting that the lost regions contain cis-elements (DNA sequences near the gene that they control) coordinately controlling the expression of either gene in an individual cone. The elegant delineation of this pathophysiology is a classic example of the powerful analysis available produced by combining molecular genetics with clinical acumen. In one case, fundoscopic examination revealed a progressive and bilateral central degeneration.

Fig. 19. The red and green color pigment gene locus. The red and green color pigment genes lie close together on the X chromosome, separated by only approximately 10 kb. The green gene has been duplicated or in some cases triplicated, presumably through unequal crossing over. Some of these unequal cross-over events lead to color blindness through the deletion of the green gene or the creation of a hybrid red-green gene, which is defective.

Parallel studies of the blue pigment gene show a lesion caused by a substitution of serine for a well-conserved proline at position 264.129 This causes an autosomal dominant tritanopia. Also, Weitz and co-workers130 showed that the substitutions G79R and S214P lead to autosomal dominant tritanopia. The alteration of the blue pigment resulting in tritanopia and the elucidation of BCM lend support to the trichromatic theory of color vision.

The value of testing patients for color blindness is in the counseling that the patient or his or her parents receive.131 For example, the patient might be advised against career choices that require accurate color vision.

In understanding the color visual process, it is important to define the hereditary nature and the underlying molecular defect in these diseases. There are other forms of achromatopsia that are not defective in any visual pigments, and the functions associated with these gene defects may require higher-order neural processing in the brain.

Retinoblastoma

Retinoblastoma is a rare ocular tumor observed primarily in young children. Arguably some of the finest advancements and achievements in molecular biology of cancer have come from the studies of the cause of retinoblastoma. It is beyond the scope of this chapter to review these studies, but some key references are given to aid in further reading. Although retinoblastoma seems to be inherited as an autosomal dominant trait, the retinoblastoma susceptibility (Rb1) gene is a tumor suppressor gene of which mutations are recessive at the molecular level. The Rb1 gene has been cloned and sequenced.132 Knudson133 hypothesized that both copies of the oncogene must be inactivated for a tumor to form so that it takes two genetic events to cause retinoblastoma. The Rb1 gene was localized to 13q14 by examination of chromosomal deletions, and a minimum region of common overlap was identified.134,135 Dryja and colleagues132 discovered a putative gene candidate, and Friend and associates136 found a candidate cDNA. This was shown to be the correct gene and cDNA by several criteria. The gene product (pRB) of the Rb1 gene apparently functions by interaction with several DNA-binding proteins.137

The primary function of pRB is to regulate transcription factors in a cell cycle– and cell type–specific manner. Positive regulation by pRB occurs through interactions with transcription factors involved in terminal differentiation. An important example of negative regulation by pRB is the binding of pRB to E2F, blocking E2F from activating transcription and preventing entry into S phase of the cell cycle. pRB is a phosphoprotein, and its activity is controlled by phosphorylation. It is hypophosphorylated pRB that represses transcription of genes required for S phase. Site-specific phosphorylation of pRB is mediated by cyclin-dependent kinases (CDKs) and regulates the binding of pRB to many proteins. Dephosphorylation of pRB is due to the activity of phosphoprotein phosphatase type 1 (PP1).138–141

In addition to direct interaction with trans- factors, pRB recruits chromatin-remodeling proteins and co-repressors to help silence promoters. Formation of complexes between pRB and HDAC or BRG1 was shown to regulate some but not all E2F-regulated genes.142

Diagnosis of retinoblastoma can now be made at the genetic level by PCR testing. Timely PCR diagnosis of Rb1 provides earlier treatment and better outcomes and saves lives. Optimized Rb1 mutation detection reduces the number of children (from at-risk families) undergoing repetitive clinical examinations. This saves money and reduces stress on the children. These savings well exceed the cost of PCR testing.143

LESSONS FROM THE GENETICS OF THEDROSOPHILA VISUAL SYSTEM

Fruit flies are one of the classic systems in which to study eye mutations. Many of the original mutants first detected in Drosophila were mutations to eye color and shape. Of the many different complementation groups (genes) causing eye diseases, many were first discovered in Drosophila. The fruit fly system lends itself well to vision science because although there are far fewer photoreceptors per eye in Drosophila, the photoreceptor cells are approximately the same size as human photoreceptor neurons. This enables effective use of ERG analysis. The fast generation time (about 3 weeks) allows rapid breeding experiments to be accomplished. Molecular biology is well established for Drosophila, many hundreds of mutant stocks are readily available, and the genetics are very well developed. Transgenic flies can be made for a fraction of the cost of a single transgenic mouse. Equipment costs generally are lower. The obvious disadvantage is that the fly is an invertebrate, and the visual cascade is different from the mammalian system. However, the fly phototransduction system closely resembles the general transmembrane transduction systems used by many mammals in many cell types. We cannot do justice to the many elegant studies that have been carried out in fruit flies, but we can touch on a few. Pak2,144 reviewed the eye mutants that are known and described many complementation groups. Other investigators are attempting to tag all eye-expressed genes through mutation.145

In a comparison of the mammalian gene with its counterpart in Drosophila, Washburn and O'Tousa146 mutagenized the same site in fly opsin, P37H, that corresponds to the human P23H mutant causing ADRP. A single copy of the mutant allele shows no abnormal sequelae in the flies, while in the homozygous state there is a severe effect on the morphology of the photoreceptor microvillar membranes, the fly analog of the outer segment. Four other opsin mutations and a glycosylation mutant also have been characterized.147,148 Several classes of retinal degeneration mutants are being analyzed in Drosophila, and homologues in humans are being sought. We anticipate that the Drosophila studies will define the function of these and many other important genes and reveal probable sequelae of human mutations in the homologues.

Pax6

Important studies of the developmental biology of the eye have been conducted in Drosophila that allowed the understanding of human eye and facial abnormalities. The transcription factor Pax6 is necessary and sufficient to induce eye development in several body parts. Drosophila eyeless shares extensive sequence similarity with human Pax6 and mouse sey.149Drosophila eyeless mutants lack the eye or retain a small eye depending on the exact lesion and the “strength” of the mutation. In the mouse, sey results in a small eye; in humans, Pax6 mutations result in aniridia.

A remarkable observation was that expression of the mouse Pax6 gene in different body locations in Drosophila resulted in the ectopic development of compound eyes.150 Eye structures were inducible on the wing, leg, and antenna. The ectopic eyes, although not containing as many ommatidia as normal eyes, consisted of many apparently intact ommatidia, each with a full complement of photoreceptor cells. These studies suggested that Pax6 is the master control gene for eye morphogenesis, but the story is not quite that simple. Subsequently, a few other genes have been discovered that can carry out similar master regulatory roles in inducing or specifying ectopic eye development. Currently, it is known that seven other proteins interact with Pax6 to induce formation of the eye, and additional developmental signals are required.151 It is expected that human lesions in the orthologous genes will result in eye diseases similar to aniridia or microphthalmia.

Back to Top
CONCEPTS OF LINKAGE
The classic methods for studying an inherited disease have centered on elucidation of the defect by biochemical methods followed by cloning first the cDNA and later the gene coding for the defective protein. Some diseases, because of their complexity or the rarity of the defective gene product, have proved resistant to this approach. These diseases are reasonable candidates for linkage analysis followed by what has become known as positional cloning, which is the cloning of a disease-related gene based on knowledge of its chromosomal location. The first step of this process is the assignment of the disease-causing gene to a specific chromosome or subchromosomal region, called gene mapping. This is usually carried out by linkage analysis of genetic markers or polymorphisms, discussed previously.

Two genetic loci are said to be linked if they tend to be inherited together within families. This co-inheritance corresponds to physical proximity on the same chromosome. If chromosomes were always inherited as intact units, the alleles of loci located on the same chromosome would always be co-inherited. However, homologous chromosomes exchange pieces during meiosis, a process called crossing over. Crossing over occurs during the pachytene stage of meiosis I, when the chromatids of homologous chromosomes are joined by the synaptonemal complex and exchange segments, or recombine. This crossing over is evident microscopically in diplonema, the next phase of meiosis I, as the tetrads separate and chiasmata (literally, cross pieces) become visible.

Usually, about one chiasma is visible for each chromosome. For the human species, this process performs the useful function of increasing genetic diversity. For the geneticist, crossing over can result in the failure of alleles at two linked loci to be co-inherited. Thus, the closer two loci are on the chromosome, the less likely a chiasma is to form between them and the more likely that they will be co-inherited. Alternatively, if two (or any even number of) cross-over events occur between two loci, they will end up again on the same chromatid and will appear not to have recombined at all.

Genetic linkage between a disease and the marker does not imply that the disease occurs with a specific allele at the marker locus in the general population. The latter phenomenon, termed association, is a statistical association between a specific allele at a genetic locus and a given disease more often than would be expected by random chance in human populations. Association is often found for the HLA locus and usually involves multifactorial diseases with a relatively small genetic component. Conversely, association does not imply genetic linkage, although one possible mechanism for association is close genetic linkage with linkage disequilibrium (see later).

The recombination fraction (θ) between two markers is the fraction of offspring in which a detectable cross-over event occurs between the loci. When two markers are close together, more than one cross-over event is unlikely to occur between them, and the recombination fraction is approximately equal to the genetic distance, x, so that x ≈ θ.

The genetic distance is measured in units called “Morgans” (M), honoring T. H. Morgan, a pioneering Drosophila geneticist. One hundredth of a Morgan is a centiMorgan (cM), and over small genetic distances 1% recombination roughly equals 1 cM. Over greater distances double recombinants occur and decrease the apparent recombination frequency compared with the genetic distance.

The genetic distance can be calculated from the recombination frequency using various formulas, depending on the assumptions made about the frequency of double recombinations over a given genetic distance. The formula derived by Haldane:


x = -1/2 ln(1 - 2 θ)

with the inverse mapping function


θ = 1/2 (1- e- 2x)

assumes that an initial cross-over does not affect the probability of a second cross-over event within that region, described as no interference. In reality there might be some decrease in frequency of second cross-overs in a region after an initial cross-over has occurred, termed (positive) interference. Formulas have been derived by Kosambi and others that approximate this in a variety of ways, depending on the particular assumptions made about the strength of interference.152

These formulas have important features in common. First, they are all based on the recombination fraction in some fashion, and so they estimate genetic distance. Second, unlike recombination fractions, genetic distances are additive, so the distance between two markers should equal the sum of the distances between all markers between them. Finally, the idea of map distance formalizes the linear arrangement of genes into a genetic map, an extremely useful concept when combined with modern recombinant DNA technology.

The linkage relationship between two markers (or a disease and a marker) will influence the probable inheritance pattern of these markers in a given family. For example, as mentioned previously, two markers are likely to be co-inherited if they are closely linked. Thus, finding that two markers are co-inherited in a large family would make one think that they might be closely linked, whereas finding that their alleles assort randomly would make one suspect that they are not linked. If two markers are linked at an intermediate recombination fraction (between 5 and 20 cM), the two markers will be co-inherited often but will recombine with a frequency roughly equal to the genetic distance in cM. Although human pedigrees often are too complicated to allow a direct calculation of the recombination frequency by counting recombinant and nonrecombinant meioses, the linkage relationship between two markers can be calculated using a type of analysis called maximum likelihood estimation.

One can estimate the likelihood of a particular inheritance pattern for a set of markers assuming a given linkage relationship (or recombination fraction) between these markers. This likelihood can then be compared to the likelihood of that particular inheritance pattern appearing if the markers were not linked. The ratio of these two likelihoods (i.e., of linkage at a given recombination fraction versus nonlinkage) is called the odds ratio for linkage at that recombination fraction:

The odds of linkage at a given θ = likelihood (given pedigree assuming θ) ÷ likelihood (given pedigree assuming unlinked, θ = 0.5).

This ratio is usually expressed as a logarithm. The value is called the logarithm of the odds or lod (rhymes with odd) score:


lod = log10[L(pedigree given θ) ÷ L(pedigree assuming unlinked)]

Thus, a lod score of 1 represents 101:1 or 10:1 odds that a marker is linked at the assumed value of θ. The lod score is usually calculated for a series of recombination fractions between two markers, and the recombination fraction giving the highest lod score is the relationship with the highest probability of being the true value, the maximum likelihood estimate of theta, designated θ.

While lod scores are useful values, their interpretation is not straightforward. A lod score of 3 or greater is usually considered strong evidence of linkage. Although a lod score of 3 represents 1,000:1 odds in favor of linkage by the results of the linkage analysis, it does not consider the strong à priori odds against linkage (at least 21:1, because there are 22 different autosomes). Thus, the actual posterior probability of linkage with a lod score of 3 is approximately 95%. The à priori odds against linkage are considerably smaller if a disease is inherited in an X-linked fashion. Thus, a lod score of 2 is considered significant evidence in favor of linkage for X-linked diseases. Conversely, a lod score of -2 or less is considered significant evidence against linkage for autosomal or X-linked diseases.152 Lod scores can be calculated for linkage estimates of complex traits, usually made using model free analyses, although interpretation of these also depends on the specific type of analysis. See Lander and Kruglyak153 for a thorough discussion.

While the concepts of two-point linkage described previously are straightforward, the actual probability calculations become quite involved for pedigrees more complex than a nuclear family (which often are required for linkage analysis). A simple calculation for a small nuclear family is given in Appendix II. The availability of LIPED, a user-friendly computer program capable of performing two-point linkage calculations, revolutionized linkage analysis.154

The power of a linkage analysis can be increased fourfold to fivefold by using more than two markers at once; this is called multipoint linkage analysis. Although performing multipoint analysis is more complicated in practice than two-point analysis, the underlying principles are much the same. The LINKAGE program package provides a convenient and powerful tool by which multipoint analysis can be performed on a personal or mainframe computer,155 and these algorithms are now implemented in a faster form suitable for parallel processing.156 There are a number of additional programs that are useful in particular circumstances. The Vitesse157 program uses genotype set recoding and fuzzy inheritance to allow calculation of multipoint lod scores for more markers than can be carried out with LINKMAP, which uses the Elston-Stewart algorithm.158 A number of programs have proved useful for model free linkage analysis, including GeneHunter2 and SimIBD.159

The most likely order and distances of these loci can be obtained iteratively if not previously mapped. Often, the relative locations of several marker loci are known from previous studies, and the likelihood that an unmapped locus (often a disease-causing gene) is located at various points across this map is estimated.

For historic reasons, the multipoint likelihood often is measured not as a lod score but as a location score. The location score is equal to 2ln (likelihood), which gives a value of 4.6 times the lod score. Using this conversion factor, the same limits of significance can be used for multipoint as for two-point linkage. In addition, two-point data in one family often need to be analyzed with three-point data from another. This causes no difficulties because the two-point lods are equivalent to three-point lods calculated with the third locus coded as unknown in all individuals.

Hand in hand with the improved mathematic analysis of linkage have been the molecular biologic techniques that provide increasing data for the analysis. Before the 1970s most linkage analyses were carried out with HLA typing, blood typing, and a group of approximately 30 protein markers. These markers were limited in number, had varying usefulness, and often required specialized and sometimes expensive techniques. Modern technology has provided the geneticist with thousands of markers spread across the human genome, most of which are heterozygous in more than 30% of individuals. The future promises probes that are more useful and technically straightforward to use. Repetitive sequences are particularly advantageous polymorphic markers because they often have more than two alleles. This means that individuals are more likely to have two different alleles for the marker. One can trace the inheritance of each allele from a heterozygous individual to his or her offspring, depending on the markers donated by the spouse. Matings in which the inheritance of specific alleles of a particular marker can be followed unambiguously are said to be informative for that marker. The probability that it will be possible to deduce the inheritance of a particular marker with a disease allele is called the information content or polymorphism information content (PIC) for that marker for that type of disease (e.g., dominant, recessive, or co-dominant).

The PIC of a marker is not a simple property of the marker, but rather depends on the disease for which the marker is being used. In general the PIC of a marker will be greatest when used for a co-dominant gene, intermediate for a recessive gene, and least for a dominant gene. It will be greatest when the marker is co-dominant and somewhat less when the marker is dominant. For co-dominant markers, the PIC will increase with the number of possible alleles and, for any given number of alleles, will be greatest when the alleles are of equal frequency in the test population. There are explicit formulas for calculating the PIC under different conditions.

The term PIC was popularized in an article describing the requirements for creating a genetic map of the human genome.160 Because an autosomal dominant disease gene was used as an example in this paper, the PIC of a marker is occasionally given without reference to a specific disease and generally refers to the information content obtained when used to map an autosomal dominant disease. Any of the types of markers described previously can be analyzed together with the PCR. This has two advantages. First, PCR-based analysis is generally technically more straightforward, more efficient, and faster than Southern blot analysis. Second, the latter usually requires a specific DNA fragment as a probe. Thus, analysis of the human gene map requires first obtaining, growing, and stockpiling large numbers of specific probes. PCR analysis is dependent only on short oligonucleotide sequences that can be synthesized easily. Thus, the published description of a PCR-based marker allows its generalized use without the elaborate preparation required for Southern blot analysis. Even when ASO hybridization is used for detection, the additional oligonucleotide probes can be prepared easily from the published sequence. Markers based on PCR technology are called sequence tagged sites and represent the major method by which linkage analysis is carried out.

The combination of sophisticated recombinant DNA technology and increased analytic ability described previously means that the genes for many inherited retinal diseases can now be mapped and eventually cloned. The diseases must, however, have certain characteristics to be optimal candidates for linkage analysis. One requirement is that the disease be inherited in a mendelian fashion. The power of the analysis depends on the structure of the families and the inheritance pattern. The contribution of the inheritance pattern is influenced by the information content of the probes used. However, this is tempered by the types of pedigrees usually available with different inheritance patterns. For example, whereas X-linked and dominant diseases often occur multiple times in extended families, the occurrence of autosomal recessive diseases is often confined to nuclear families.

The penetrance of an inherited disease is defined as the percentage of individuals carrying the disease gene who show some sign of that disease. Reduced (or partial) penetrance is displayed by ADRP. In ADRP the penetrance is age related, with the percentage of individuals who show clinical evidence of the disease increasing through the first 20 to 30 years of life. Reduced penetrance should be differentiated from variable expressivity, which implies that different individuals affected by the same disease (possibly even carrying the same genetic mutation) show different and occasionally non-overlapping signs of the disease. Variable expressivity is exemplified by myotonic dystrophy, in which affected individuals may have different combinations of myotonia, muscular weakness, male pattern baldness, diabetes, and cataracts.

It may be necessary to perform linkage analysis of diseases for which the inheritance pattern is unclear. This can be difficult and treacherous, but it is possible. Most available computer programs analyze data using a likelihood approach based on a simple genetic model, which may not fit particular diseases. A method that makes no assumptions regarding inheritance pattern is sib-pair analysis,161 or, in its more generalized form, affected pedigree member (APM) analysis. This analysis simply compares the occurrence of the same marker allele in siblings affected by a genetic disease with that expected randomly. Although the expected values of co-inheritance vary with the true inheritance pattern, all means of inheritance should differ from random assortment. The SimIBD and GeneHunter programs mentioned previously are also useful in this analysis.

Sib-pair analysis has several drawbacks, so it should be used only when necessary. One major drawback is the loss of information that occurs when no specific inheritance pattern is assumed. This is expected and unavoidable but means that larger pedigrees with increased numbers of potentially informative meioses must be analyzed to detect linkage. Another weakness is that it becomes difficult, if not impossible, to exclude linkage to a specific locus. Because no specific inheritance pattern is assumed, it is difficult to obtain a specific probability for absence of linkage. This method of analysis is most useful for diseases that are inherited polygenically. Often these diseases have a major gene with a number of modifying genes. This pattern also can be analyzed as a dominantly inherited gene with decreased penetrance using classic linkage analysis. The apparent penetrance and the lod score will be decreased in proportion to the significance of the modifying genes. This is an alternative, and often simpler, method of carrying out linkage analysis in these diseases. Decisions on which method of analysis to use are best made after a careful examination of the pedigrees, with calculation of the penetrances for various classes of patients under the assumption of mendelian inheritance.

Another difficulty in linkage analysis is the potential presence of genetic heterogeneity. That is, different families may have clinically identical diseases caused by two or more different genes (presumably at different genetic locations). An example of this phenomenon is ADRP, which can be caused by mutations in rhodopsin and several other loci. Diseases that are consistent in terms of clinical presentation and course, age of onset, and pathologic findings are more likely to be caused by a single genetic lesion, especially if the clinical findings are distinctive. Clinical heterogeneity does not, however, always imply genetic heterogeneity or vice versa. For example, both late-onset, slowly progressive ADRP and severe early-onset ADRP can be caused by mutations in the rhodopsin gene. If a disease is inherited in more than one fashion, genetic heterogeneity is implied.

Genetic heterogeneity within a set of families can obscure valid linkage of subsets of the population. Admixture of unlinked families to a linkage study will result in an increase in the apparent recombination fraction and a decrease in the lod score. Because the effect of cross-overs is more dramatic at small assumed recombination fractions where-cross overs would not be expected, the greatest danger of admixture of a few unlinked families is in multipoint analysis with closely spaced markers. In this case the linkage can be entirely obscured.

If genetic heterogeneity is suspected, linkage analysis can deal with this in a variety of ways. It is possible to analyze the probability curves generated by separate families statistically and decide whether the results generated by one or more of them are inconsistent with those of the remaining families. This is carried out by a ψ2 analysis and used with the computer program HOMOG. This analysis also is valid for sets of families at different loci, which are linked to the marker in question but at different recombination fractions. Finally, the analysis can be carried out for up to four subgroups of families.

It is possible also to use maximum likelihood analysis to find the fraction of linked and unlinked families and to calculate a lod score modified to take this estimate into account. Because the decision regarding the subgroup classification of each family is a probabalistic one, it is not legitimate simply to discard families that seem not to be linked. If the families being studied can be separated into two groups on the basis of phenotype or ethnic origin, the results obtained with these two groups can be compared with the m-test of Morton.152

Although genetic heterogeneity can be dealt with statistically, it always remains a problem and makes linkage analysis more complex and difficult. When embarking on linkage analysis of diseases that seem likely to be heterogeneous, the best procedure is to confine the study to large pedigrees, which can yield a significant lod score alone or with only one or two additional pedigrees. This minimizes the probability of admixture and maximizes the probability of detecting admixture if it does occur. In addition, study of a few large families is more efficient than analysis of many small families (see later).

The number of individuals and families that must be collected to carry out a linkage study can be estimated in a variety of ways. The estimates will depend on the information content of the probes to be used. For example, if the information content of the average probe used is 0.5, roughly twice as many potentially informative meioses will be required to complete a study successfully (that is, attain a lod score of 3 or greater) than if the probes are all completely informative (with PICs of 1). A marker allele and an unlinked autosomal dominant genetic trait will be co-inherited by chance 50% of the time, whereas if they are closely linked, this will occur with a high probability. Each nonrecombinant and informative meiosis increases the chances of linkage by approximately twofold. Thus, using markers with information contents averaging 0.5, approximately 20 to 25 potentially informative meioses might be required for a successful linkage study. The number might be smaller for an X-linked disease (because the information contents of the probes ought to be higher). Also, since the à priori odds against linkage are smaller, correspondingly fewer meioses are required. For an autosomal recessive disease, much more information is obtained from affected offspring (who must inherit disease alleles from both parents) than unaffected offspring (who may have 0 or 1 disease alleles), and approximately 12 to 15 of these meioses may be required for a successful study.

When the gene for an autosomal recessive disease is very rare in the general population, affected individuals are often the result of consanguineous matings. Such families can be very useful for gene mapping, even if they contain only one affected individual. In the affected individuals the two disease alleles are said to be identical by descent, because the maternally and paternally derived copies are inherited from the same common ancestor. Polymorphic markers within or very near the gene also should be inherited from this same individual. Thus, they should have the same allele, making the affected individual homozygous for the marker. On average, analysis of DNA samples from approximately 10 such individuals who are the product of first-cousin matings might be required to achieve a lod score of 3. This variation of linkage analysis, called homozygosity mapping, is especially appropriate for studying rare autosomal recessive diseases, in which families with multiply affected children are rare.162

There are now more exact means to estimate the power of a pedigree in a linkage analysis or, conversely, the number of families that might be required to complete a linkage study. The program SIMLINK provides an accurate means by which an investigator can estimate the probability of detecting linkage with a given group of pedigrees.163 The input to the program consists of descriptions of the probe(s) to be used, the pedigree(s) to be analyzed, and instructions concerning the recombination fractions (or genetic distances) one wishes to simulate and analyze. The program then simulates the co-segregation of two (or multiple) markers in the given pedigrees. Lod scores are then calculated for each simulated inheritance pattern, and the results in the set of families are analyzed statistically. Output from the program consists of estimates of the most likely maximum lod score, probabilities of obtaining lod scores greater than selected values (e.g., great enough to conclude linkage), and probabilities of excluding linkage given unlinked markers. The program can accommodate single linked markers and multipoint analysis and can be used for diseases with partial penetrance.

The analytic and biochemical tools described previously are effective enough so that virtually any disease inherited in a mendelian fashion can be mapped successfully, given that sufficient families are available. This is a worthwhile endeavor, with practical benefits in diagnosis and determining genetic heterogeneity. However, even more important are the identification, cloning, and study of the disease gene itself (so-called positional cloning); this has been accomplished for 89 retina-expressed genes to date. New techniques are being developedthat make it increasingly reasonable to attempt the cloning of disease genes based on their location within the genome.

Linkage analysis often can identify markers that map within 1 cM of a disease locus, corresponding on the average to 1 million base pairs. Routine Southern blot analysis7 on agarose gels can analyze fragments up to 20 kb in size. Many techniques have been developed that allow analysis and cloning of DNA fragments intermediate in size between 20 kb and 1 million bp. These techniques are most useful when markers closely linked to a disease gene (usually within 1 cM) have been identified, and development of even closer markers is hampered by difficulty in finding the markers and by difficulty in demonstrating whether they are closer due to a lack of recombination events in the very small region under study. Although completion of the human genome sequence has removed the necessity of carrying out these techniques in most cases, they are be briefly described here for completeness.

THE HUMAN GENOME SEQUENCE AND CANDIDATE GENE SCREENING

As mathematical and biochemical techniques for linkage analysis have improved, candidate gene identification and screening have become the most difficult and time-consuming steps in positional cloning. The availability of the (almost) complete sequence of the human genome and the identification of (almost) all the coding sequences in it have helped to alleviate this problem to some degree. Once flanking markers for a linked interval have been identified, it is then possible to go to an online database such as the NCBI genome map viewer (http://www.ncbi.nlm.nih.gov/mapview/map_search.cgi?chr=hum_chr.inf&query=) and obtain the genes and gene sequences included within that interval. Although some sequences may be missed, the quality of the databases is now quite good in most regions of the genome, and this approach has become efficacious and extremely efficient. Additional information such as variations and known disease associations are also available from this database, including links to the NCBI UniGene database (http://www.ncbi.nlm.nih.gov/entrez/query.fcgi?db=unigene) and other web resources. The Celera database (http://www.celeradiscoverysystem.com/index.cfm) is also useful and provides an exceptionally intuitive and useful interface but requires a rather expensive subscription and release of some patent rights. Other databases are available, including the USC Genome Bioinformatics web site (http://genome.ucsc.edu/) and the UK Human Genome Mapping Project Resource Centre( http://www.hgmp.mrc.ac.uk/), each with its own particularly useful or convenient features. This very brief overview of web resources cannot begin to cover the bioinformatics resources and tools currently available but is intended merely to provide some useful sites which an interested reader may use to begin an exploration of these exciting tools.

Several techniques are valuable in characterizing large fragments of DNA and were historically utilized in creating physical maps of the human and other genomes. We review some of these techniques, because they are still used in special situations and are still referred to in the literature.

Pulsed-field gel electrophoresis (PFGE) made it possible to analyze large fragments of DNA164 that could not be resolved by conventional agarose gel electrophoresis. The rationale for PFGE is that in standard electrophoresis the forward motion of DNA fragments is impeded by difficulty in finding a path through the agarose meshwork of the gel matrix. The larger the DNA fragment, the more difficult it is for the fragment to traverse the gel. However, as DNA fragments of increasing size are electrophoresed, this decrease in migration speed lessens because the DNA fragments can assume a V shape, allowing for more efficient migration through the agarose gel. Therefore, standard agarose gel electrophoresis does not discriminate well among DNA fragments large than 20 kb.

PFGE overcomes this conformational advantage of large DNA fragments by continually forcing them to alter the direction of their migration during the electrophoresis. When the direction of migration is altered, the DNA fragment must reorient itself with respect to the new electrophoretic field. Thus, the DNA fragment is never allowed to take advantage of efficient movement through the agarose matrix while in a V-shaped conformation. The most effective timing for the pulses varies with the size of the DNA fragment of interest, and usually a series of pulses of increasing lengths (‘ramped’ pulses) is used to provide good separation over a selected size range.

Additional modifications must be made in the experimental protocol to avoid degradation of the sample DNA before electrophoresis. Rather than the standard DNA isolation protocols, most of which are based on phenol extraction, the cells to be analyzed are embedded in low-melting agarose plugs. The treated plugs are subjected to proteinase K digestion, which literally digests the cell from around the DNA. Restriction endonuclease digestion, with infrequent cutters that recognize eight-base sequences or, on occasion, rare six-base sequences, is also carried out with the DNA embedded in the agarose gel. Thus, the DNA is never subjected to the shear forces that it would encounter in solution. The plugs are then inserted into the wells in the agarose gel, and electrophoresis is carried out. Finally, because the DNA fragments electrophoresed are very large, they may not transfer well, and the DNA is usually fragmented (nicked) with ultraviolet irradiation or by mild acid treatment before transfer.

Techniques have been developed to allow the cloning of large DNA fragments or DNA fragments hundreds of kb distant from a DNA clone in hand. Classic cloning vectors such as plasmids are best used for inserts containing hundreds to thousands of bases, wherease modified lambda phages accept inserts up to approximately 20 kb. Next in size, cosmids (plasmids containing lambda packaging sites to allow packaging of DNA fragments consisting almost totally of insert sequence) have a capacity of approximately 40 kb. The isolation of a disease gene by positional cloning may require clones from hundreds or even thousands of kb around the linked marker.

One way to move hundreds of kb rapidly down the genome is to use jumping, or hopping, libraries.165 These libraries are made from large genomic fragments (usually approximately 100 kb), and DNA from the ends of the fragment are cloned. Thus, when the library is screened with a clone homologous to one end, it is isolated with a second fragment lying approximately 100 kb distal to it. This second fragment can then be used to isolate a third, and so on, allowing us to “hop” down the genome.

Hopping was largely supplanted by the generation of tools that could clone much larger DNA fragments. BACs have inserts in the range of 100 to 150 kb. YAC vectors166 contain DNA inserts of 100 to 3 Mb. There are fewer cloned YACs per each yeast cell, and fewer yeast cells in a colony than in conventional cloning systems. Also, unlike plasmids or phage DNA in bacteria, there is no simple way to isolate only the YAC DNA from a yeast colony. YAC libraries are commercially available, and PCR screening can rapidly identify the clone of interest. Finally, in assembling the physical map of the human genome, the location of many YACs was well established.

YACs and BACs are expected to lead new lives beyond their initial need in the assembly of the human genome. They are now used as the basic substrates in making transgenic animals to test gene function. Large DNA fragments are sometimes needed in transgenic mice for expressing large genes or multigene clusters, which may be coordinately regulated by a locus control region (LCR), e.g., the LCR of the red-green locus. YACs and BACs can be mutated easily and quickly in bacteria and yeast and introduced into mice to assess the consequences of mutations. YACs and BACs are commercially available from certified collections.

Another technique useful for establishing fine maps of chromosomal regions was analysis of radiation hybrids.167 These hybrids are made by lethal X-irradiation of a hybrid cell line containing a single human chromosome in a hamster background. Chromosomal fragments of the irradiated cell line were rescued by stable incorporation into a recipient cell line's genome.

Radiation hybrid cell lines were valuable tools in two ways. First, the individual lines served as sources for human DNA fragments in a limited chromosomal region. Second, an ordered series of cell lines provided continuous coverage of the human genome in small increments. The panel could be probed to map the location of a DNA fragment.

The greatest current problem, once linkage to a region is established, is to recognize the causative gene when it is encountered. The first step is to find all the genes in the region. Although the entire region may have been sequenced, it is not always obvious which parts of the sequence are the actual genes. Genes have certain consensus characteristics, including open reading frames, transcription initiation, splice, and polyadenylation sites. However, the variability in the consensus sequences at any of these structures reduces the efficiency of detecting all genes in the region. Many genes are preceded by G-C–rich sequences called Hpa II tiny fragment (HTF) islands located immediately 5' to the genes.168 Because HTF islands are G-C rich, these sequences tend to have recognition sites for infrequent cutting restriction endonucleases, providing a convenient way to screen for them by digestion and Southern blotting. This approach is far from perfect, because not all genes are preceded by G-C–rich regions. Direct examination of the human genome sequence, looking for regions of high G-C content, has supplanted the HTF Southern blot analysis.

Currently, the first step in finding all the genes is to consult the databases: The human and mouse genome sequences are aligned at the UCSC Genome Browser site, and gene predictions there are based on several considerations including (1) already well known genes and proteins, (2) alignment of the genome sequence with cDNA clones or ESTs, (3) theoretical predictions of gene structures, (4) alignments with nonhuman cDNAs or genes (primarily mouse, rat, or Fugu (a fish), (5) clustering of CpG dimers, and (6) comparative reductions in the presence of highly repeated sequences. Having checked the databases, probably 95% of all genes in a region currently can be identified.

There are alternative (but more tedious) means to identify genes other than by the databases. Genomic DNA fragments can be screened for expressed sequences by using them as probes on zoo blots, which are Southern blots made with genomic DNA isolated from a variety of species. These blots should detect sequences conserved across multiple species. A gene functioning in the retina should be conserved across several species that are sighted, but absent from unsighted animals. Bioinformatics now provides much the same information by aligning sequences from different species and identifying conserved DNA sequences. The advantage of the blotting experiment is that the sequences of only a few species are now known, and the blot can assess many different species in one experiment. The same principles apply for Northern blots, that is, blots made with RNA from the tissue of interest and several control tissues (which should not express the mRNA from the gene of interest). The gene of interest should be expressed in the retina or a cell type within the retina where the gene function is required. Thus, the disease gene may be identified through expression of its mRNA in the anticipated tissue. Genes not expressed in the retina may be ruled out. The cDNA libraries from which EST clones were obtained are known, and NEIBank and related databases provide detailed information of the origins of each clone. It is now possible to carry out an electronic Northern blot analysis to identify or rule out a gene within the locus.

The next step in the process of finding the disease gene is to compare the DNA sequences of affected patients to the “normal” sequence. A causative lesion (deletion, insertion, missense, or nonsense sequence change) should be noted in the patient samples, and the same lesion should not be present in the normal population.

A useful means of identifying specific genes is not really a specific technique at all. Rather, it is the use of naturally occurring deletions that result in the clinical disease state. Individuals with such deletions often have loss of multiple genes located in this region and have multiple diseases normally inherited separately and in a mendelian fashion. This is called a contiguous gene syndrome. These patients also may have multiple malformation syndromes or mental retardation. Because of the hemizygous state in males, many (but not all) of these syndromes have been described for X-linked loci. The DNA from these patients can be used in subtraction cloning to isolate clones within or very near the gene being studied. Identification of such individuals can represent a major breakthrough, and they should always be actively sought.

Clearly the approaches to isolating disease genes, given the completion of the human genome sequence, are very different from the prior positional cloning strategies. Both approaches have proved successful. As the analytical and biochemical techniques described previously increase in power and availability, more retinal diseases will be mapped and their causative gene lesions identified.169

Last, the knowledge derived from the genomic sequences of several different mammals has provided information on conserved sequences across species. Many of these conserved sequences are genes that express proteins. The human genome sequence is virtually complete and largely annotated. This provides an encyclopedic set of candidate genes once a locus interval is defined by linkage studies. If the region is relatively small, that is, less than 200,000 bases, it is relatively straightforward to test each gene in the interval as a candidate for the causative gene. For somewhat larger intervals, it is judicious to select those candidate genes that are expressed in the target tissue, that is, the retina, the photoreceptor cell, the RPE cell, and so forth. Among those genes expressed in the target tissue, a candidate gene analysis is then undertaken.

Thus, the sequence information has provided several shortcuts, vastly reducing the time it takes to identify a causative gene lesion. The central problem of finding and recruiting patients and families remains essentially unchanged, however. The ascertainment of the pedigrees remains just as time consuming as before. In certain ways, linkage analysis has become more difficult in that the easier family studies have already been completed, leaving the more challanging ones to be addressed in the present and future.

Back to Top
ACKNOWLEDGEMENTS
The authors wish to thank the following funding agencies: Research to Prevent Blindness, Foundation Fighting Blindness, Fight for Sight, and the National Eye Institute (R03 EY13986).
Back to Top
REFERENCES

1. Lodish HF, Berk A, Zipursky L, et al: Molecular Cell Biology. New York, Scientific American Books, 1999.

2. Watson JD, Hopkins NH, Roberts JW, et al: Molecular Biology of the Gene. Menlo Park, CA, Benjamin Cummings, 1987.

3. Sambrook J, Russell DW: Molecular Cloning: A Laboratory:Manual. Cold Spring Harbor, CSH Laboratory Press. 2001.

4. Ausubel FM, Brent R, Kingston RE et al: Current Protocols in Molecular Biology. New York, John Wiley, 1987.

5. Judson HF: The Eighth Day of Creation. New York, Simon and Schuster; 1979.

6. Storz G: An expanding universe of noncoding RNAs. Science 296:1260–1263, 2002.

7. Southern EM: Detection of specific sequences among DNA fragments separated by gel electrophoresis. J Mol Biol 98:503–517, 1975.

8. Bowes C, Danciger M, Kozak CA et al:. Isolation of a candidate cDNA for the gene causing retinal degeneration in the rd mouse. Proc Natl Acad Sci U S A 86:9722–9726, 1989.

9. Travis GH, Brennan MB, Danielson PE et al Identification of a photoreceptor-specific mRNA encoded by the gene responsible for retinal degeneration slow (rds). Nature 1338:70–73, 1989.

10. Bowes C, Li T, Danciger M et al: Retinal degeneration in the rd mouse is caused by a defect in the beta subunit of rod cGMP-phosphodiesterase. Nature 347:677–680, 1990.

11. Connell G, Bascom R, Molday L et al: Photoreceptor peripherin is the normal product of the gene responsible for retinal degeneration in the rds mouse. Proc Natl Acad Sci U S A 88:723–726, 1991.

12. Adams MD, Kelley JM, Gocayne JD et al: Complementary DNA sequencing: Expressed sequence tags and human genome project. Science 252:1651–1656, 1991.

13. Adams MD, Dubnick M, Kerlavage AR et al: Sequence identification of 2,375 human brain genes. Nature 355:632–634, 1992.

14. Lennon G, Auffray C, Polymeropoulos M et al: The I.M.A.G.E. Consortium: an integrated molecular analysis of genomes and their expression. Genomics 33:151–152, 1996.

15. Bockelmann U, Thomen P, Essevaz-Roulet B et al: Unzipping DNA with optical tweezers: High sequence sensitivity and force flips. Biophys J 82:1537–1553, 2002.

16. Woolley AT, Guillemette C, Li Cheung C et al: Direct haplotyping of kilobase-size DNA using carbon nanotube probes. Nat Biotechnol 18:760–763, 2000.

17. Kasianowicz JJ, Brandin E, Branton D et al: Characterization of individual polynucleotide molecules using a membrane channel. Proc Natl Acad Sci U S A 93:13770–13773, 1996.

18. Fields RR, Zhou G, Huang D et al: Usher syndrome type III: Revised genomic structure of the USH3 gene and identification of novel mutations. Am J Hum Genet 71:607–617, 2002.

19. Mead DA, Pey NK, Herrnstadt C et al: A universal method for the direct cloning of PCR amplified nucleic acid. Biotechnology (NY) 9:657–663, 1991.

20. van 't Veer LJ, Dai H, van de Vijver MJ et al: Gene expression profiling predicts clinical outcome of breast cancer. Nature 415:530–536, 2002.

21. Allikmets R, Singh N, Sun H et al: A photoreceptor cell-specific ATP-binding transporter gene (ABCR) is mutated in recessive Stargardt macular dystrophy. Nat Genet 15:236–246, 1997.

22. Mann M, Hendrickson RC, Pandey A: Analysis of proteins and proteomes by mass spectrometry. Annu Rev Biochem 70:437–473, 2001.

23. Devereux J, Haeberli P, Smithies O: A comprehensive set of sequence analysis programs for the VAX. Nucleic Acids Res 12:387–395, 1984.

24. Maxam AM, Gilbert W: A new method for sequencing DNA. Proc Natl Acad Sci U S A 74:560–564, 1977.

25. Sanger F, Nicklen S, Coulson AR: DNA sequencing with chain-terminating inhibitors. Proc Natl Acad Sci U S A 74:5463–5467, 1977.

26. Marziali A, Akeson M: New DNA sequencing methods. Annu Rev Biomed Eng 3:195–223, 2001.

27. Mou J, Czajkowsky DM, Zhang Y et al: High-resolution atomic-force microscopy of DNA: The pitch of the double helix. FEBS Lett 371:279–282, 1995.

28. Hacia JG: Resequencing and mutational analysis using oligonucleotide microarrays. Nat Genet 21:42–47, 1999.

29. Kurg A, Tonisson N, Georgiou I et al: Arrayed primer extension: Solid-phase four-color DNA resequencing and mutation detection technology. Genet Test 4:1–7, 2000.

30. Saiki RK, Scharf S, Faloona F et al: Enzymatic amplification of beta-globin genomic sequences and restriction site analysis for diagnosis of sickle cell anemia. Science 230:1350–1354, 1985.

31. Mullis KB, Faloona FA: Specific synthesis of DNA in vitro via a polymerase-catalyzed chain reaction. Methods Enzymol 155:335–350, 1987.

32. Orita M, Iwahana H, Kanazawa H et al: Detection of polymorphisms of human DNA by gel electrophoresis as single-strand conformation polymorphisms. Proc Natl Acad Sci U S A 86:2766–2770, 1989.

33. Inglehearn CF, Bashir R, Lester DH et al: A 3-bp deletion in the rhodopsin gene in a family with autosomal dominant retinitis pigmentosa. Am J Hum Genet 48:26–30, 1991.

34. Keen J, Lester D, Inglehearn C et al: Rapid detection of single base mismatches as heteroduplexes on Hydrolink gels. Trends in Genet 7:5, 1991.

35. Newton CR, Graham A, Heptinstall LE et al: Analysis of any point mutation in DNA. The amplification refractory mutation system (ARMS). Nucleic Acids Res 17:2503–2516, 1998.

36. Cotton RG, Rodrigues NR, Campbell RD: Reactivity of cytosine and thymine in single-base-pair mismatches with hydroxylamine and osmium tetroxide and its application to the study of mutations. Proc Natl Acad Sci U S A 85:4397–4401, 1988.

37. Levinson B, Janco R, Phillips Jr et al: A novel missense mutation in the factor VIII gene identified by analysis of amplified hemophilia DNA sequences. Nucleic Acids Res 15:9797–9805, 1987.

38. Myers RM, Fischer SG, Lerman LS et al: Nearly all single base substitutions in DNA fragments joined to a GC-clamp can be detected by denaturing gradient gel electrophoresis. Nucleic Acids Res 13:3131–3145, 1985.

39. Wu DY, Ugozzoli L, Pal BK et al: Allele-specific enzymatic amplification of beta-globin genomic DNA for diagnosis of sickle cell anemia. Proc Natl Acad Sci U S A 86:2757–2760, 1989.

40. Ruano G, Kidd KK: Direct haplotyping of chromosomal segments from multiple heterozygotes via allele-specific PCR. Nucleic Acids Res 20:8392, 1989.

41. Gibbs RA, Nguyen PN, Caskey CT: Detection of single DNA base differences by competitive oligonucleotide priming. NucleicAcids Res 17:2437–2448, 1989.

42. Hoogendoorn B, Norton N, Kirov G et al Cheap, accurate and rapid allele frequency estimation of single nucleotide polymorphisms by primer extension and DHPLC in DNA pools. Hum Genet 107:488–493, 2000.

43. Kwok PY: Methods for genotyping single nucleotide polymorphisms. Annu Rev Genomics Hum Genet 2:235–258, 2001.

44. Kimura M: The neutral theory of molecular evolution. Sci Am 241:98–100, 1979.

45. Cardon LR, Abecasis GR: Using haplotype blocks to map human complex trait loci. Trends Genet 19:135–140, 2003.

46. Nakamura Y, Leppert M, O'Connell P et al: Variable number of tandem repeat (VNTR) markers for human gene mapping. Science 235:1616–1622, 1987.

47. Weber JL, May PE: Abundant class of human DNA polymorphisms which can be typed using the polymerase chain reaction. Am J Hum Genet 44:388–396, 1989.

48. Economou EP, Bergen AW, Warren AC et al: The polydeoxyadenylate tract of Alu repetitive elements is polymorphic in the human genome. Proc Natl Acad Sci U S A 87:2951–2954, 1990.

49. Daiger SP, Rossiter BJF, Greenberg J et al: Data services and software for identifying genes and mutations causing retinal degeneration. Invest Ophthalmol Vis Sci 39:S295, 1998.

50. Biousse V, Newman NJ: Neuro-ophthalmology of mitochondrial diseases. Curr Opin Neurol 16:35–43, 2003.

51. Newman NJ: From genotype to phenotype in Leber hereditary optic neuropathy: Still more questions than answers. J Neuroophthalmol 22:257–261, 2002.

52. Wallace DC: Animal models for mitochondrial disease. Methods Mol Biol 197:3–54, 2002.

53. Shoffner JM, Lott MT, Voljavec AS et al: Spontaneous Kearn-Sayre/chronic external ophthalmoplegia plus syndrome associated with a mitochondrial DNA deletion: A slip replication model and metabolic therapy. Proc Natl Acad Sci U S A 86:7952–7956, 1989.

54. Wallace DC, Singh G, Lott MT et al: Mitochondrial DNA mutation associated with Leber's hereditary optic neuropathy. Science 242:1427–1430, 1988.

55. Howell N, Bindoff LA, McCullough DA et al: Leber Hereditary optic neuropathy: Identification of the same mitochondrial ND1 mutation in six pedigrees. Am J Hum Genet 49:939–950, 1991.

56. Howell N, Kubacka I, Xu M et al: Leber Hereditary Optic Neuropathy: Involvement of the Mitochondrial ND1 gene and evidence for an intragenic suppressor mutation. Am J Hum Genet 48:935–942, 1991.

57. Huoponen K: Leber hereditary optic neuropathy: Clinical and molecular genetic findings. Neurogenetics 3:119–125, 20011.

58. Man PY, Turnbull DM, Chinnery PF: Leber hereditary optic neuropathy. J Med Genet 39:162169, 2002.

59. Mashima Y, Kigasawa K, Wakakura M et al: Do idebenone and vitamin therapy shorten the time to achieve visual recovery in Leber hereditary optic neuropathy?J Neuroophthalmol 20:166–170, 2000.

60. Chinnery PF, Turnbull DM: Epidemiology and treatment of mitochondrial disorders. Am J Med Genet 106:94–101, 2001.

61. Brody LC, Mitchell GA, Obie C et al: Ornithine delta-aminotransferase mutations in gyrate atrophy. Allelic heterogeneity and functional consequences. J Biol Chem 267:3302–3307, 1992.

62. Inana G, Hotta Y, Zintz C et al: Expression defect of ornithine aminotransferase gene in gyrate atrophy. Invest Ophthalmol Vis Sci 29:1001–1005, 1988.

63. Mashima Y, Murakami A, Weleber RG et al: Nonsense-codon mutations of the ornithine aminotransferase gene with decreased levels of mutant mRNA in gyrate atrophy. Am J Hum Genet 51:81–91, 1992.

64. Brawerman G: mRNA decay: Finding the right targets. Cell 57:9–10, 1989.

65. Akaki Y, Hotta Y, Mashima Y et al: A deletion in the ornithine aminotransferase gene in gyrate atrophy. J Biol Chem 267:12950–12954, 1992.

66. Inana G, Chambers C, Hotta Y et al: Point mutation affecting processing of the ornithine aminotransferase precursor protein in gyrate atrophy. J Biol Chem 264:17432–17436, 1989.

67. Kuwabara T, Ishikawa Y, Kaiser-Kupfer MI: Experimental model of gyrate atrophy in animals. Ophthalmology 88:331–335, 1981.

68. Ando A, Ueda M, Uyama M et al: Heterogeneity in ornithine cytotoxicity of bovine retinal pigment epithelial cells in primary culture. Exp Eye Res 70:89–96, 2000.

69. Ueda M, Masu Y, Ando A et al: Prevention of ornithine cytotoxicity by proline in human retinal pigment epithelial cells. Invest Ophthalmol Vis Sci 39:820–827, 1998.

70. Wang T, Milam AH, Steel G et al: A mouse model of gyrate atrophy of the choroid and retina. Early retinal pigment epithelium damage and progressive retinal degeneration. J Clin Invest 97:2753–2762, 1996.

71. Wang T, Steel G, Milam AH et al: Correction of ornithine accumulation prevents retinal degeneration in a mouse model of gyrate atrophy of the choroid and retina. Proc Natl Acad Sci U S A 97:1224–1229, 2000.

72. Kaiser-Kupfer MI, Caruso RC, Valle D: Gyrate atrophy of the choroid and retina: further experience with long-term reduction of ornithine levels in children.120:146–153, 2002.

73. Spirito F, Meneguzzi G, Danos O et al:. Cutaneous gene transfer and therapy: the present and the future. J Gene Med 3:21–31, 2001.

74. Robertson D: Gene pill patents a surprise for gene therapy. Nat Biotechnol 19:604–605, 2001.

75. Fogarty M: New pill box possibilities. Scientist 17:21, 2003.

76. Hawes NL, Smith RS, Chang B et al: Mouse fundus photography and angiography: A catalogue of normal and mutant phenotypes. Mol Vis 5:22, 1999.

77. Chang B, Hawes NL, Hurd RE et al: Retinal degeneration mutants in the mouse. Vision Res 42:517–525, 2002.

78. Farber DB, Lolley RN: Cyclic guanosine monophosphate: Elevations in degenerating photoreceptor cells of the C3H mouse retina. Science 186:449–451, 1974.

79. Lolley RN, Farber DB. Abnormal guanosine 3' 5'-monophosphate during photoreceptor degeneration in the inherited disorder of C3H/HeT mice. Ann Ophthalmol 8:469, 1976.

80. Lipkin VM, Khramtsov NV, Vasilevaskaya IA et al: The beta-subunit of bovine rod photoreceptor cGMP phosphodiesterase. Comparison with the phosphodiesterase family. J Biol Chem 265:12955–12959, 1990.

81. Pittler SJ, Baehr W: Identification of a nonsense mutation in the rod photoreceptor cGMP phosphodiesterase beta-subunit gene of the rd mouse. Proc Natl Acad Sci U S A 88:8322–8326, 1991.

82. Bowes C, Li T, Danciger M et al: Localization of a retroviral element within the rd gene coding for the beta subunit of cGMP phosphodiesterase. Proc Natl Acad Sci U S A 90:2955–2959, 1993.

83. Yan W, Lewin A, Hauswirth W: Selective degradation of nonsense beta-phosphodiesterase mRNA in the heterozygous rd mouse. Invest Ophthalmol Vis Sci 39:2529–2536, 1998.

84. Culbertson MR: RNA surveillance. Unforeseen consequences for gene expression, inherited genetic disorders and cancer. Trends Genet 15:74–80, 1999.

85. Maquat LE: NASty effects on fibrillin pre-mRNA splicing: Another case of ESE does it, but proposals for translation-dependent splice site choice live on. Genes Dev 16:1743–1753, 2002.

86. Travis GH, Groshan KR, Lloyd M et al: Complete rescue of photoreceptor dysplasia and degeneration in transgenic retinal degeneration slow (rds) mice. Neuron 9:113–119, 1992.

87. Molday RS, Hicks D, Molday L: Peripherin. A rim-specific membrane protein of rod outer segment discs. Invest Ophthalmol Vis Sci 28:50–61, 1987.

88. Goldberg AF, Fales LM, Hurley JB et al: Folding and subunit assembly of photoreceptor peripherin/rds is mediated by determinants within the extracellular/intradiskal EC2 domain: implications for heterogeneous molecular pathologies. J Biol Chem 276:42700–42706, 2001.

89. Wrigley JD, Ahmed T, Nevett CL et al: Peripherin/rds influences membrane vesicle morphology. Implications for retinopathies. J Biol Chem 275:13191–13194, 2000.

90. Kajiwara K, Hahn LB, Mukai S et al: Mutations in the human retinal degeneration slow gene in autosomal dominant retinitis pigmentosa. Nature 354:480–483, 1991.

91. Jordan SA, Farrar GJ, Kumar-Singh R et al: Autosomal dominant retinitis pigmentosa (adRP; RP6): Cosegregation of RP6 and the peripherin-RDS locus in a late-onset family of Irish origin. Am J Hum Genet 50:634–639, 1992.

92. McWilliams P, Farrar GJ, Kenna P et al: Autosomal dominant retinitis pigmentosa (ADRP): Localization to the long arm of chromosome 3. Genomics 5:619–622, 1989.

93. Dryja TP, McGee TL, Reichel E et al: A point mutation of the rhodopsin gene in one form of retinitis pigmentosa. Nature 43:364–366, 1990.

94. Jacobson SG, Kemp CM, Sung CH et al: Retinal function and rhodopsin levels in autosomal dominant retinitis pigmentosa with rhodopsin mutations. Am J Ophthalmol 112:256–271, 1991.

95. Olsson JE, Gordon JW, Pawlyk BS et al: Construction of transgenic mice that carry a mutant copy of the human rhodopsin gene (pro23his). Invest Ophthalmol Vis Sci 32:782, 1991.

96. Sung CH, Schneider BG, Agarwal N et al: Functional hetergeneity of mutant rhodopsins responsible for autosomal dominant retinitis pigmentosa. Proc Natl Acad Sci U S A 88:8840–8844, 1991.

97. Kaushal S, Khorana HG: Structure and function in rhodopsin. 7. Point mutations associated with autosomal dominant retinitis pigmentosa. Biochemistry 33:6121–6128, 1994.

98. Breikers G, Portier-VandeLuytgaarden MJ, Bovee-Geurts PH et al: Retinitis pigmentosa–associated rhodopsin mutations in three membrane-located cysteine residues present three different biochemical phenotypes. Biochem Biophys Res Commun 297:847–853, 2002.

99. Gal A, Artlich A, Ludwig M et al: Pro-347-Arg mutation of the rhodopsin gene in autosomal dominant retinitis pigmentosa. Genomics 11:468–470, 1991.

100. Fotiadis D, Liang Y, Filipek S et al: Atomic-force microscopy: Rhodopsin dimers in native disc membranes. Nature 421:127–128, 2003.

101. Palczewski K, Kumasaka T, Hori T et al: Crystal structure of rhodopsin: A G protein-coupled receptor. Science 289:739–745, 2000.

102. Okada T, Fujiyoshi Y, Silow M et al: Functional role of internal water molecules in rhodopsin revealed by X-ray crystallography. Proc Natl Acad Sci U S A 99:5982–5987, 2002.

103. Filipek S, Stenkamp RE, Teller DC et al: G protein-coupled receptor rhodopsin: A prospectus. Annu Rev Physiol 65:851–879, 2003.

104. Klausner RD, Sitia R: Protein degradation in the endoplasmic reticulum. Cell 62:611–614, 1990.

105. Friedlander M, Blobel G: Bovine opsin has more than one signal sequence. Nature 318:338–343, 1985.

106. Fishman GA, Stone EM, Sheffield VC et al: Ocular findings associated with rhodopsin gene codon 17 and codon 182 transition mutations in dominant retinitis pigmentosa. Arch Ophthalmol 110:54–62, 1992.

107. Stone EM, Kimura AE, Nichols BE et al: Regional distribution of retinal degeneration in patients with the proline to histidine mutation in codon 23 of the rhodopsin gene. Ophthalmology 98:1806–1813, 1991.

108. Berson EL, Rosner B, Weigel-DiFranco C et al: Disease progression in patients with dominant retinitis pigmentosa and rhodopsin mutations. Invest Ophthalmol Vis Sci 43:3027–3036, 2002.

109. Saliba RS, Munro PM, Luthert PJ et al: The cellular fate of mutant rhodopsin: quality control, degradation and aggresome formation. J Cell Sci 115:2907–2918, 2002.

110. Kopito RR: Aggresomes, inclusion bodies and protein aggregation. Trends Cell Biol 10:524–530, 2000.

111. Illing ME, Rajan RS, Bence NF et al: A rhodopsin mutant linked to autosomal dominant retinitis pigmentosa is prone to aggregate and interacts with the ubiquitin proteasome system. J Biol Chem 277:34150–34160, 2002.

112. Oda Y, Hosokawa N, Wada I et al: EDEM as an acceptor of terminally misfolded glycoproteins released from calnexin. Science 299:1394–1397, 2003.

113. Molinari M, Calanca V, Galli C et al: Role of EDEM in the release of misfolded glycoproteins from the calnexin cycle. Science 299:1397–1400, 2003.

114. Sieving PA, Richards JE, Bingham EL et al: Dominant congenital complete nyctalopia and Gly90Asp rhodopsin mutation. Invest Ophthalmol Vis Sci 33:1397, 1992.

115. U, Rao VR, Cohen GB, Oprian DD: Rhodopsin mutation G90D and a molecular mechanism for congenital night blindness. Nature 367:639–642, 1994.

116. Sieving PA, Fowler ML, Bush RA et al: Constitutive “light” adaptation in rods from G90D rhodopsin: A mechanism for human congenital nightblindness without rod cell loss. J Neurosci 21:5449–5460, 2001.

117. Rosenfeld PJ, Cowley GS, Hahn LB et al: A null mutation within the rhodopsin gene in a family with autosomal recessive retinitis pigmentosa. Invest Ophthalmol Vis Sci 33:1397, 1992.

118. Heckenlively JR, Rodriguez JA, Daiger SP: Autosomal dominant sectoral retinitis pigmentosa. Two families with transversion mutation in codon 23 of rhodopsin. Arch Ophthalmol 109:84–91, 1991.

119. Blanton SH, Cottingham AW, Giesenschlag N et al Further evidence of exclusion of linkage between type II autosomal dominant retinitis pigmentosa (ADRP) and D3S47 on 3q. Genomics 8:179–181, 1990.

120. Blanton SH, Heckenlively JR, Cottingham AW et al: Linkage mapping of autosomal dominant retinitis pigmentosa (RP1) to the pericentric region of human chromosome 8. Genomics 1991; 11:857–869, 1991.

121. Sullivan LS, Heckenlively JR, Bowne SJ et al: Mutations in a novel retina-specific gene cause autosomal dominant retinitis pigmentosa. Nat Genet 22:255–259, 1999.

122. Pierce EA, Quinn T, Meehan T et al: Mutations in a gene encoding a new oxygen-regulated photoreceptor protein cause dominant retinitis pigmentosa. Nat Genet 22:248–254, 1999.

123. Guillonneau X, Piriev NI, Danciger M et al: A nonsense mutation in a novel gene is associated with retinitis pigmentosa in a family linked to the RP1 locus. Hum Mol Genet 8:1541–1546, 1999.

124. Nathans J, Thomas D, Hogness DS: Molecular genetics of human color vision: The genes encoding blue, green, and red pigments. Science 232:193–202, 1986.

125. Nathans J, Piantanida TP, Eddy R et al:. Molecular genetics of inherited variation in human color vision. Science 232:203–210, 1986.

126. Nathans J, Hogness DS: Isolation and nucleotide sequence of the gene encoding human rhodopsin. Proc Natl Acad Sci U S A 81:4851–4855, 1984.

127. Lewis RA, Holcomb JD, Bromley WC et al: Mapping X-linked ophthalmic diseases. III. Provisional assignment of the locus for blue cone monochromacy to Xq28. Arch Ophthalmol 105:1055–1059, 1987.

128. Nathans J, Davenport CM, Maumenee IH et al: Molecular genetics of human blue cone monochromacy. Science 245:831–838, 1989.

129. Li T, Zierath P, Went L, et al: Substitution of a highly conserved amino acid residue in the S-cone (blue) photopigment may be the casue of tritan defect in a Dutch pedigree. Invest Ophthalmol Vis Sci 783, 1991.

130. Weitz CJ, Miyake Y, Shinzato K et al: Human tritanopia associated with two amino acid substitutions in the blue sensitive opsin. Am J Hum Genet 50:498–507, 1992.

131. Neitz M, Neitz J: Molecular genetics of color vision and color vision defects. Arch Ophthalmol 118:691–700, 2000.

132. Dryja TP, Rapaport JM, Joyce JM et al: Molecular detection of deletions involving band q14 of chromosome 13 in retinoblastomas. Proc Natl Acad Sci U S A 83:7391–7394, 1986.

133. Knudson AG: Mutation and Cancer: Statistical study of retinoblastoma. Proc Natl Acad Sci U S A 68:820–823, 1971.

134. Sparkes RS, Sparkes MC, Wilson MG et al: Regional assignment of genes for human esterase D and retinoblastoma to chromosome band 13q14. Science 208:1042–1044, 1980.

135. Strong LC, Riccardi VM, Ferrell RE et al: Familial retinoblastoma and chromosome 13 deletion transmitted via an insertional translaocation. Science 213:1501–1503, 1981.

136. Friend SH, Bernards R, Rogelj S et al: A human DNA segment with properties of the gene that predisposes to retinoblastoma and osteosarcoma. Nature 323:643–646, 1986.

137. Lee WH, Shew JY, Hong F et al: The retinoblastoma susceptibility gene product is a nuclear phosphoprotein associated with DNA binding activity. Nature 329:642–645, 1987.

138. Dyson N: The regulation of E2F by pRB-family proteins. Genes Dev 12:2245–2262, 1998.

139. Mittnacht S: Control of pRB phosphorylation. Curr Opin Genet Dev 8:21–27, 1998.

140. Zhang HS, Gavin M, Dahiya A et al: Exit from G1 and S phase of the cell cycle is regulated by repressor complexes containing HDAC-Rb-hSWI/SNF and Rb-hSWI/SNF. Cell 101:79–89, 2000.

141. Brown VD, Gallie BL: The B-domain lysine patch of pRB is required for binding to large T antigen and release of E2F by phosphorylation. Mol Cell Biol 22:1390–1401, 2002.

142. Dahiya A, Gavin MR, Luo RX et al: Role of the LXCXE binding site in Rb function. Mol Cell Biol 20:6799–6805, 2000.

143. Richter S, Vandezande K, Chen N et al: Sensitive and efficient detection of rb1 gene mutations enhances care for families with retinoblastoma. Am J Hum Genet 72:253–269, 2003.

144. Pak WL: Molecular genetic studies of photoreceptor function using Drosophila mutants. In FarberDB, ChaderGJ (eds): The Molecular Biology of the Retina. Progress in Clinical and Biological Research, pp 1–32, Vol. 362. New York, Wiley-Liss, 1991.

145. Tomlinson A, Kimmel BE, Rubin GM: rough, a Drosophila homeobox gene required in photoreceptors R2 and R5 for inductive interactions in the developing eye. Cell 55:771–784, 1988.

146. Washburn T, O'Tousa JE: Nonsense suppression of the major rhodopsin gene of Drosophila. Genetics 130:585–595, 1992.

147. Washburn T, O'Tousa JE. Molecular defects in Drosophila rhodopsin mutants. J Biol Chem 264:15464–15466, 1989.

148. Webel R, Menon I, O'Tousa JE et al: Role of asparagine-linked oligosaccharides in rhodopsin maturation and association with its molecular chaperone, NinaA. J Biol Chem 275:24752–24759, 2000.

149. Quiring R, Walldorf U, Kloter U et al. Homology of the eyeless gene of Drosophila to the small eye gene in mice and aniridia in humans. Science 265:785–789, 1994.

150. Halder G, Callaerts P, Gehring WJ: Induction of ectopic eyes by targeted expression of the eyeless gene in Drosophila. Science 267:1788–1792, 1995.

151. Kumar JP, Moses K: Eye specification in Drosophila: Perspectives and implications. Semin Cell Dev Biol 12:469–474, 2001.

152. Ott J: Analysis of Human Genetic Linkage. Baltimore: Johns Hopkins Press; 1991.

153. Lander E, Kruglyak L: Genetic dissection of complex traits: guidelines for interpreting and reporting linkage results. Nat Genet 11:241–247, 1995.

154. Ott J: Estimation of the recombination fraction in human pedigrees: Efficient computation of the likelihood for human linkage studies. Am J Hum Genet 26:588–597, 1974.

155. Lathrop GM, Lalouel JM: Easy calculations of lod scores and genetic risks on small computers. Am J Hum Genet 36:460–465, 1984.

156. Cottingham RWJ, Idury RM, Schaffer AA: Faster sequential genetic linkage computations. Am J Hum Genet 53:252–263, 1993.

157. O'Connell JR, Weeks DE': The VITESSE algorithm for rapid exact multilocus linkage analysis via genotype set-recoding and fuzzy inheritance. Nat Genet 11:402–408, 1995.

158. Kruglyak L, Daly MJ, Reeve-Daly MP et al: Parametric and nonparametric linkage analysis: a unified multipoint approach. Am J Hum Genet 58:1347–1363, 1996.

159. Davis S, Schroeder M, Goldin LR et al: Nonparametric simulation-based statistics for detecting linkage in general pedigrees. Am J Hum Genet 58:867–880, 1996.

160. Botstein D, White RL, Skolnick M et al: Construction of a genetic linkage map in man using restriction fragment length polymorphisms. Am J Hum Genet 32:314–331, 1980.

161. Motro U, Thomson G: The affected sib method. I. Statistical features of the affected sib-pair method. Genetics 110:525–538, 1985.

162. Lander ES, Botstein D: Homozygosity mapping: A way to map human recessive traits with the DNA of inbred children. Science 236:1567–1570, 1987.

163. Ploughman LM, Boehnke M: Estimating the power of a proposed linkage study for a complex genetic trait. Am J Hum Genet 44:543–551, 1989.

164. van Ommen GJ, Verkerk JM, Hofker MH et al: A physical map of 4 million bp around the Duchenne muscular dystrophy gene on the human X-chromosome. Cell 47:499–504, 1986.

165. Collins FS, Drumm ML, Cole JL et al: Construction of a general human chromosome jumping library, with application to cystic fibrosis. Science 235:1046–1049, 1987.

166. Riethman HC, Moyzis RK, Meyne J et al: Cloning human telomeric DNA fragments into Saccharomyces cerevisiae using a yeast-artificial-chromosome vector. Proc Natl Acad Sci U S A 86:6240–6244, 1989.

167. Cox DR, Pritchard CA, Uglum E et al: Segregation of the Huntington disease region of human chromosome 4 in a somatic cell hybrid. Genomics 4:397–407, 1989.

168. Lindsay S, Bird AP: Use of restriction enzymes to detect potential gene sequences in mammalian DNA. Nature 327:336–338, 1987.

169. Bhattacharya SS, Wright AF, Clayton JF et al: Close genetic linkage between X-linked retinitis pigmentosa and a restriction fragment length polymorphism identified by recombinant DNA probe L1.28. Nature 309:253–255, 1984.

170. Mitchell GA, Brody LC, Looney J et al: An initiator codon mutation in ornithine-delta-aminotransferase causing gyrate atrophy of the choroid and retina. J Clin Invest 81:630–633, 1988.

171. Ramesh V, McClatchey AI, Ramesh N et al: Molecular basis of ornithine aminotransferase deficiency in B-6-responsive and -nonresponsive forms of gyrate atrophy. Proc Natl Acad Sci U S A 85:3777–3780, 1988.

172. Michaud J, Brody LC, Steel G et al: Strand-separating conformational polymorphism analysis: efficacy of detection of point mutations in the human ornithine delta-aminotransferase gene. Genomics 13:389–394, 1992.

173. Kobayashi T, Ogawa H, Kasahara M et al: A single amino acid substitution within the mature sequence of ornithine aminotransferase obstructs mitochondrial entry of the precursor. Am J Hum Genet 57:284–291, 1995.

174. Dietz HC, Valle D, Francomano CA et al: The skipping of constitutive exons in vivo induced by nonsense mutations. Science 259:680–683, 1993.

175. Mitchell GA, Brody LC, Sipila I et al: At least two mutant alleles of ornithine delta-aminotransferase cause gyrate atrophy of the choroid and retina in Finns. Proc Natl Acad Sci U S A 86:197–201, 1989.

176. Kaufman DL, Ramesh V, McClatchey A et al: Detection of point mutations associated with genetic diseases by an exon scanning technique. Genomics 8:656–663, 1990.

177. Michaud J, Thompson GN, Brody LC et al: Pyridoxine-responsive gyrate atrophy of the choroid and retina: Clinical and biochemical correlates of the mutation A226V. Am J Hum Genet 56:616–622, 1995.

178. Park JK, Herron BJ, O'Donnell JJ et al: Three novel mutations of the ornithine aminotransferase (OAT) gene in gyrate atrophy. Genomics 14:553–554, 1992.

179. Mashima YG, Weleber RG, Kennaway NG et al: Genotype-phenotype correlation of a pyridoxine-responsive form of gyrate atrophy. Ophthalmic Genet 20:219–224, 1999.

180. Sung CH, Davenport CM, Nathans J: Rhodopsin mutations responsible for autosomal dominant retinitis pigmentosa. Clustering of functional classes along the polypeptide chain. J Biol Chem 268:26645–26649, 1993.

181. Young RA, Davis RW. Efficient isolation of genes by using antibody probes. Proc Nat'l Acad Sci (USA) 80:1194–1198, 1983.

182. Young RA, Davis RW: Yeast RNA polymerase II genes: Isolation with antibody probes. Science 222:778–782, 1983.

183. Boatright JH, Stodulkova E, Do VT, et al: The effect of retinoids and butyrate on the expression of CRX and IRBP in retinoblastoma cells. Vision Res 42:933–938, 2002.

Back to Top
APPENDIX I

SAMPLE RETRIEVAL OF DATABASE ENTRIES CONTAINING THE WORD PHOTORECEPTOR

! STRINGSEARCH from: GenEMBL:* July 6, 1992 09:22

! searching for: “photoreceptor”

Gbn:Cycirbpex 1_Z11807 C.variegatus interphotoreceptor retinoid binding protein gene, exon 13/92 1,188 bp

Gbn:Gcrirbpex 1_Z11805 G.crassicaudatus interphotoreceptor retinoid bindingprotein gene, exon 1. 3/92 1,189bp

Gb_nlm:s112_s112 [Genomic Mutant 298 nt](introns f and g and exon 7) rd = cGMP phosphodiesterase beta-subunit

Gb_in:Drorh92cd_Y00043 Drosophila R7 photoreceptor cell opsin gene. 3/88 2,500 bp

Gb_om:Bovcgmpch_X51604 B.taurus RNA for cGMP-gated channel from retinal rod photoreceptor l/92 2,682bp

Gb_om:Bovirbp_M20748 Bovine interphotoreceptor retinoid-binding protein gene, complete cds. 12/89 11,793bp

Gb_om:Bovirbpa_M32733 Bovine interphotoreceptor retinoidbinding protein (IRBP) gene, 5( flank. 12/91, 4,500 bp

Gb_om:Bovirbpaa_M26119 Bovine interphotoreceptor retinoid-binding protein (IRBP) mRNA, partial cds. 12/89 84bp

Gb_om:Bovpdeap_M33140 Bovine cone photoreceptor cyclic nucleotide phosphodiesterase alpha(-subunit (PDE), partial

Gb_pr:Humcnpbl_M13295 Human blue cone photoreceptor pigment gene, exon 1. 3/90 749bp

Gb_pr:Humcnpb2_M13296 Human blue cone photoreceptor pigment gene, exon 2. 3/90 182 bp

Gb_pr:Humcnpb3_M13297 Human blue cone photoreceptor pigment gene, exon 3. 3/90 182bp

Gb_pr:Humcnpb4_M13298 Human blue cone photoreceptor pigment gene, exon 4. 3/90 290bp

Gb_pr:Humcnpb5_M13299 Human blue cone photoreceptor pigment gene, exon 5. 3/90 377 bp

Gb_pr:Humcnpgl_M13306 Human green cone photoreceptor pigment gene 1, exon 1. 6/89 609bp

Gb_pr:Humcnpg2_K03490 Human green cone photoreceptor pigment gene 1, exon 2. 6/89 290bp

Gb_pr:Humcnpg3_K03491 Human green cone photoreceptor pigment gene 1, exon 3. 6/89 182bp

Gb_pr:Humcnpg4_K03492 Human green cone photoreceptor pigment gene 1, exon 4. 6/89 182bp

Gb_pr:Humcnpg5_K03493 Human green cone photoreceptor pigment gene 1, exon 5. 6/89 290bp

Gb_pr:Humcnpg6_K03494 Human green cone photoreceptor pigment gene 1, exon 6. 6/89 208bp

Gb_pr:Humcnprl_M13300 Human red cone photoreceptor pigment gene, exon 1. 6/89 609bp

Gb_pr:Humcnpr2_M13301 Human red cone photoreceptor pigment gene, exon 2. 6/89 290bp

Gb_pr:Humcnpr3_M13302 Human red cone photoreceptor pigment gene, exon 3. 6/89 182bp

Gb_pr: Humcnpr4_M13303 Human red cone photoreceptor pigment gene, exon 4. 6/89 183bp

Gb_pr:Humcnpr5_M13304 Human red cone photoreceptor pigment gene, exon 5. 6/89 290bp

Gb_pr:Humcnpr6_M13305 Human red cone photoreceptor pigment gene, exon 6. 6/89 388bp

Gb_pr:Humcpgal_K03495 Human green cone photoreceptor pigment gene 2, exon 3. 4/87 182bp

Gb_pr:Humcpga2_K03496 Human green cone photoreceptor pigment gene 2, exon 4. 4/87 182bp

Gb_pr:Humcpga3_K03497 Human green cone photoreceptor pigment gene 2, exon 5. 4/87 290bp

Gb_pr:Humirbp_M22453 Human interphotoreceptor retinoid-binding protein (IRBP) mRNA, complete cds. 9/89 4,275 bp

Gb_pr: Humirbph_X53044 Human gene for interphotoreceptor retinoid-binding protein (IRBP) promoter region and firs

Gb_pr:Humirbps3_J05469 Human interphotoreceptor retinoid-binding protein (IRBP) gene, 5( end. 4/90 1,325bp

Gb_ro:Musirbp_M32734 Mouse interphotoreceptor retinoid-binding protein (IRBP) gene, 5( end. 12/91 1,931bp

Gb_ro:Ratirbp_X56159 Rat IRBP mRNA coding for interphotoreceptor retinol-binding protein 6/91 3bp

Emn:Cvirbpex1_Z11807 C.variegatus interphotoreceptor retinoid binding protein gene, exon 1. 3/92 1,188bp

Emn:Dvirbpex1_Z11814 D.virginiana interphotoreceptor retinoid binding protein gene, exon 1. 3/92 1,243 bp

Emn:Fcirbpex1_Z11811 F.catus interphotoreceptor retinoid binding protein gene, exon 1. 3/92 1,150bp

Emn:Gcirbpex1_Z11805 G.crassicaudatus interphotoreceptor retinoid binding protein gene, exon 1. 3/92 1,189bp

Emn:Mdirbpex1_Z11813 M.domesticus interphotoreceptor retinoid binding protein gene, exon 1. 3/92 1,248bp

Emn:Ocirbpex1_Z11812 O.cuniculus interphotoreceptor retinoid binding protein gene, exon 1. 3/92 935bp

Emn:Phirbpex1_Z11809 P. hypomelanus interphotoreceptor retinoid binding protein gene, exon 1. 3/92 1,092bp

Emn:Tbirbpex1_Z11810 T.bidens interphotoreceptor retinoid binding protein gene, exon 1. 3/92 1,153bp

Emn:Tgirbpex1_Z11808 T.glis interphotoreceptor retinoid binding protein gene, exon 1. 3/92 1,142bp

Emn:Tsirbpex1_Z11806 T.syrichta interphotoreceptor retinoid binding protein gene, exon 1. 3/92 1,192bp

Emn:Tsirbpey1_Z11829 T.silvicola interphotoreceptor retinoid binding protein gene, exon 1. 3/92 1,123bp

Em_om:Dvirbpex1_Z11814 D.virginiana interphotoreceptor retinoid binding protein gene, exon 1. 3/92 1,243bp

Em_om:Fcirbpex1_Z11811 F. catus interphotoreceptor retinoid binding protein gene, exon 1. 3/92 1,150bp

Em_om:Ocirbpex1_Z11812 O.cuniculus interphotoreceptor retinoid binding protein gene, exon 1. 3/92 935bp

Em_om:Phirbpex1_Z11809 P.hypomelanus interphotoreceptor retinoid binding protein gene, exon 1. 3/92 1,092bp

Em_om:Tbirbpex1_Z11810 T.bidens interphotoreceptor retinoid binding protein gene, exon 1. 3/92 1,153bp

Em_om:Tgirbpex1_Z11808 T.glis interphotoreceptor retinoid binding protein gene, exon 1. 3/92 1,142bp

Em_om:Tsirbpeyl_Z11829 T.silvicola interphotoreceptor retinoid binding protein gene, exon 1. 3/92 1,123bp

Em_pr: Cvirbpex1_Z11807 C.variegatus interphotoreceptor retinoid binding protein gene, exon 1. 3/92 1,188bp

Em_pr:Gcirbpex1_Z11805 G.crassicaudatus interphotoreceptor retinoid binding protein gene, exon 1. 3/92 1,189bp

Em_pr:Tsirbpex1_Z11806 T.syrichta interphotoreceptor retinoid binding protein gene, exon 1. 3/92 1,192bp

Em_ro: Mdirbpex1_Z11813 M.domesticus interphotoreceptor retinoid binding protein gene, exon 1. 3/92 1,248bp

! Sequences searched: 90472

Back to Top
APPENDIX II

LINKAGE ANALYSIS: AN EXAMPLE OF THE ANALYSIS OF AN AUTOSOMAL DOMINANT DISEASE LINKED TO A MARKER

In this example we define a marker locus as M and its two alleles as M and m. The disease locus is D, and its alleles are D and d. We assume that the disease is fully penetrant and shows no variable expressivity. We have no information in this pedigree beyond the nuclear family, the parents and their offspring; thus, we know nothing about the phase of the alleles, that is, whether D and M alleles are on the same chromatid or on the opposite chromatids. We define the recombination frequency, θ, as the number of offspring with a recombination event divided by the total number of offspring (Fig. 20). Potentially, none of the offspring may have been derived from a recombination event or all may have the recombination event. Thus 0 < θ < 1. The frequency of no recombination event is 1 - θ. The geneticist would like to know how far apart the loci for D and M are in genetic distance. Similarly, the molecular biologist would like to know how far apart these two loci are in bases, a physical distance.

Fig. 20. Genetic linkage study. Measurement of the recombination fraction quantifies the degree of linkage of two loci, in this case a disease gene, D, and a marker gene, M. The recombination fraction, θ, is the ratio of the number of recombined chromatids to the total number of chromatids.

For short distances the recombination fraction is roughly equal to the genetic distance, and as a rule of thumb, 1% recombination is roughly equal to 1 million base pairs. We can calculate the likelihood of finding a pattern of inheritance of marker alleles and disease alleles in a particular pedigree for any value of θ. This probability is compared to the probability that θ = 1/2. This is the odds ratio. We chose θ = 1/2, because this value is approached when a marker and a disease are very far apart or because the marker and gene are so far apart that it is equally likely that there have been an even number of recombinations versus an odd number of recombination events between the two. The marker and disease loci no longer behave as though they are tied together; each segregates in a pedigree independently of the other. Thus, the odds ratio is the ratio of the probability P(θ = x)/P(θ = 1/2), or the probability that the disease and marker are linked with a given recombination fraction, θ, versus the probability that they are not linked and assort independently of one another. Normally this ratio is expressed as the log10 of the odds or lod score. Let us now consider a specific case as shown in Figure 21A. The father is a heterozygote for the disease (D/d) and a heterozygote for the marker (M/m). The mother is homozygous unaffected (d/d) at the disease locus and homozygous at the marker locus (m/m). Because we do not know in the father whether the D allele and the M allele are in cis arrangement, that is, D and M on the same chromatid, or in trans with D on one chromatid and M on the other chromatid, we need two cases, and we will average the probabilities. All the possible arrangements of the chromatids from the mother and the father are shown in Figure 21, cases in which there has or has not been a recombination event. The offspring must inherit one chromatid from each parent, and the inherited chromatids for each offspring are shown below the inherited disease state and marker alleles, which each child happened to inherit. The probability of such an arrangement of offspring is the probabilities of each offspring multiplied together: P(1) × P(2) × P(3), where P(1) is the probability of child 1, P(2) is the probability of child 2, and P(3) is the probability of child 3, for a pedigree of three children. For larger pedigrees the probability is the product of the probabilities of each the siblings: P(1) × P(2) × P(3) × … × P(n) for n children.

Fig. 21. A simplified linkage calculation for an autosomal dominant disease. In this idealized pedigree we assume that the disease is strictly autosomal dominant, fully penetrant, and uniform in expressivity and that there is no question of who is affected and who is not. We use the offspring to score the consequences of recombination in the meioses of the father in this pedigree. The father is the double heterozygote in this case. D represents the disease allele, d the normal allele, M one marker allele, and m the other marker allele. In Panel A, we show the cis arrangement of D and M. In Panel B, we show the trans relationship of D and M.

In our example we learn the disease phenotype in the children and find that the first two are affected, and the last three are not. By PCR or Southern blot analysis7 we find that the father and the first two siblings are heterozygotes (M, m), and the mother and the last three children are homozygous (m, m) at the marker locus. The figure shows each of the possible gametes of the parents and whether the gamete is the result of a recombination event. The individual cases of the cis arrangement (see Fig. 21A) and the trans arrangement (see Fig. 21B) also are shown. The probability of the cis arrangement is (1 - θ)5, and the probability of the trans arrangement is θ5. Thus, the average of the two is [1/2[(1 - θ5 + θ5]], and the odds ratio is [1/2 [(1 - θ)5 + θ5]]/[1/2[(1 - [tb1/2)5 + 1/25]]. A graph of the odds ratio or the lod score versus the recombination fraction shows that families of this small size are not generally helpful in mapping the disease locus.

We have evaluated odds ratios and the lod scores of some larger pedigrees and plotted these curves in Figure 22. We also calculated the lod scores for similar pedigrees with some recombinants. Even one sibling can markedly change our thoughts about the closeness of a marker to the disease locus, and a single mistaken diagnosis or marker typing error can ruin the analysis.

Back to Top
APPENDIX III

NEIBank, A DATABASE OF EYE-SPECIFIC CDNAS AND GENES

Illustrated in Figure 23 is a section of the webpage detailing abundant cDNAs found in un-normalized cDNA libraries from adult human retinas. The web page is from NEIBank, a catalog of information about the genes that are expressed in several different tissues from the eye. This collection is searchable in several different ways. In Figure 23, a list of cDNA clones expressed in the retina is shown. Only the first 19 clones of about 2700 are listed. The clones are listed by abundance of the cDNA in different retina-specific cDNA libraries. The most abundant cDNA is rhodopsin, and 138 clones were found in the database. The chromosomal location of each clone is listed. The GenBank entry and Unigene cluster entries also are given. GC stands for “Gene Cards” and a link is often provided to further information on the given gene. The NEIBank can be searched by gene, keywords, protein names, or general protein classifications. Each of the tissue-specific databases can be searched with a protein or DNA sequence using a “Blast” searching utility.

Fig. 23. NEIBank webpage showing cDNA clones from the retina.

Back to Top