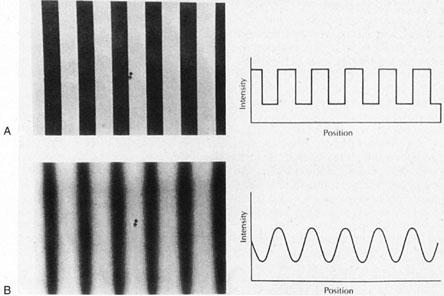
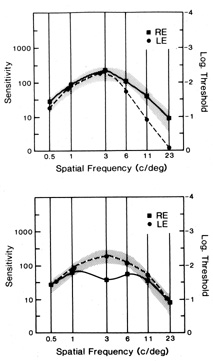
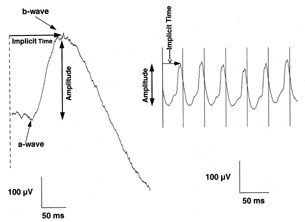
| Traquair's classical definition of the visual field is “that
portion of space in which objects are visible at the same moment during
steady fixation of the gaze in one direction.”62 Perimetry measures the visual field and involves recording visual function
of the eye at topographically defined loci in space. Understanding
the visual field as it relates to neuro-ophthalmologic diagnosis is
a complex subject requiring knowledge of: (a) the anatomy of
the optic pathways and contiguous, related structures; (b) the
intrinsic organization of retinal projection through the pathways
and in the cortex; and (c) the nature of various lesions and
the mechanisms by which they produce field defects. The specific localizing
characteristics of field defects are discussed subsequently in
the chapters dealing with topical diagnosis in the visual sensory system. The visual field is too often considered a description of peripheral visual
space, representing extrafoveal visual function, exclusive of central
vision, which is described by acuity. However, according to Traquair's
definition, the visual field is more appropriately thought
of as a three-dimensional “island of vision surrounded by a sea
of blindness” crowned by a sharp pinnacle of central vision (Fig. 5). Certainly in the context of neurologic dysfunction, the central
portion of the visual field is at least as important as the periphery. 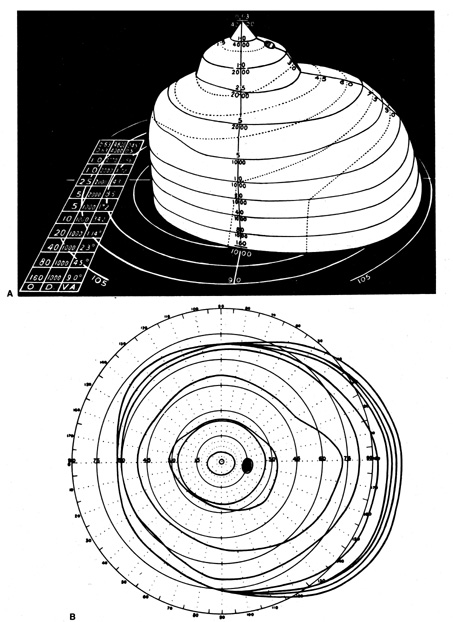 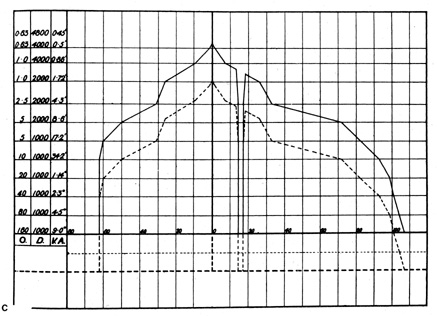 Fig. 5. A. Three dimensional model of Traquair's “Island of Vision.” The
visual field of the right eye is shown. B. Standard flat plot of isopters, as if viewed from above. C. Vertical cross-section along horizontal meridian. O, target size in mm; D, distance
from eye in mm; VA, visual angle. (From Scott GI: Traquair's
Clinical Perimetry. London: Henry Kimpton, 1957) Fig. 5. A. Three dimensional model of Traquair's “Island of Vision.” The
visual field of the right eye is shown. B. Standard flat plot of isopters, as if viewed from above. C. Vertical cross-section along horizontal meridian. O, target size in mm; D, distance
from eye in mm; VA, visual angle. (From Scott GI: Traquair's
Clinical Perimetry. London: Henry Kimpton, 1957)
|
There are many techniques and a variety of equipment available for evaluating
visual fields. However, in essence all methods depend on the patient's
subjective response to a visual stimulus. The threshold of
perception (i.e., the threshold sensitivity) for a specific visual stimuus is determined
either qualitatively or quantitatively by varying the size, brightness, color, position, or some other physical attribute of the stimulus
until that stimulus is just perceived. When recording Goldmann-type
kinetic perimetry, a line is drawn connecting points of equal threshold
sensitivity, thereby defining the isopter for that specific stimulus. This method is roughly analogous to the isobar
lines on weather maps that define areas of equal atmospheric pressure. Complex
manual and computerized perimeters have been developed to
determine threshold sensitivity to a variety of stimuli and represent
these data graphically, either by plotting the position and shape of
isopters or creating grayscale maps of threshold sensitivity. However, before
dealing with these devices some basic principles of visual field
measurement and the relatively simple, yet sensitive, confrontation
techniques that are easily available to any clinician, at any time, and
in all clinical settings are considered. ANATOMIC CONSIDERATIONS In general, field defects resulting from lesions of the retina, optic nerve, chiasm, and
visual pathways conform to a limited set of patterns. The
variations in these patterns are elaborated elsewhere in discussions
of topical diagnosis (see Chapters 5, 6, and 7), but several
anatomic concepts necessary for understanding the basic principles
of perimetry are considered here.
Pathologic processes involving the retina may produce general or geographically
focal field defects or areas of diminished sensitivity (i.e., scotomas); these deficits frequently correspond to lesions visible
on funduscopy. Macular lesions produce central scotomas at fixation, sparing the periphery, whereas widespread tapetoretinal
degenerations result in generalized field constriction, often
sparing central fixation (see Chapter 5).
Lesions of the optic nerve head or immediate peripapillary region, as well
as some vascular diseases, tend to produce retinal nerve fiber bundle
defects, which are segmental defects extending radially outward from
the blind spot. The configuration of these defects depends on the involved
portion of the optic disc. Temporal, wedge-shaped scotomas result
when the lesion is at the nasal aspect of the disc. Damage to axonal
bundles at the superior or inferior poles of the optic disc produces
arcuate defects that curve toward the nasal periphery. These superior
or inferior arcuate scotomas point to, or originate at, the blind spot
and can extend no further than the horizontal nasal meridian, which
represents the anatomic temporal raphe of nerve fiber bundles that stretches
from the fovea to the temporal retinal periphery. These defects
frequently spare central vision, leaving acuity intact. Lesions at the
temporal aspect of the optic disc result in centrocecal scotomas that
encompass the blind spot and the central (macular) region, resulting
in decreased visual acuity. Large lesions on or near the optic
disc may result in areas of visual field loss that combine two or
more of these segmental patterns. Typically, and rather consistently, retrobulbar disorders of the optic
nerves (e.g., optic neuritis, toxic neuropathies) especially depress function
of the central core of the nerve. This central core is occupied predominantly
by small caliber myelinated fibers subserving the cone system
of the fovea and macular area of the retina (the papillomacular nerve
fiber bundle). Defects in this system cause diminished visual
acuity, depression of central field, and alterations in color vision. A
central scotoma occurring in the absence of macular disease is the
classic, but not exclusive, of a lesion involving the optic nerve (see Chapter 5).
At the chiasm, all afferent nerve fibers from both eyes are segregated
into crossed and uncrossed systems (Fig. 6). It is at the chiasm that the visual system becomes fnctionally
divided by a vertical demarcation through the fixation point, the retinal–cortical
projections representing the left hemifields of both
eyes blending and coursing toward the right cerebral hemisphere and
the projections representing the right homonymous halves of the field
joining and coursing to the left. In the optic nerve (i.e., anterior to the chiasm), there is no functional vertical demarcation
of right and left hemifields. At the chiasm and in the pathways posterior
to it there is an inviolate lateralizing separation of homonymous hemifields. Thus, it is that the
vertical meridian dividing the hemifields assumes critical importance
in the elucidation and exploration of field defects resulting from lesions
of the chiasm, optic radiations, and occipital cortex. 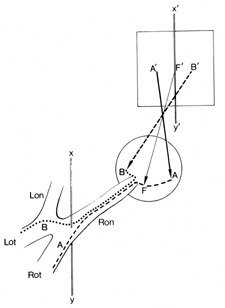 Fig. 6. Visual field of the right eye divided into a temporal (B') and
nasal (A') hemifield, by a vertical line (X', Y') through the point of fixation (F'). There
is no anatomic or functional segregation of crossed (nasal
retinal) fibers, B (···········), and uncrossed (temporal retinal) fibers, A (−−−−−−−), before
the junction of the optic nerve with the chiasm at
the vertical line (X,Y). Therefore, lesions anterior to the
chiasm produce defects that extend across the vertical, whereas chiasmal
and retrochiasmal lesions produce defects confined to one hemifield. Lon, left
optic nerve; Lot, left optic tract; Ron, right optic nerve; Rot, right
optic tract. Fig. 6. Visual field of the right eye divided into a temporal (B') and
nasal (A') hemifield, by a vertical line (X', Y') through the point of fixation (F'). There
is no anatomic or functional segregation of crossed (nasal
retinal) fibers, B (···········), and uncrossed (temporal retinal) fibers, A (−−−−−−−), before
the junction of the optic nerve with the chiasm at
the vertical line (X,Y). Therefore, lesions anterior to the
chiasm produce defects that extend across the vertical, whereas chiasmal
and retrochiasmal lesions produce defects confined to one hemifield. Lon, left
optic nerve; Lot, left optic tract; Ron, right optic nerve; Rot, right
optic tract.
|
The optic tract forms a compact fascicle of fibers that passes to the LGN
of the thalamus. Lesions of this tract or of the LGN are relatively
infrequent, and when they occur, they typically produce fairly incongruent (unequally
sized) homonymous hemianopic field defects, unless, of
course, the hemianopia is complete and total. Lesions of the
retrogeniculate pathways also can produce partial or complete homonymous
hemianopias. Partial hemianopias tend to be more congruent when
the lesions responsible are situated more posteriorly toward the occipital
lobe. Lesions involving the temporal lobe are associated with somewhat
incongruent defects in the superior portion of the contralateral
hemifields, whereas disturbances of the pathway in the parietal lobe
characteristically cause slightly incongruent homonymous defects in the
inferior part of the hemifield. Lesions of the visual cortex in the
occipital lobe have three localizing characteristics: (a) they
are exquisitely congruent; (b) they can give rise to true
homonymous quadrantanopias that respect both horizontal and vertical
meridians because anatomically the genicular–cortical projections
representing the upper and lower visual field quadrants become segregated
to the lower and upper gyri of the calcarine cortex, respectively; and (c) macular sparing is frequently a characteristic feature
when occipital homonymous hemianopia is otherwise complete, and
this is a consequence of the differential blood supply to the anterior
and posterior portions of the visual cortex. PHYSIOLOGIC CONSIDERATIONS The utility of Traquair's concept of an island or a hill of vision (see
Fig. 5) has proved consistent throughout the 50-year period
during which Goldmann-type kinetic perimetry dominated clinical
testing. Remarkably, Traquair's analogy remains current as an excellent
way of conceptualizing automated static perimetry that has now
largely superseded formal kinetic perimetry in clinical and investigational
protocols.
p>Traquair's three-dimensional representation (see Fig. 5A) sits
on a base plane, represented as a circular grid identical to that
for plotting Goldmann isopters. This plane represents the horizontal
and vertical dimensions of visual space. The third dimension, rising
upward from the base plane is differential light sensitivity (DLS), which is the degree to which the visual system, at each
point, is capable of detecting a circular spot of light that is brighter
than the background. The foveal pinnacle is the most sensitive point
in the field where the dimmest target (least different from
background) can be detected. Traquair's various slopes and rises
are zones within the visual field where DLS varies from point to
point. In a gently sloping region (e.g., the temporal side of fixation), sensitivity changes gradually along
the horizontal meridian, whereas in a steeply sloped region (e.g., the nasal periphery), there is a precipitous drop of sensitivity
across a short lateral distance.
Traquair likened the process of perimetry to a geographic survey of an
elevated surface wherein the lines encircling the island at various levels
indicate a certain elevation above sea level. In perimetry, the lines
encompass zones within the field that have achieved a certain elevation
of DLS above the base plane, that is, above sea level. These isopters
lines refer to points or zones of equal visual sensitivity. In
kinetic perimetry of the Goldmann type, isopters are determined by moving
projected light points across the inner surface of a bowl-shaped hemisphere; the
light stimulus is moved from a nonseeing to a seeing region, at
various locations around the island, and the patient signals
when the moving light is first detected. This corresponds to mapping the
isopter by choosing a DLS level and moving horizontally at this fixed
DLS altitude above the base plane toward the island, noting where contact
would occur with the rising slope of land. Figure 5B shows the aerial view Traquair's hypothetical observer would
have just above the foveal pinnacle, with the isopters now projected
on the base plane. The series of concentric circles indicate discrete
levels of DLS, each elevation (sensitivity) determined by
a specific stimulus size and brightness. Although several stimulus levels
are required to adequately map the surface of Traquair's island, generally
no more than three isopters are plotted. A vertical slice (see Fig. 5C) through the island along the horizontal midline
shows a steep nasal side (left) and the more gently sloping temporal field (right). On the temporal side of fixation is the physiologic blind spot, a
dark shaft (bottomless pit) extending to the base plane.
One category of visual field loss, generalized depression, implies that
all points on the DLS surface are displaced downward by an equal proportion; that
is, sensitivity is depressed equally at all points. This
is represented as a concentric contraction of all isopters, as Traquair's
island sinks in the sea (see Fig. 5C, dotted profile). With depression of the entire field, a stimulus target would have
to move further inward to be detected.
Traquair used the geologic term erosion to describe the consequences on the visual field of disease of the afferent
pathways. For example, a dense inferior altitudinal field defect
resulting from anterior ischemic optic neuropathy is illustrated in Figure 7 showing Traquair's island with a steeply excavated cliff face along
the nasal horizontal midline, where the field undergoes transition
to nearly zero DLS as a result of the nerve infarction. Small localized
depressions (pits) on the surface could be missed if flanked
by two isopters that are too widely spaced. For this reason, it is
common practice in Goldmann perimetry to prsent blinking but static light
targets positioned well within the peripheral isopters in order to
search for small focal depressions or scotomas. Because the light target
used to determine a particular isopter should be brighter than threshold
for field zones within the isopter, any missed points can be considered as within a field defect. This
technique of presenting target lights statically within their
isopter is referred to as suprathreshold static perimetry. The concept of slope may be applied to the DLS contour of field defects
in the same way as it is applied to the slope of normal field regions. 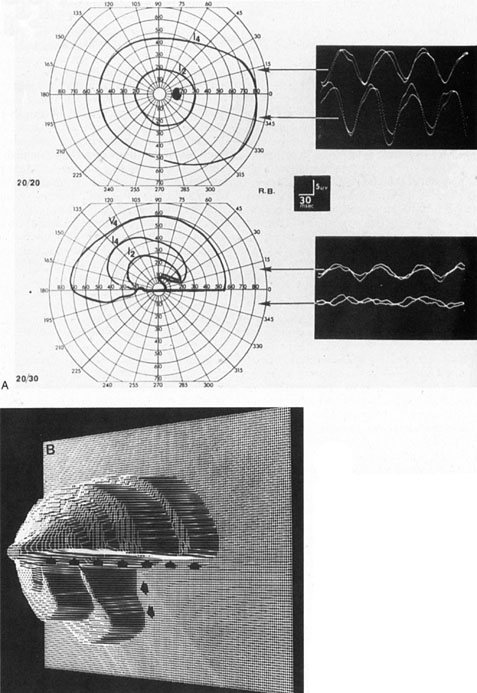 Fig. 7. Dense inferior altitudinal field defect resulting from anterior ischemic
optic neuropathy of left eye. A. Goldmann visual fields and VEP tracings for right eye (top), which is normal, and left eye (middle), which shows almost complete loss of the lower hemifield. Steady-state
VEPs are in response to 8 Hz pattern reversal stimulation of upper
or lower half of the visual field and are normal and symmetrical in
both half-fields of the right eye and are diminished, especially in
the inferior field, of the left eye. B. Three-dimensional computer reconstruction field defect in the left eye; arrows define the sharp edge of the absolute defect. (Courtesy H. Stanley
Thompson, MD.) Fig. 7. Dense inferior altitudinal field defect resulting from anterior ischemic
optic neuropathy of left eye. A. Goldmann visual fields and VEP tracings for right eye (top), which is normal, and left eye (middle), which shows almost complete loss of the lower hemifield. Steady-state
VEPs are in response to 8 Hz pattern reversal stimulation of upper
or lower half of the visual field and are normal and symmetrical in
both half-fields of the right eye and are diminished, especially in
the inferior field, of the left eye. B. Three-dimensional computer reconstruction field defect in the left eye; arrows define the sharp edge of the absolute defect. (Courtesy H. Stanley
Thompson, MD.)
|
Imagine a temporal lobe infarction in which a central zone is necrotic
and even the brightest stimulus is not perceived in the corresponding
field; surrounding the necrotic zone are edematous, partially compressed
visual fibers that are not functioning at peak efficiency but permit
some visual function. This translates into a region of reduced DLS (a
relative scotoma) surrounding the absolute visual field defect (an
absolute scotoma). The area of nonseeing field in the
upper right quadrant (Fig. 8A) is considerably enlarged with reduced stimulus intensity. This is
a gently sloped area of field defect that is consistent with an acute
lesion surrounded by a zone of relative dysfunction. When the pathologic
changes have stabilized and the secondary edema has cleared, the
absolute scotoma persists, corresponding to the necrotic zone (see
Fig. 8B). The visual field defect mapped with the two weaker stimuli
is now the same size as the absolute defect (i.e., the relative scotoma has cleared). This produces a steeply sloped
defect along the horizontal meridian, which is characteristic of a stable
established lesion.
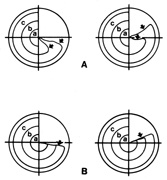 Fig. 8. Right homonymous upper quadrant visual field defect resulting from a left
temporal lobe infarction. A. In the acute stage, the field defect is moderately incongruous (greater
in left eye) and shows a relative slope along the horizontal
edge (arrows). B. In the chronic stage, the defect is steep along the horizontal edge (single arrow). Fig. 8. Right homonymous upper quadrant visual field defect resulting from a left
temporal lobe infarction. A. In the acute stage, the field defect is moderately incongruous (greater
in left eye) and shows a relative slope along the horizontal
edge (arrows). B. In the chronic stage, the defect is steep along the horizontal edge (single arrow).
|
CLINICAL TESTING OF THE VISUAL FIELD Confrontation Methods Innumerable and ingenious methods can be employed to screen patients for
field defects. Screening generally involves rapid testing, which is
usually done without special equipment, but at some sacrifice of sensitiity. Using
confrontation screening, examiners compare patients' fields
with their own while in a face-to-face position and without using
the tangent screen or perimeter. Confrontation screening of fields provides a rapid, practical, and readily
available technique that can be used at the bedside or in the office, with
either children or adults (Table 1). When used knowledgeably, it is both sensitive and accurate. However, it
is critical to realize that confrontational methods are most
useful in uncovering field defects such as central scotomas, altitudinal
defects, and bitemporal and homonymous hemianopias, but generally they
are not sensitive enough to reveal subtle defects resulting from glaucoma
or minor peripheral retinal lesions. Fortunately, most neurologic
field defects do not fall into that category and frequently can be
detected using confrontational methods. It is also obvious that these
techniques may uncover retinal detachments, choroidal tumors, and dense
glaucomatous defects. However, this discussion is confined to lesions
involving the optic nerves, chiasm, and posterior pathways.
TABLE 1. Confrontation field techniques
| Visually elicited eye movements | Infants
Obtunded, dysphasic adults |
| Finger mimicking | Toddlers (3–5 yr)
Dysphasic adults |
| Finger counting | Young children (5–8 yr); Adults* |
| Hand comparison | Children (8–12 yr); Adults* |
| Color comparison | Children (8–12 yr); Adults |
| Threat | Infants; Obtunded adults |
*Although highly subjective, comparison testing is very sensitive.
Determining the best corrected visual acuity usually is a prerequisite
for proceeding with the visual field examination. However, in infants, toddlers, and
bedridden, semiobtunded, and confused patients, the inability
to determine acuity neither invalidates nor excuses the performance
of confrontation fields. Table 1 indicates the approximate age at
which reasonable cooperation for various types of confrontation testing
may be expected. VISUALLY ELICITED EYE MOVEMENTS The foveation reflex, in which reflex eye movements are made to bring a
stimulus presented in the peripheral field onto the central area (fovea) of
the retina, develops at a very young age. The eye movement
that accomplishes refixation is objective evidence that the stimulus
was perceived in the periphery. Therefore, such involuntary visually
provoked fixational movements provide a mechanism to test gross function
of the peripheral retina (field) (Fig. 9). Clearly, this technique can be used to test infants, but it is
also valuable with semiobtunded patients who may have homonymous or bitemporal
hemianopic field defects. 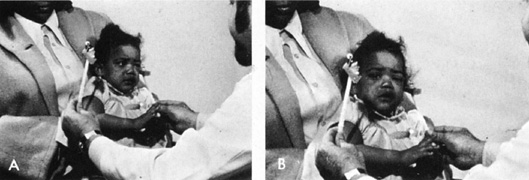 Fig. 9. Visually elicited eye movements provide gross estimate of field function
and are demonstrated here in an 11-month-old infant. A. Infant watches the face of a cooing examiner while a brightly colored
object is moved into her peripheral field. B. The head and eyes perform a fixation reflex, which is objective evidence
of field function. Fig. 9. Visually elicited eye movements provide gross estimate of field function
and are demonstrated here in an 11-month-old infant. A. Infant watches the face of a cooing examiner while a brightly colored
object is moved into her peripheral field. B. The head and eyes perform a fixation reflex, which is objective evidence
of field function.
|
FINGER MIMICKING Even before the “E game” can be learned, a young child can
be shown how to mimic fingerpatterns by playing “Do this!” (Fig. 10) first with both eyes opened, then with each alternately occluded. This
technique does not require the ability to either count or conceptualize
spatial orientation and provides good approximations of field
function. Because a young child has great difficulty in controlling ocular
fixation, finger targets should be flashed (i.e., briefly exposed before the child looks toward the hand). In the
temporal field, fixation can be further controlled by turning the child's
face toward the opposite side, carrying the eye into abduction
and rendering further movement toward the temporal field anatomically
impossible. For the nasal field, this maneuver is more difficult because
the nose and the object occluding the other eye may obscure the examiner's
fingers. Finger patterns should be limited to the presentation
of one, two, or five fingers, or the fist, because other combinations
are difficult to distinguish. 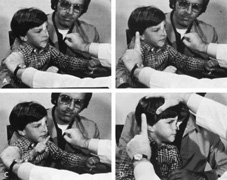 Fig. 10. Finger-mimicking fields in a 3-year-old boy. A press-on occluder may be
used for monocular testing. A. Child and examiner face each other with both hands poised. B. With child fixating examiner's face, a number of fingers (1, 2, or 5) is “flashed.” C. The child responds. D. When fixation is a problem, the face may be turned such that the abducted
eye can move no farther to the side. Fig. 10. Finger-mimicking fields in a 3-year-old boy. A press-on occluder may be
used for monocular testing. A. Child and examiner face each other with both hands poised. B. With child fixating examiner's face, a number of fingers (1, 2, or 5) is “flashed.” C. The child responds. D. When fixation is a problem, the face may be turned such that the abducted
eye can move no farther to the side.
|
FINGER COUNTING Most children and adults are able to identify accurately the number of
fingers presented in each quadrant of the monocular field. Visual acuity 10° from
fixation is roughly 20/200; at 30°, it falls to 20/400. Therefore, because the fingers represent an approximation
of the 20/200 “E” optotype, finger counting at an eccentric
point between 10° and 20° from fixation should be accomplished
easily at confrontation distances (approximately 0.5 m). If a patient seems to have some difficulty counting fingers in a quadrant
or hemifield, simultaneous testing (Fig. 11) may help confirm a field defect. Simultaneous presentation of visual
stimuli also may elicit a response similar to other sensory extinction
phenomena. When the defective hemifield is tested alone, it may
appear quite intact, but simultaneous presentation of stimuli to both
hemifields may suppress the perception on one side, revealing the deficit. 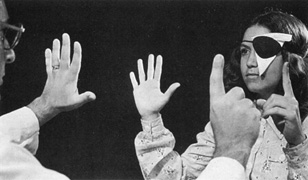 Fig. 11. Finger counting fields in adults. Four quadrants of each eye should be
tested. The patient may name or hold up the same number of fingers. Simultaneous
finger counting may bring out a subtle hemianopic defect. Fig. 11. Finger counting fields in adults. Four quadrants of each eye should be
tested. The patient may name or hold up the same number of fingers. Simultaneous
finger counting may bring out a subtle hemianopic defect.
|
HAND COMPARISON The simultaneous presentation of targets to either side of the vertical
meridian provides a sensitive subjective comparison of visual function
in the two hemifields. In a similar way, the hands can be placed in
the superior and inferior nasal quadrant to determine whether there is
an altitudinal defect or nasal step, which usually respects the horizontal
nasal meridian (see later). In performing hand comparisons, the examiner's hands or matched targets
should provide large, lightcolored paired stimuli about which the
patient can be asked to make critical judgments in brightness perception (Fig. 12). The physician must determine that both hands or targets are illuminated
equally, preferably by a light source directed toward the hands
from behind the patient's head. Overhead lighting may be uniform, but
positioning of the hands is critical because a slight tilting
alters the reflected luminance. The following are typical questions asked
during the comparison: “Do my hands appear the same?” “Is
one hand lighter or darker than the other?” “Is
one hand blurred or less distinct?” and “Does one hand appear
in a shadow?” 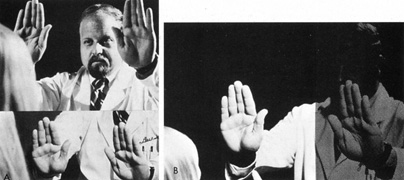 Fig. 12. The use of simultaneous hand comparison for detecting subtle hemianopic
depressions. A. Hands are first compared above the horizontal (superior quadrants), then
below. B. The hand in depressed hemifield appears “darker,” “in
shadow,” or “blurred.” Fig. 12. The use of simultaneous hand comparison for detecting subtle hemianopic
depressions. A. Hands are first compared above the horizontal (superior quadrants), then
below. B. The hand in depressed hemifield appears “darker,” “in
shadow,” or “blurred.”
|
It is obvious that for such confrontational screening methods to succeed, the
physician must gain experience testing individuals with normal
vision as well as patients with known field defects. As with practically
all other forms of field testing, hand comparison is totally dependent
on the patient's subjective response and the ability of the physician
to interpret that response. However, a consistent and reproducible
abnormal response by the patient must be construed as an indication
of a field defect and is a definite indication for formal perimetry. COLOR COMPARISON Functionally, the optic nerves and chiasm may be considered macular structures (i.e., they predominantly subserve the central field) because more than 90% of
the nerve fibers that comprise the anterior visual pathways
arise from the small ganglion cells associated with cone receptors
that populate the macula (Fig. 13). These fibers occupy the central core of the optic nerves and the
median bar (decussating fibers) of the chiasm, which are especially
vulnerable to compression by tumors or to intrinsic demyelinating
or toxic processes. Therefore, depression of central field function, including
loss of sensitivity to color, is a feature of both optic
nerve and chiasmal disease. In fact, color desaturation may occur disproportionally
with relative preservation of acuity and form perception. 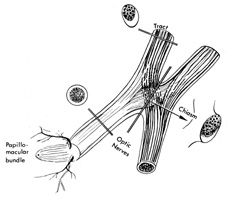 Fig. 13. Most nerve fibers in the optic nerves and chiasm subserve macular function
and, therefore, the central visual field. Anatomically and functionally, the
nerves and chiasm may be considered macular projection structures. Note
that the section through median bar of chiasm demonstrates
the distribution of macular crossing fibers (after Hoyt). Fig. 13. Most nerve fibers in the optic nerves and chiasm subserve macular function
and, therefore, the central visual field. Anatomically and functionally, the
nerves and chiasm may be considered macular projection structures. Note
that the section through median bar of chiasm demonstrates
the distribution of macular crossing fibers (after Hoyt).
|
In optic nerve disease, central depression (scotoma) of the field
can be easily detected by asking the patient to describe changes
in the saturation of the color of a large test object moved away from
or toward central fixation (Fig. 14). Alternatively, two similar targets may be used, one placed centrally
and the other eccentrically, and the patient asked to describe dfferences
in color intensity or saturation. Normally, color is brighter
or more saturated the closer one comes to fixation. 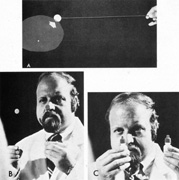 Fig. 14. Use of colored objects to detect and plot central scotomas. A. The limits of the defect are most easily defined when the target subjectively
increases in color intensity as it is moved out of scotoma. B. Two identical, colored targets are used for simultaneous comparison, one
centrally (on nose), the other at approximately 10�. Normally, the
target fixated centrally appears brighter. C. Use of brightly colored bottle tops (mydriatic red) for color
comparison. Fig. 14. Use of colored objects to detect and plot central scotomas. A. The limits of the defect are most easily defined when the target subjectively
increases in color intensity as it is moved out of scotoma. B. Two identical, colored targets are used for simultaneous comparison, one
centrally (on nose), the other at approximately 10�. Normally, the
target fixated centrally appears brighter. C. Use of brightly colored bottle tops (mydriatic red) for color
comparison.
|
In suspected chiasmal syndromes, color perception should be compared on
either side of the central fixation point. Moving a single large stimulus
from one side to the other, or simultaneously presenting two targets, one
on either side of fixation, provides the patient with a large
visual stimulus about which he or she may make subjective yet sensitive
judgments concerning color saturation (Fig. 15). To substantiate an apparent temporal field defect further, the
test target should demonstrably “brighten” or take on color
as it passes across the vertical meridian into the nasal hemifield (Fig. 16). Similar color comparison can be used to detect altitudinal visual
field defects, which typically are delimited by the horizontal nasal
meridian. In those cases, the comparison is made between the upper and
lower nasal quadrants. This is extremely useful because visual field
defects that terminate at the horizontal nasal meridian must be caused by lesions at the optic nerve head or adjacent to it, that is, their
origin is anterior. The most common causes are glaucoma, anterior ischemic optic neuropathy, branch artery occlusion, and optic
neuritis. Chiasmal compressive lesions cannot produce this pattern, and
so imaging studies can be avoided or at least, when indicated, limited
to the orbital contents. 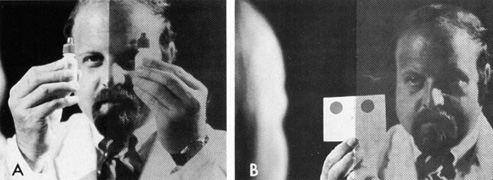 Fig. 15. Color comparison with objects presented to both sides of central fixation. A. Mydriatic red bottle tops. B. Card with two large red patches. Fig. 15. Color comparison with objects presented to both sides of central fixation. A. Mydriatic red bottle tops. B. Card with two large red patches.
|
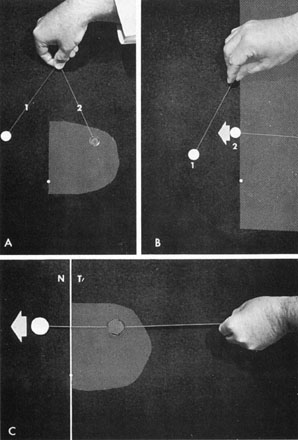 Fig. 16. Central exploration of the vertical meridian. A. Simultaneous color comparison for subtle central depression of the temporal
hemifield, especially helpful in early chiasmal syndromes. Target 2 appears
desaturated. B. The border of the field defect along the vertical meridian is corroborated
by the patient's objective perception of increased color intensity
as target 2 crosses the midline and moves into the intact hemifield. C. A single large colored target brightens as it is moved across vertical
from temporal field (T) into nasal field (N). Fig. 16. Central exploration of the vertical meridian. A. Simultaneous color comparison for subtle central depression of the temporal
hemifield, especially helpful in early chiasmal syndromes. Target 2 appears
desaturated. B. The border of the field defect along the vertical meridian is corroborated
by the patient's objective perception of increased color intensity
as target 2 crosses the midline and moves into the intact hemifield. C. A single large colored target brightens as it is moved across vertical
from temporal field (T) into nasal field (N).
|
AMSLER GRID The Amsler grid is designed to test a 20° region of the visual field
centered at fixation. It is particularly helpful when there are subtle
disturbances of central vision, especially metamorphopsia, but it also
can be used to define the configuration, density, and extent of central
and paracentral scotomas. The grid is held at 33 cm and the patient
monocularly fixates a central dot that is surrounded by a grid of 400 small 1° squares. If the patient has trouble seeing or fixating
the central dot, a large X, crossing at the dot, is an option that helps
direct the patient's gaze to the center of the grid. While maintaining
fixation at the center, the patient is asked to note any alterations
in the grid pattern, such as scotomas, fading, distortion, curving, or
bowing of the lines. The major advantages of Amsler grid testing are that it is rapid, portable, and
easy to use. Its limitations relate to its relatively low sensitivity
and the subjective and qualitative nature of the results, which
may limit their reliability. One strategy for increasing the sensitivity of the test is the use of cross-polarizing
lenses to reduce the overall luminance of the grid.63 Although the grid was designed for use without stimulus targets to detect
macular pathology, its usefulness in evaluating anterior visual pathway
disease is enhanced when small red targets (1–20 mm) are
used to map out central and paracentral scotomas and, particularly, in
determining whether the latter terminate at the vertical or
horizontal meridian
Tangent Screen Although largely superseded by automated static threshold and Goldmann-type
perimetry, the tangent screen still offers a valuable, sensitive, and
readily available method for formally evaluating visual fields or
screening visual field defects. One of the major advantages of the tangent
screen is the relative magnification of the surface area at 1 or 2 m
when compared to perimeters that are viewed from 33 cm or less. This
allows detailed exploration of small central scotomas and certain
suspected nerve fiber layer defects. The relationship of central anatomic
areas of the retina and their geometric enlarged projection in space (field) are
shown in Figure 17. The tangent screen examination, generally carried out by a physician
and not a technician, also provides an opportunity for a goal-directed
examination of the visual fields, depending on the site or nature of
the suspected lesion. Compared with automated perimetry, it is rapid and
convenient, even if less quantitative or standardized. 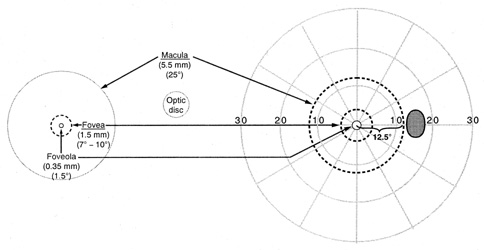 Fig. 17. Diagrammatic representation of the anatomic dimensions in millimeters (mm) and
degrees (°) of macular areas and of the
optic disc of a right eye, left, and the corresponding circular zones
in degrees (°) projected onto the right visual field. (From
Gray LG, Galetta SL, Siegal T, et al: The central visual field
in homonymous hemianopsia. Arch Neurol 54:312, 1997) Fig. 17. Diagrammatic representation of the anatomic dimensions in millimeters (mm) and
degrees (°) of macular areas and of the
optic disc of a right eye, left, and the corresponding circular zones
in degrees (°) projected onto the right visual field. (From
Gray LG, Galetta SL, Siegal T, et al: The central visual field
in homonymous hemianopsia. Arch Neurol 54:312, 1997)
|
For tangent screen examination, the patient is seated comfortably 1 or 2 m
from the center of the screen, which should be evenly illuminated, and
each eye is alternately tested. The patient is instructed to gaze
steadily at a central fixation point. With central scotomas, a large
X may be taped across the fixation point and the patient instructed to
look at the center of the X mark even if the line intersection is inapparent. The
patient's fixation should be observed while the field
stimulus is presented, and the examiner must be particularly vigilant
for eccentric refixation eye movements, especially at the start of testing. A
suprathreshold stimulus is first used, such as a 3- r 5-mm
white target at 1 m. As with all field testing, the stimulus is moved
from nonseeing areas to seeing areas. A flat disc stimulus is preferred, white
or red on one side, black on the obverse, that can be flipped
over and thus “hidden.” Patients are instructed to indicate
verbally or by gesture when they first see the target, and not the
wand, hand, or vague movement. Occasional sham presentations of the wand
with the black obverse side of the disc stimulus ensure that the patient
is responding correctly. If the chosen target is above threshold
everywhere on the screen except for the blind spot, a smaller stimulus
is selected. On the other hand, the depth and size of scotomas or other
field defects can be explored with larger stimuli. Shallow central
field defects can be defined more easily with a red target, particularly
when a small white target is seen in the area of the presumed scotoma. The
blind spot should be initially explored and mapped to demonstrate
the concept of target detection and disappearance; this is best accomplished
with a relatively large (e.g., 5 mm) suprathreshold stimulus. If the blind spot is enlarged, further
testing with larger stimuli is required. The points at which a particular
target is detected can be marked with pins, and theses points
then can be transcribed to a standard visual field chart. With tangent
screen field plots, the stimulus is specified by notations such as 5/1000/W, which
defines a white (W) stimulus, 5 mm in
diameter, presented at a viewing distance of 1 m (1,000 mm) (see
Fig. 5C).
The importance of the central field (especially the fixational area) in
the diagnosis of optic nerve disease, and the significance
of the vertical meridian in the diagnosis of chiasmal and homonymous hemianopic
defects have been emphasized. Therefore, the examiner's
attention and time should be directed to exploring these areas (Fig. 18). 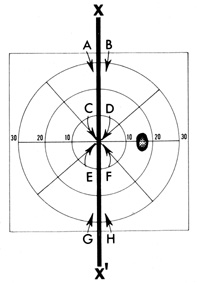 Fig. 18. Importance of vertical meridian (X, X') in neurologic diagnosis. Testing of visual function, whether form (standard
targets) or color, should consist of comparisons
along the meridian (X, X'), at A-B and G-H for detection of “hemianopic step” in the periphery, and at C-D and E-F centrally. Fig. 18. Importance of vertical meridian (X, X') in neurologic diagnosis. Testing of visual function, whether form (standard
targets) or color, should consist of comparisons
along the meridian (X, X'), at A-B and G-H for detection of “hemianopic step” in the periphery, and at C-D and E-F centrally.
|
Although the peripheral field may be defective, there is almost always
depression of the central field in optic nerve disease. Therefore, special
emphasis should be given to exploring for scotomas in the central
region of fixation and between this region and the blind spot. As indicated, this
area is best explored with relatively large colored targets
while the patient is asked to indicate when the color appears or brightens (see
Fig. 14A).
Ischemic optic neuropathy and occasionally optic neuritis tend to produce
altitudinal and arcuate visual field defects and nasal steps, which
usually are limited by the horizontal nasal meridian (see Fig. 7). Responses
to targets presented in the superior and inferior hemifields
and specifically the upper and lower nasal quadrants can be compared
across the horizontal meridian. Field defects with sharp borders
and steep gradients across the horizontal nasal meridian, if not also
present as a homonymous defect in the other eye (i.e., involving the homonymous temporal quadrant), always implicate the
optic nerve head or peripapillary retina as the site of the lesion producing
the field defect.
Chiasmal syndromes tend to produce bitemporl depression. Characteristically, the
field defect is hemianopic, extending toward the periphery, but
occasionally the scotoma can be limited to the temporal paracentral
region (see Fig. 16). For these field defects, testing to
either side of the vertical meridian is critical because visual function
in the temporal and nasal hemifields must be compared. The same holds
true in homonymous hemianopic defects resulting from retro-chiasmal
lesions. Hemianopic field defects have sharp borders at the vertical
meridian, which neither optic nerve nor chorioretinal lesions manifest. A
vertical step or discontinuity in the isopter should be sought along
the vertical at the upper and lower extremes of the tangent screen. Within
the central few degrees of field, it is often useful to employ
colored targets, for here the patient can comment on relative color
intensity and note when the target enters or emerges from a zone of color
desaturation.
Homonymous hemianopia results most frequently from infarction of the calcarine
cortex, with occlusion of the posterior cerebral artery or its
branches (see Chapter 7). The occipital pole receives collateral
blood supply from the middle cerebral artery and may be spared when
an infarction occurs in the more anterior portions of the visual cortex
supplied by the posterior cerebral artery. This mechanism produces
a field feature referred to as “macular or fixation sparing,” for
the area around the fixation point that represents the large
cortical projection of the macula. Testing for spared remnants near
fixation is practically accomplished at the tangent screen or by confrontation.
During field testing, patients may shift their gaze a few degrees to either
side of fixation and the hemianopic midline shifts with gaze angle. Therefore, the
patient with a complete hemianopia seemingly detects
test objects into the presumed hemianopic field, a form of pseudosparing. With
face-to-face confrontation testing, the examiner can maintain
direct eye contact while bringing a target from the periphery across
the hemianopic field toward fixation and thus can detect even slight
refixation movements. In the absence of refixation movements, the patient
without macular sparing does not see a target until it crosses the
vertical midline passing through the visual axis shared by patient and
examiner. When macular sparing is present, the target is seen by the
patient in the “blind” hemifield well before it reaches the
visual axis. Factitious (Functional) Fields The visual field defects of hysteria and malingering typically are associated
with an alleged symptom of marked peripheral constriction or “tunnel
vision.” Unlike the organic causes of generalized field
constriction (see Chapter 5), a tubular field maintains
the same diameter, that is, it does not expand geometrically with increasing
test distances. Thus, in these situations, assessment of peripheral
field constriction involves testing at two or more viewing distances (Fig. 19); this maneuver is easily accomplished at the tangent screen or by
confrontation field testing. The average person is not aware that the
eye, like a camera, encompasses a certain linear diameter at a 1-m viewing
distance, and that this field size measures roughly twice the linear
diameter at 2 m. In an attempt at consistency, patients with nonphysiologic
field constriction dissemble and respond as if the field diameter
at a viewing distance of 2 m remains the same or even becomes
smaller than the field diameter at a 1-m viewing distance, rather than
showing physiologic conical expansion. Of course, physiologically constricted
fields, similar to a camera, show enlarged diameters at increasing
distances.
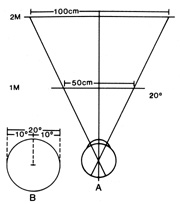 Fig. 19. A. Diagram of tangent screens placed at 1- and 2-m viewing distances. B. A 20° diameter of central field is used as an example. Measured at
the screens, the circle has a diameter of 50 cm at 1 m and a diameter
of 100 cm when viewed from a distance of 2 m. The physiologic field of
vision is actually a cone with the base outward. Visual field constrictions
of functional origin show a tubular pattern with the patients
failing to understand the effect of testing at variable distances, so
that the field diameter is usually the same (or worse) at the
more remote viewing distance. Fig. 19. A. Diagram of tangent screens placed at 1- and 2-m viewing distances. B. A 20° diameter of central field is used as an example. Measured at
the screens, the circle has a diameter of 50 cm at 1 m and a diameter
of 100 cm when viewed from a distance of 2 m. The physiologic field of
vision is actually a cone with the base outward. Visual field constrictions
of functional origin show a tubular pattern with the patients
failing to understand the effect of testing at variable distances, so
that the field diameter is usually the same (or worse) at the
more remote viewing distance.
|
Clinical Perimetry Routine field testing at the classic 1-m distance from a black tangent
screen has been more or less replaced by the modern bowl perimeter, with
a reduced viewing distance of about 0.33 m, but with the great advantage
of standardized and reproducible target and background luminance (i.e., contrast). The goal of conventional clinical perimetry remains to
measure subjective detection sensitivity to the onset of a white light
stimulus in different locations of the field, at low photopic background
luminance levels, in order to identify normal areas and regions
showing sensitivity loss (scotomas). Two general perimetric
techniques are widespread: Goldmann-type kinetic perimetry (manual
and computer-assisted) and computer-automated static perimetry. GOLDMANN KINETIC PERIMETRY In kinetic perimetry of the Goldmann type, a stimulus of fixed size, luminance, and
contrast is projected onto the surface of a bowl-like hemisphere
of defined background luminance. The stimulus is moved from nonseeing
to seeing areas and the patient signals when the moving light
is first detected. This procedure is repeated along several radial meridians. The
contour line connecting all the loci detected defines the
isopter and field abnormalities for that particular stimulus-background
combination. A number of isopters may be determined, and the visual
field defect may be quantified by altering the stimulus intensity or size. A Goldmann visual field examination typically involves determining three
isopters (Fig. 20B), and this is usually sufficient to characterize the surface of Traquair's
island adequately (see Fig. 5). More isopters may be
required to define certain defects, tailored to explore the region of
the defect and avoid unnecessary patient fatigue. If a scotoma is discovered
during suprathreshold static screening in the central field, the
stimulus is moved radially outward from the center of the defect in
a series of presentations to determine the borders of the defect. Progressively
larger or brighter stimuli are then presented within the scotoma
to define the density of the defect. (Conceptually, this is
plotting the shape and depth of local erosions in Traquair's island.)
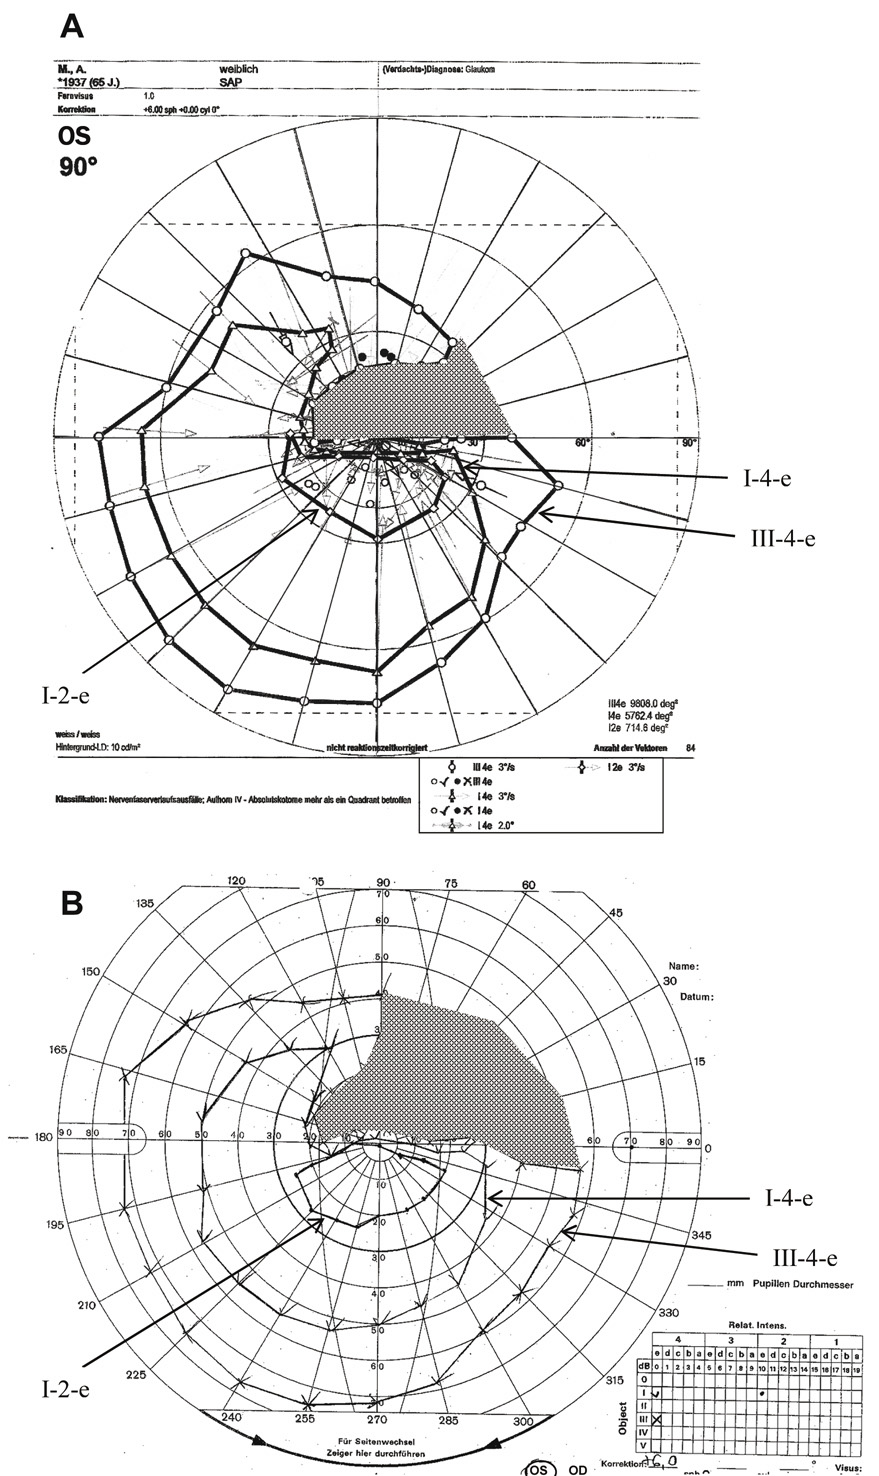 Fig. 20. Visual field of the left eye of a 65-year-old patient with a superior arcuate
scotoma from AION. Comparison of manual and computer-assisted kinetic
perimetry. A. Visual field printout from the PKP (programmed kinetic perimetry) module
on Octopus 101 instrument to three different stimuli (I-2, I-4, V-4). B. Manual kinetic perimetry on a Goldmann-type bowl perimeter performed on
the same patient using te equivalent stimuli. In both A and B arrows labeling the isopters and shading highlighting the scotoma have
been added to the original printouts. Note the somewhat smaller scotoma
to the V-4 stimulus obtained with automated perimeter (see text). Fig. 20. Visual field of the left eye of a 65-year-old patient with a superior arcuate
scotoma from AION. Comparison of manual and computer-assisted kinetic
perimetry. A. Visual field printout from the PKP (programmed kinetic perimetry) module
on Octopus 101 instrument to three different stimuli (I-2, I-4, V-4). B. Manual kinetic perimetry on a Goldmann-type bowl perimeter performed on
the same patient using te equivalent stimuli. In both A and B arrows labeling the isopters and shading highlighting the scotoma have
been added to the original printouts. Note the somewhat smaller scotoma
to the V-4 stimulus obtained with automated perimeter (see text).
|
Goldmann-type perimetry evaluates the full extent of the visual field and
so it is useful in exploring defects outside the central 30° zone. However, because
the central region is reduced in size relative to
the tangent screen, small central defects are more difficult to detect
and map. Kinetic perimetry allows fairly rapid field examination, but
sometimes lacks reliability because of its dependence on the patient's
reaction time, speed of target movement, and variability introduced
by different perimetrists. In kinetic perimetry, the very motion
of the stimulus also contributes to its detection (Riddoch phenomenon).64 Egge65 carried out a useful study of normal Goldmann visual fields on 374 persons
ranging in age from 15 to 69 years, categorized by decades. Isopter
size declined steadily by decade throughout the sample, with regression
greatest for the temporal quadrants and more marked for central rather
than peripheral isopters. Variation over time fluctuated most for
the I-1 isopter, especially in the temporal quadrants. The isopters
were uniformly oval with a long horizontal diameter. Variation from this
shape was most common for the I-1 isopter, with the temporal margin
falling either outside (52%) or inside (11%) the
physiologic blind spot. With increasing age, a greater proportion
of subjects' I-1 isopters passed inside the blind spot; 76% of
subjects in the 60- to 69-year age group demonstrated this
pattern. COMPUTER-ASSISTED KINETIC PERIMETRY Semimanual, computer-assisted kinetic perimetry, designed to replicate
Goldmann-type manual kinetic perimetry is available as an optional programmed
kinetic perimetry (PKP) module on the Haag-Streit-Octopus 101 VFA (see
Fig. 20A). This instrument allows testing
of the complete 90° field pm a Goldmann-type spherically shaped bowl. The
perimetrist can program the specific stimulus size and intensity
from choices that match standard Goldmann stimuli. In addition, the
velocity and direction of stimulus motion can be set and remains constant
until the patient responds, thus eliminating intratest and intertest
variability in this critical parameter. The program compensates for
the reaction time of the patient, using the speed of the target and
its direction, and adjusts the locations of the “response points.” This
produces slightly larger “seeing areas” and
slightly smaller scotomas when compared with full manual perimetry (compare
Fig. 20, A and B). The computer draws the isopter lines, as
directed by the perimetrist. Arguably the most important feature, however, is
that the customized strategy originally chosen to test
a given patient can be repeated by the computer each time the patient
is retested, allowing more objective monitoring of changes with serial
visual fields obtained over time. Consequently, different perimetrists
can perform essentially the identical test on a patient at different
times. This addresses a key weakness in conventional manual kinetic perimetry
and reduces dependence on the skill and consistency needed by
the perimetrist. The kinetic (Goldmann) field result can be
combined with conventional static 30° threshold visual field, which
can be performed on the same instrument, and the static and kinetic
results can be superimposed on the printout. Because the Octopus PKP
and the manual Goldmann perimeter are both produced by the same company (Haag-Streit, Koeniz, Switzerland), the traditional instrument
will now presumably be phased-out, with the computer-assisted version
achieing greater acceptance as clinical studies demonstrate its
usefulness and reliability.
AUTOMATED STATIC THRESHOLD PERIMETRY At present, automated static perimetry has largely supplanted manual kinetic
perimetry for routine field examinations, although Goldmann-type
kinetic perimeters are still especially useful in certain clinical settings. The
following review emphasizes the appropriate use of automated
perimetry in clinical practice. Full-Threshold Static Perimetry Static perimetry refers to the technique of visual field testing performed with nonmoving
stimuli. Purely static examination with manual perimetry of the Goldmann-type
is time consuming and has been used in the past only on a limited
scale to spot check selected locations, such as the Bjerrum arcuate
bundles, or otherwise within the isopters initially defined with
manual kinetic perimetry. Computerized static perimetry has gained rapid
acceptance by providing systematically controlled presentation of brief, nonmoving
stimuli at selected locations. Therefore, it is more objective
and mathematically more exacting than the most rigorous manual
kinetic techniques. Furthermore, the random ordering of stimuli presentations
across the field of vision and the accurate registry of patient
responses, without the need for a perimetrist-facilitated visual field
examination, substantially decreases the test time and eliminates
operator variability. The latest of a series of different types of computerized
static perimeters are the Humphrey (Carl Zeiss Meditec, Inc., Jena, Germany) and Octopus (Interzeag AG, Koeniz, Switzerland)Visual Field Analyzers (VFAs), which are now the most widely
used automated perimeters. In automated static perimetry, the stimulus is constant in size and is
presented at programmed loci in the visual field for a controlled exposure
time. The most commonly employed threshold determination is a staircase
method in which true threshold is determined by presentations at
luminance levels brighter than and dimmer than threshold (bracketing). Typically, three to five presentations
are needed at each test locus. It should be recalled that the stimuli
are presented randomly at successively and subjectively unpredictable
locations; the bracketing presentations at a given locus may take
place minutes apart. A special strength of computer-assisted perimetry
is the capacity of the computer to keep track of stimulus–response
relationships at all test locations, and to place subsequent stimuli
randomly at the proper brightness to approach threshold as determined
by the patient's response to earlier presentations at that locus. The
staircase procedure used for full-threshold determination proceeds
as follows: The intensity of the stimulus at a given locus is either
increased (ascending) or decreased (descending) until
the stimulus is detected or missed by the observer, respectively. After
this initial threshold estimate is determined, the stimulus
intensity may be altered in the opposite direction using smaller steps. The
staircase procedure in current practice terminates after crossing
the threshold once or twice, and that design is considered closest to
ideal.66 Computerized automatic projection perimeters are capable of producing the
standard-size Goldmann test stimuli across the range of stimulus brightness
levels. It is customary to define the intensity of the stimuli
used by computerized perimeters and the thresholds measured in decibel (dB) units. The dB notation indicates attenuation in stimulus
brightness. The brightest stimuli produced by the perimeter have
the intensity of 0 dB, which may represent an intensity of 10,000 apostilb. Increasing
sensitivity (the ability to see dimmer stimuli) is
denoted by higher dB values, so that 10 dB and 20 dB indicate
attenuation of the stimulus brightness by 0 and 100 times, respectively (i.e., down to 1,000 and 100 apostilb). The stimulus intensity may be changed
by as little as one decibel (i.e., 0.1 log-unit steps) with each presentation after the initial estimate
of threshold sensitivity at a particular locus. With a normative database that is age specific, computer-driven perimetry
begins at a stimulus luminance close to the expected threshold for
each test point. However, threshold sensitivity may vary from the normal
at many test locations, making the normal threshold a poor starting
point. Another strategy selects a starting brightness based on thresholds
at adjacent points tested.67 This approach is efficient because there is a high degree of correlation
between thresholds at adjacent points, even within visual field defects. The Humphrey VFA starts the full-threshold examination and the various
screening protocols by testing four points, one in each quadrant. For
threshold determination, starting levels at adjacent points are based
on the threshold levels determined for these first four points. As testing
proceeds, starting levels at subsequent loci are based on thresholds
that have been determined for adjacent or other nearby points. Among a number of test grids available for evaluation of threshold sensitivity, a
rectangular grid of points at 6° intervals in the central 30° has
become the most standardized and frequently used array. The
Humphrey VFA 30-1 and 30-2 full-threshold examinations use 6° test
grids to evaluate the central 30° field, whereas the Humphrey 24-1 and 24-2 programs
test only the most central 24° by dropping
most of the peripheral test points on the same 6° grids. The Humphrey
Central 30-2 (Fig. 21) and 24-2 (Fig. 22) programs, which test 76 or 54 test locations, respectively, have
become the most frequently used and standardized programs because their
test loci straddle the vertical and horizontal meridians, providing
the optimal strategy for determining whether neurologic or glaucomatous
field defects respect these boundaries. Various screening strategies (described
later) may be applied to any of these specialized
or standard test grids. For example, the Humphrey Central-76 point
screening grid is identical to that of Central 30-2 threshold program. 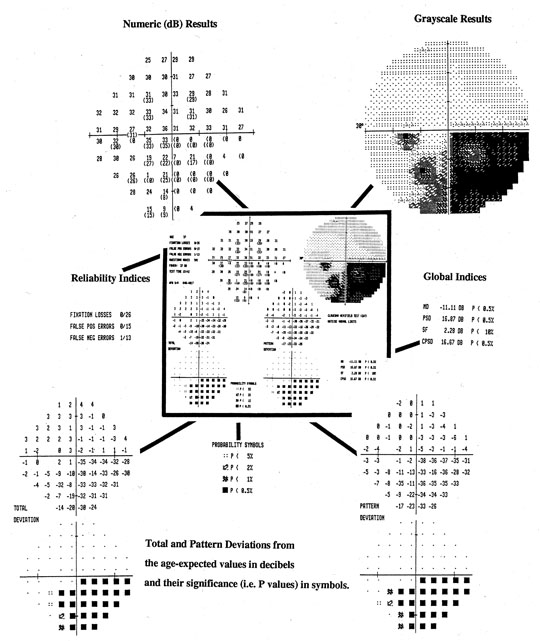 Fig. 21. Central 30-2 test using full-threshold strategy with STATPAC. Center (darkly outlined): Single field printout from Humphrey Visual Field Analyzer of data from
the left eye of a patient with an inferior arcuate scotoma and a dense
nasal step. Key components of the printout are shown, enlarged, around central display. Top left: Numeric threshold sensitivity values in dB (“raw data”). Top right: Gray-scale plot. Center left: Reliability indices. Lower Left: Topographic display of total deviation at each test point. Numeric values, representing
differences between patient's measures and those
of age-matched subjects with normal vision are shown, above, with corresponding
probability plots, below. Lower right: Topographic display of pattern deviation at each test point. Above, numeric
values (see text); Below, corresponding probability plots. Bottom center: Probability symbols defined; p values represent the probability that individual deviation from normal
value can occur in a normal subject. Right center: Global Indices (see text). Fig. 21. Central 30-2 test using full-threshold strategy with STATPAC. Center (darkly outlined): Single field printout from Humphrey Visual Field Analyzer of data from
the left eye of a patient with an inferior arcuate scotoma and a dense
nasal step. Key components of the printout are shown, enlarged, around central display. Top left: Numeric threshold sensitivity values in dB (“raw data”). Top right: Gray-scale plot. Center left: Reliability indices. Lower Left: Topographic display of total deviation at each test point. Numeric values, representing
differences between patient's measures and those
of age-matched subjects with normal vision are shown, above, with corresponding
probability plots, below. Lower right: Topographic display of pattern deviation at each test point. Above, numeric
values (see text); Below, corresponding probability plots. Bottom center: Probability symbols defined; p values represent the probability that individual deviation from normal
value can occur in a normal subject. Right center: Global Indices (see text).
|
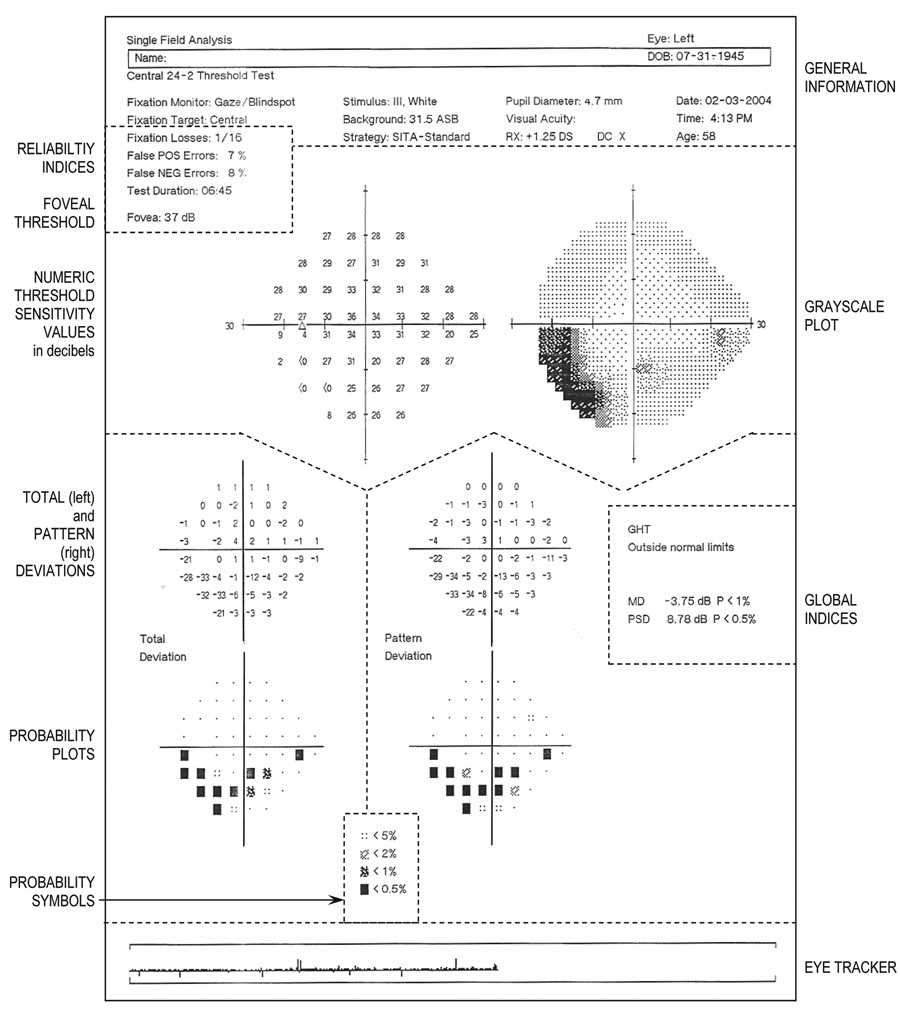 Fig. 22. Central 24-2 threshold test using SITA-standard strategy. Single field
printout from Humphrey Visual Field Analyzer from a 58-year-old patient
with an inferior arcuate scotoma, denser temporally. Key sections are
identified by legends alongside the printout and are separated by dotted
lines that have been added. Top: General information about the patient and the testing procedure. Just
below, on the left are the Reliability Indices and foveal threshold. Upper half: The large graphic display shows, on the left, the numeric threshold sensitivity values in decibels (raw data) and, on the right, the gray-scale plot. Lower half: Total deviation (left) and pattern deviation (right) at
each tested point. Numeric values are displayed topographically, above, with
corresponding probability plots, below. Bottom center: Significance level of the shaded probability symbols (used in probability
plots) are defined. Extreme right middle: Global indices (MD and PSD and their respective probability values).
 |
Many studies have compared automated static threshold perimetry with kinetic
Goldmann perimetry in different clinical settings. For example, Trope
and Britton68 compared findings using the Humphrey VFA and the Goldmann perimeter on 25 patients
with glaucoma, whereas Beck and colleagues69 compared the two perimeters in 171 eyes: 69 with glaucoma or intraocular
hypertension, 69 with neurologic vision disorders, and 33 with normal
vision. Overall, these studies have demonstrated that both the Humphrey
VFA and the Octopus perimeter are excellent at detecting glaucomatous
and neuro-ophthalmic field defects with a high degree of sensitivity
and specificity. However, it is important to note that, in contrast
to Goldmann perimetry, a significant percentage of the results with
automated perimetry were inadequate or unreliable, mostly because of fixation
problems, and patients much preferred the manually administered
Goldmann fields.68 Improving patient reliability and convenience by shortening the time and
effort required to obtain full-threshold tests has been a major challenge
that is being addressed by increasingly sophisticated systems and
protocols. The Swedish Interactive Threshold Algorithm The Swedish interactive threshold algorithm (SITA) is the latest refinement in the strategy used by the Humphrey VFA to determine
threshold values at the 52 or 76 points that make up the central 24-2 and 30-2 test
grids, respectively. SITA is optimized to minimize
test time, and thus, addresses the most important limitation of full-threshold
static perimetry. SITA has both a standard and fast version
that corresponding to STATPAC and FASTPAC versions of the full-threshold
Humphrey field tests (see later). However, by basing the
testing strategy on expected threshold values, data from surrounding
test locations, and how values at certain points influence the expected
values at other points, SITA has cut visual field time almost in half.67,70 Also, the staircase procedure is interrupted when a predetermined level
of uncertainty is reached. Test time is further reduced, adapting the
stimulus presentation rate in response to the patient's reaction
time (time pacing). A study comparing the SITA standard test
with the Humphrey full-threshold in 42 patients with optic neuropathies
or hemianopias and 28 normal subjects showed that, on the average, sensitivities
were approximately 1 dB higher in patients using the SITA
standard. The authors conclude that the SITA standard appears at least
as good as ful-threshold for detection of visual loss in individual
examinations.70 Because similar studies have found the SITA-standard comparable to the
full-threshold algorithm in a variety of conditions, the SITA-standard
test has now largely replaced traditional full-threshold tests on the
Humphrey VFA.67,70 However, one disadvantage of the SITA protocol is that it uses only Goldmann-equivalent
stimulus size III. Short Wavelength Automated Perimetry Some retinal diseases influence rod or cone function differentially and
selectively. Specific rod or cone deficits may be missed with white luminous
stimuli because the rods continue to operate at the modest photopic (mesopic) background levels of conventional perimeters. However, it
is possible to measure the threshold to a positive contrast (incremental) stimulus of one particular wavelength while
the background is illuminated using a different wavelength composition, thus
increasing the sensitivity of the test for cone disease. For
instance, a strong yellow adapting background selectively reduces the
sensitivity of the red and green cones, but it has a minimal effect on
blue cone sensitivity. When a blue test target is presented on a yellow
background, the visibility of the stimulus reflects the functionality
of the blue cone system. Blue-on-yellow (short-wavelength) automated perimetry (SWAP) has
been described as a “more sensitive” method
of detecting field loss in glaucoma71–73 and has become an optional testing mode on the Humphrey VFA. In that mode, a
static, blue stimulus of Goldmann size V is presented against a
high-luminance (200 cd/m2) yellow adapting background that saturates the red- and green-sensitive
cones and isolates the blue, short-wavelength-sensitive cones. A
prospective 5-year follow-up study of patients with glaucoma and ocular
hypertension indicated that visual field defects mapped using this
short wavelength technique could appear larger and seem to increase in
size more rapidly than those mapped with conventional white stimuli.74 In addition, early defects picked up only with blue-yellow testing converted
to visual field defects with conventional testing with progression
of disease.75 Although short wavelength automated perimetry remains promising and has
been shown to improve the discrimination of abnormal fields from normal
fields, the increase in variability that occurs with this technique
is a problem, and it has not yet replaced conventional automated perimetry
in the detection of early field loss.74,76 Other Automated Threshold Tests Certain specialized tests, available on the Humphrey VFA, are designed
to provide more information about specific regions of the visual field. Two
that are most useful are the Central 10-2 threshold test, which
tests at 68 locations within a circle of radius of 10° from fixation, and
the Macula test, which measures the threshold at only 16 points
within the central 5°. For both these test the locations are spaced 2° apart
and are offset on 1° from the principal meridians. The 10-2 test
is particularly useful in defining small, central and
paracentral scotomas that may reduce threshold values at only 1 or 2 central
points on the standard 6° test grids (30-2 and 24-2). Also, patients
with very advanced field loss who have only a small
central island of vision (e.g., those with advanced glaucoma or RP) can be tested with the 10-2 program, using
either stimulus size III or V. The Macula test determines
the threshold value at each of the 16 locations three times and provides
a better estimate of local short-term fluctuation (see the
following. When the patient is reliable, even very subtle abnormalities
of central vision can be detected and monitored over time. AUTOMATED STATIC SCREENING PERIMETRY Several screening tests are available on the Humphrey VFA. Initially, with
each test, threshold values at the same four original test locations
are determined and the expected threshold at each other point is calculated
from the normal shape of the hill of vision, which is adjusted
up or down according to the thresholds at the four original test locations. The
basic Humphrey screening strategy tests each point twice, with
stimulus brightness set 6 dB above expected threshold for each location. If
the first stimulus presented at a given location is detected, no
further presentations are made at this location. Thus, any defect
deeper than 6 dB should be detected. This method, known as the threshold-related
screening strategy, is used to screen for abnormalities without
any quantification, thus saving time at the cost of reduced information. Additional
data can be collected on points missed. Using the
three-zone strategy each missed location is retested with a maximally
bright stimulus to determine whether the loss of sensitivity is relative
or absolute, whereas when the quantify defects strategy is used, missed
points undergo full-threshold determination. These alternate screening
strategies take more time than simple screening, but provide more
information. The main purposes of screening visual field examination programs are to
establish the presence or absence of a visual field defect and indicate
the boundaries of any scotomas. Screening is particularly useful for
those patients who have not had previous visual field examinations. The
tests are not suitable for quantification of field defects, or careful
follow-up of patients to determine the progression of the disease
or the effectiveness of the treatment. FREQUENCY DOUBLING PERIMETRY Frequency doubling technology perimetry (FDTP) is a rapid, convenient
visual field test that can be used to screen for glaucoma and
other optic nerve disease.77 For this test, the 20° central field is divided into 17 target locations, four
test locations in each quadrant, and one central location (Fig. 23A). The stimulus is a low spatial frequency sinusoidal grating (0.25 cpd) that
undergoes temporal-frequency counterphase flicker, at
a rate of 25 Hz. (i.e., the black and white bands reverse rapid sequence). The program varies
the contrast of the grating and determines the minimum contrast
at which a patient can detect the flickering at each of the target locations. 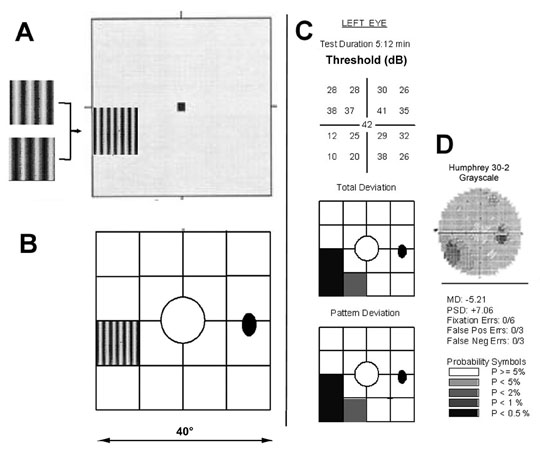 Fig. 23. Frequency doubling technology perimetry. A. The stimulus is a low spatial frequency sinusoidal grating (0.25 cpd) subtending 10°, presented at 1 of 17 test locations. The
grating alternates at a high temporal rate (25 Hz) between
two phases, shown at left. The frequency doubling illusion is the subjective
perception that the grating has twice the number of dark and light
bars (i.e., its spatial frequency appears to be 0.50 cpd), as shown in the diagram. B. Array of 17 stimulus locations, 1 central 10° circle and four squares
in each quadrant. C. Sample FDTP printout from OS in a patient with an inferior nasal deficit, showing
numerical full threshold values (top), probability plots of the total and pattern deviations (center and bottom, respectively), and global and reliability indices (bottom). D: Humphreyfull threshold 30-2 grayscale printout from the same patient, for
comparison. Fig. 23. Frequency doubling technology perimetry. A. The stimulus is a low spatial frequency sinusoidal grating (0.25 cpd) subtending 10°, presented at 1 of 17 test locations. The
grating alternates at a high temporal rate (25 Hz) between
two phases, shown at left. The frequency doubling illusion is the subjective
perception that the grating has twice the number of dark and light
bars (i.e., its spatial frequency appears to be 0.50 cpd), as shown in the diagram. B. Array of 17 stimulus locations, 1 central 10° circle and four squares
in each quadrant. C. Sample FDTP printout from OS in a patient with an inferior nasal deficit, showing
numerical full threshold values (top), probability plots of the total and pattern deviations (center and bottom, respectively), and global and reliability indices (bottom). D: Humphreyfull threshold 30-2 grayscale printout from the same patient, for
comparison.
|
The flickering gratings are detected only by the M-cell pathway, which
is responsible for generating the “frequency doubling illusion”—the
perception that the grating has twice the number of dark
and light bars (i.e., twice the spatial frequency).78 FDT perimetry is thought to be a sensitive detector of optic nerve pathology
because the nonlinear M-cell neurons that this test selectively
stimulates comprise no more than 5% of all retinal ganglion cells, and
it is precisely these cells that are most susceptible to early
damage in patients with glaucoma. This instrument was designed as a screening test for glaucoma and is excellent
for early detection of glaucomatous visual field deficits.77 There have been fewer studies on patients with neuro-ophthalmologic disease. One
study comparing FDTP and conventional full-threshold static
perimetry (Humphrey VFA 30-2 and 24-2) in 72 patients with
various nonglaucomatous optic neuropathies demonstrated that FDTP sensitivity
and specificity and the number, extent, and shape of the visual
field defects revealed were similar with both tests.79 However, the same study also evaluated 25 patients with hemianopic defects
resulting from chiasmal and retrochiasmal disease and showed that
FDTP missed hemianopic defects because it often failed to detect abnormal
test locations along the vertical meridian and because of the spurious
scattered abnormal test locations that were generated in these patients. The
authors attribute this to light scatter across the midline
from adjacent stimuli.79 A more limited study of 14 patients with recovered optic neuritis80 demonstrated that FDTP tended to localize the deficits to more peripheral
regions of the field, whereas conventional static threshold perimetry
localized the deficits more centrally, toward the fovea. Another study81 that included 138 eyes with neuro-ophthalmic field defects determined
that FDTP is a sensitive and specific test for detecting defects, but
that the technique could not accurately categorize hemianopic, quadrantanopsic, or
glaucomatous defects. Thus, it appears that, at present, the
main contribution of FDTP is to screen for and detect visual field
abnormalities. Use of this test to categorize the type of defect and
its cause, or to monitor patient for progression over time will require
further refinements.77,79 A new version of the FDTP, called the Matrix, has been introduced. It tests
more locations, each with smaller test areas than the original FDTP. The
data printout is more similar to the Humphrey Field Analyzer printout, making
interpretation and comparison easier. However, the usefulness
and acceptance of this test in the clinical evaluation of patients
with sensory neuro-ophthalmic disease remain to be determined. AUTOMATED VISUAL FIELD RESULTS AND INTERPRETATION Representation of Results (Graphic Display) In manual kinetic perimetry, loci where a particular stimulus is detected
are marked and later connected with lines (like isobars on a weather
map) to form isopters (see Figs. 5B and 20), as
has been described. Scotomas are outlined in a similar manner. With automated
static perimetry, the test data are not usually converted into
isopters lines per se. Instead, one or more of several different displays
may be used, depending on the program (screening or threshold) chosen. Usually, graphic and numeric representations of the measurements
made at each tested point in the viual field are presented
topographically on a chart of the particular test grid used. Figure 21 demonstrates
key portions of the graphic display generated by the central 30-2 full-threshold
test produced by the Humphrey VFA, which is
described later. Figure 22 shows a similar demonstration of key features
for the central 24-2 SITA-standard test. Other automated perimeters
provide similar displays.
Numeric Display A numeric display of the actual threshold values in decibels at each test
location on automated perimeters such as Humphrey VFA (Figs. 21 and 22, upper
left) can be charted to provide a topographical printout
of the “raw data.” Decreased sensitivity at any point
can be derived by comparing numeric threshold value at that point
to the following: (a) the values at surrounding locations, (b) the
threshold values at mirror image test locations in both
eyes of the same individual, or (c) mirrored points across
the horizontal and vertical meridians of each field. A few test points
with significantly reduced sensitivity occasionally occur by chance
alone. However, falsely abnormal points arising by chance should be scattered
randomly in the field. Clusters of two or more depressed points
must be regarded as true defects.
The detection sensitivity at each locus in the visual field decreases with
age. This decline with increasing age requires that the limits of
normal for all test locations be defined so as to enable comparisons between
the results from same or different individuals. The statistical
software packages, incorporated in Octopus and Humphrey VFAs, perform
comparisons between each patient's test results and age-expected
normal visual field threshold values for a particular test strategy. The
differences between the measured and age-expected threshold values
at each test location are shown in the total deviation map (Figs. 21 and 22, lower
left). In addition, for each tested point, these
programs calculate the statistical significance of the deviation in
sensitivity and compile empiric probability maps82 (Figs. 21 and 22, bottom). Such maps are easier and more accurate
to interpret than the numeric and gray-scale maps. These statistical
packages further facilitate the recognition and analysis of the defects
on a single visual field test by calculating global visual field indices (Figs. 21 and 22, middle right), which are interpreted later. In
addition, these programs compile and print out a longitudinal series
of repeat fields obtained on the same eye, facilitating the evaluation
of field changes that occur over time.
Grayscale (Symbols) Display The most common visual graphic representation of automated visual field
test results is the grayscale plot (see Fig. 21, upper right). The
sensitivity values obtained from the examination are assigned
different sized or shaded symbols on the computer printout of the test
result. Generally, the larger or darker the symbol, the lower is the
sensitivity (the denser the defect). The spaces between test
loci are assigned interpolated values such that the entire visual field
projection appears in various shades of gray. Because the peripheral
visual field has lower sensitivity than the center, the gray scale plot
will normally become darker towards the periphery of the field.
Reliability Indices (Catch-Trials) See Figure 21, center left, and Figure 22, upper left.
Fixation Losses The frequency of fixation losses is used to assess the patient's cooperation
with the requirement of steady fixation during the tes. In
the Humphrey VFA, the ratio of the number of fixation losses to the total
number of stimulus presentations in the physiologic blind spot is
recorded. Fixation losses exceeding 20% are regarded as a sign
of low patient cooperation. Although lack of accurate fixation does not
cause false field defects in normal eyes, it leads to underestimation
of the existing defects in glaucomatous eyes.83 False-Positive Responses The number of occasions when the response button is pressed without a stimulus
being presented represents the patient's over-willingness
to see in the field of vision. If the number of false-positive responses
is greater than 33% of sham stimulus presentations, the patient
is considered unreliable. A high number of false-positive responses
is an indication that existing field defects will be underestimated. False-Negative Responses Occasionally, an easily detectable suprathreshold (too bright) stimulus
is presented and the patient is expected to press the button
indicating the target was seen. False-negative responses are recorded
when the patient misses these suprathreshold stimuli; the percentage
of false-negative responses should be less than 33% for the patient
to qualify as reliable. An abnormally high number of false-negative
responses indicates the patient's lack of attention to stimulus
presentations during the test and may lead to apparently abnormal fields
in healthy persons and may overestimate the existing glaucomatous
field defects.83 During their first threshold test, 30% to 45% of patients
produce unreliable results because of difficulty in maintaining fixation
or because of too many false-negative responses.84 Subject reliability improves to 25% with experience;85 however, even with repeat testing, 4% to 9% of patients
consistently fail to generate reliable results, and the poor reliability
results almost exclusively from fixation losses. Factors such as age, pupil
diameter, and visual acuity do not influence the reliability
parameters.84 Deviation and Empiric Probability Maps STATPAC/FASTPAC and SITA programs on the Humphrey VFA calculate and
print out graphic displays of “total deviation” and “pattern
deviation” and empiric probability maps to assist in interpretation
of the threshold field results. Because the normal sensitivity
threshold at each test point varies, it is impossible to define
a minimum normal value for all test points. Consequently, the deviation
from the age-related normal threshold at each individual test location
must be determined. Deviations of 4 dB or more are presented topographically
in a map labeled “total deviation.” Using normative
data, the significance limits for the deviations at each test point
are calculated so that statistical significance can be attached to
deviations from the normal age-related values shown at specific test locations
on the map. The statistical significance of the deviation at
each test location is also presented in a graphic display called the total
deviation probability map on the Humphrey VFA (see Figs. 21 and 22, lower
left). Using defined probability symbols (see
Figs. 21 and 22, bottom center), the highest p value (p < 5%, p < 2%, p < 1%, and p < 0.5%) reached at each location is plotted at the corresponding
point on the map.
The total deviation at an individual test point is the sum of the deviations
caused by iffuse (generalized, homogenous) reduction
in sensitivity of the field plus localized reduction in sensitivity at
that point. Therefore, the total deviation plot reflects the global depression
introduced by media opacities, small pupils, and uncorrected
refractive errors (preretinal sensitivity loss) in addition
to localized decreases in field sensitivity resulting from retinal and
neurologic disease. The pattern deviation map (see Figs. 21 and 22, lower
right) is designed to filter out the diffuse or global
component of field depression and highlight the localized pattern loss
only. To accomplish this, it is assumed that the most sensitive points
in the field are outside any existing localized defects. An estimate
of the diffuse component of field depression is based on the deviations
from normal measured at 51 most sensitive locations within the central
portion of the field. The value estimated for the diffuse component
is subtracted from each of the individual total deviations to derive
the final numeric value of the pattern deviation at each test point. A
pattern deviation probability map (using the same symbols for p values described in the preceding) is then generated and displays
the significance (p value) of the pattern deviation calculated for each measured point.
Thus, the empiric probability maps (see Figs. 21 and 22, bottom) indicate
even the shallowest defects that deviate from normal and
also help to categorize the abnormal points according to the depth and
statistical significance of the depression. However, it is important
to realize that test-point significance on an empiric probability map
indicates only how often a particular threshold value can be expected
to occur in the normal population. The significance level does not indicate
the chance that a given deviation is normal.
Global Visual Field Indices Global visual field indices (see Figs. 21 and 22, center right) are
intended to summarize clinically important features in the visual
field by using conventional statistical methods such as the mean and
standard deviation.86 The calculation of the global field indices is possible only when the
age-expected normal threshold values are known for each of the individual
test locations in different age groups. Four parameters (MD, PSD, SF, and
CPSD, see later) are determined by the STATPAC and FASTPAC
programs for full-field threshold tests (see Fig 21, center
right), but only MD and PSD are derived by the SITA program (see Fig. 22, center right). In addition, probability values, based
on comparison with age-matched normal subjects, are provided alongside
each global index value. The four indices follow:
- 1. Mean Deviation (MD).The values on the Total Deviation plot are weighted by location and the
mean of those weighted values is given as the MD. Negative values represent
depression. This index is sensitive to a diffuse change in the
visual field and insensitive to small localized changes. It is also affected
by media opacities, refractive errors, and small pupil size.
- 2. Pattern Standard Deviation (PSD). The Humphrey VFA calculates from the standard deviation of all points
in the Standard Deviation plot. These values are weighted according to
location. PSD is an index of irregularity in the shape of the hill of
vision and reflects the extent of localized depressions in the visual
field.
- 3. Short-term fluctuation (SF). This index reflects the variability in the individual threshold values
with repeated testing during the test (.e., intratest and intraindividual variability). Thresholds for at least 10 randomly
selected stimulus locations are measured twice during
the test session, and the average variability in the repeat threshold
values obtained from both measurements is calculated. The square root
of the mean variance of all tested locations is taken as the short-term
fluctuation (SF). The SF for a patient's first threshold
test may be 3 dB, but it should decrease to below 2 dB with repeat
testing (SF less than 2 dB is normal). When the SF is higher, it
may represent a low level of patient cooperation and vigilance, especially
if there are other abnormal reliability indices. When the other
reliability indices are within normal limits, a high SF may be the
first sign of a visual field disturbance. Patient fatigue also may increase
the SF.
- 4. Corrected pattern standard deviation (CPSD). CPSD is the SD adjusted for SF on the Humphrey VFA. CPSD provides a more
accurate estimate of localized damage since both SF and localized damage
can cause an elevated SD. The SPSD filters out the intratest variability
component and provides a more accurate index of the true localized
defects in the visual field. CPSD (and SD) must be interpreted
cautiously in patients with advanced visual field loss, because
low (i.e., closer to normal) values can result when there is an overall reduction
in visual sensitivity.
|
